A great computer-based interactive at the DoTT07 Festival is in the Movement area. A digital map of the roads of the North East shows little dots moving around the area. Colour coded for the type of vehicle and number of passengers, the map clearly shows areas of considerable congestion. A “road” protrudes from the front of the display, on this are footprints for the number of people in your own vehicle. As this increases, from 1 to 4, a calculator shows the price per person decreasing, along with the environmental cost – expressed in carbon dioxide.

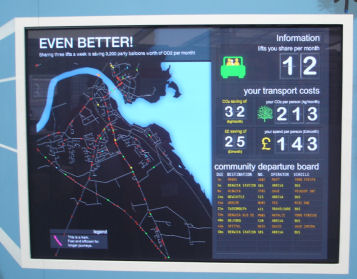
Beside this display is one which explores options in encouraging car pooling. Most of the options described focus on ways of putting potential passengers in touch with drivers – community notice boards figure highly, as do templates for cost sharing a “lift exchange” card seems well worked. I spoke to the woman there about NZ’s rideshare scheme.
As with most of the areas at DoTT, movement includes a case study of a school that has been actively working in this area. As a rural community, Scermerston recognises the environmental impact of transport. Many of the solutions though, are not about transport at all – instead the community has worked to structure itself to better not require transport at all.

Posted on October 20, 2007
0