“Sustainable Lens: A visual guide” published by NewSplash available through Amazon.

How to convey the essence of sustainability in a few sketched lines? I’m wading through the net and my bookshelves to find examples of the genre. I’m looking for schematics of the notion of sustainability itself rather than the underlying science – greenhouse, carbon, meso climate process, ground water, etc for which there are a zillion diagrams.
The list is not meant to be exhaustive, but if I’ve missed your favourite diagram, leave a link and I’ll add it to the list. Many of these images are duplicated all over the web, I’ve tried to find original sources (try tineye, is really cool), but again, let me know if I’ve missed something.
In no particular order, here’s 100 125 137 158 179 188 210 255 282 326 361 400 436 475 500 600 654 701 of what I’ve found.
1. Strong Sustainability
“This model recognises that the economy is a subset of society (i.e. it only exists in the context of a society), and that many important aspects of society do not involve economic activity. Similarly, human society and the economic activity with it are totally constrained by the natural systems of our planet” (NZ PCE quoted by Pam Willams (PhD)

2. OK, so there was a particular order, the strong sustainability circles had to go before the weaker (but much more common) Venn diagram, 3 circles (or triangles)
This model is very very common (google search sustainability Venn).
“There is some common ground where each of the circles converge, but the main priority in this model is the health of the economy. Economists sometimes refer to this as the weak sustainability model ….. it assumes that the degradation of one group of assets, (environmental, social or economic) can be compensated for by improvement in another and that externalities can be externalised (PRISM and Knight, 2000, cited in PCE, 2002). This weak sustainability model fails to acknowledge the ecological constraints that humans, other species, markets, policies and developments must operate within” (NZ PCE quoted by Pam Willams (PhD)

Venn diagrams coming together and showing changing dominance of sectors in a static animation.
3. Mickey Mouse (OzPolitic)

4. Venn circle with people, The circle of people give a context (Gerber)

5. Venn circles with each circle labelled (US National Botanic Gardens)

6. Four Venn circles (Halton Hills)

7 Venn 3 with overlaps named (see also WKU)

8. Venn with examples on each sector (Verify). (see also Environmental Planning, Omaha,

9. Venn 3 with callouts Swiss Transport Research Project

10. 3 aspects held together by shared values (Active Citizenship Toolkit)

11. 3 aspects as a stool (David Lock) “three legged stool”

12. More complex 3 legged stool (Italian Architecture)
 13. Stool with a broken leg (perhaps intentional?) from Willoughby City Council
.gif "ignitionsuite_image1656")
14. Venn 3 within a context (Curtin Centre for Developmental Health)

15. 3 aspects making whole “globe” (ProLogis)

16. Four Pillar (Jon Hawkes incorporates four interlinked dimensions: environmental responsibility, economic health, social equity, and cultural vitality >>)

17. Ken Stoke’s mindmap – Cross between 3 circles and concentric circles (animated)

18. Four well beings. The different forms of well-being as interconnected. Overall well-being, which it places at the centre, is enhanced when all four areas are given equal weight, are interdependent, and are able to move efficiently around the centre (NZ Cutural Well-Being).

19. Four factors integrated with level of engagement (Pegasus)

20. 3 circles in system (IR3S)

21. Business as a system (Interface) Prototypical company of 21st Century (cf typical model of 20th), and the damaging links that need to be eliminated.

22. 6 factor compass (ThyssenKrupp Steel)
In this concept, effectiveness and efficiency are central to all decisions and actions. Effectiveness means offering our customers the products and services they need in the required quality and at competitive prices. To remain successful in the market long term, we must achieve this through excellent productivity with an optimal balance of expense and income. Efficiency is represented symbolically as the opening angle of the equal-sided compass. The opening angle and the length of the legs determine the area circumscribed by the compass. The larger this area, the greater the latitude for a sustainable corporate policy. The degree of efficiency and effectiveness is the dominant factor.

23. Pathway (Eatwelldogood)

24. Anderson’s (Interface) pathway: Seven fronts of Mount Sustainability

25. Societies Diagram from Daniel Montano

26. 3 aspects with 3 dimensions and at different scales (Green Innovations)

27. Scope (from UN via open-sustainability)

27. Organisational constructions (Auckland)
There are many aspects to be considered if Auckland is to become a truly sustainable city. The Local Government Act 2002 makes reference to the ‘four well-beings’: social, economic, environmental, and cultural, but we need to break these down to a larger number of distinct themes in order to define tangible and achievable goals and targets.


28. Organisational construction (Sydney Olympic Park)

29. 7 spoke wheel (Carlson via Rosengren)

30. Sustainable Communities Wheel (Egan review, via Active Citizenship Toolkit).

31. People centred sustainability concepts: Sustainable Livelihoods framework . (see use and explanation on Chronic Poverty and another example on Practical Action)
32. Medicine wheel (this from Cardinal and Adin via Creative City Network Canada, lots of others- used by PennState Solar decathlon team)

33. Wheel from 350 “every citizen should be a sustainability steward” (source not cited)

34. Stockport’s Sustainability Wheel
During the sustainability appraisal process each individual proposed policy will be assessed against each of the twenty sustainability objectives. Commentaries are the most important outcome of the appraisal process. The purpose of the Sustainability Appraisal is to assist the Council in its selection of a preferred option by highlighting the sustainability implications of all development plan options


35. Building sustainability via a wheel with a pie graph (Packard)

36. Samsung’s wheel is somehow separated inside (3 aspects) and outside (Samsung)

37. Responsibilities of different parts of a sector (Wrap – construction) – why isn’t “decent housing” a role for the private sector?

38. Web of workstreams (Otago Polytechnic)

39. US Parks Service Guiding Principle of Sustainable Design (Leslie Starr Hart 1994)

40. Seed logo (Geometry of the SeedLogos)
 41. Seed logo integrated with balancing bodywork (Structural integration) (Geometry of the SeedLogos)
 42. Primary cross (Geometry of the SeedLogos)

Sky / Spiritual Earth / Material
Mind / Yang / Masculine Heart / Yin / Feminine
42. which gives… (Geometry of the SeedLogos)
 43. Star Tetrahedron (Geometry of the SeedLogos)

44. 12 Sector Seed Logo (Lipman)

45. Integrated systems Dan Black

46. Scale – sustainability is a long term deal (Martens)
“One of the options the policy-maker has—and this is not so far from the current situation—is to go for short-term goals and simple or cheap means of achieving them. In contrast to such an approach, a more pro-active, innovative standpoint can be adopted that pursues longer-term goals, taking into account developments on different levels of scale and in different sectors. Unquestionably, sustainable development demands the latter approach.
To facilitate decision making, sustainability scientists must assist in the task of making concrete both problems and solutions on all relevant temporal and spatial scales. This means that sustainability at the systemic level must be assessed, bringing to bear the following procedural elements: analysis of deeper-lying structures of the system,projection into the future, and assessment of sustainable and unsustainable trends.Evaluation of the effects of sustainable policy and the design of possible solutions through sustainable strategies also belong here.

47. Business operations from Environ

48. Aesthetically applied to seafood (found here, by Ray Troll and Terry Pyles for NOAA Fisheries)

49. Systems and timescales (Eucognition)
“show the different time-scales that relate to the goal-oriented and autonomous agency of a system, and the life cycle of its adaptation to the environment”… “Sustainability is guaranteed by an evolutionary process that underlies the actual behaviour of natural systems, and which is analysed at a different time-scale. It is for this reason that the sustainability of human technological and social systems is not guaranteed by a close coupling with the environment. The analysis of life cycle becomes therefore an essential component to determine the adaptive value of human activity.”

50. UK government: Securing the future – five key themes

51. Representation of issues with sustainable lens, NZ gender imbalances

52. IDEO’s lifecycle

53. Paper cycle (from Boise “culture of sustainability)

54. Product labelling (here because it represents a flow rather than checkboxes) (Nathan Shedroff)

55. Product pathway comparison (unsustainable, unsustainable with recycling, sustainable) from Tech


56. Social-ecological perspective for products, especially role of persuasion (Aaron “The value of sustainable development“)


57. UK energy flow (pdf) (many other Sankey diagrams)


59. Global Effects (Beechenhill Farm)


61. Integration of sustainability into business (Ecosteps)

62. Business opportunity (Treehugger)

63. Decision filter (Pumicestone Institute)

64. Enterprise process through sustainability lens from SustainCommWorld


66. Government process (NZ) “walking the talk“

67. Management helix for sustainable organisation (Natural Edge)

68. Factors influencing sustainability (Hopkins)
69. Sustainability on a “prosperity continuum” (Muskegon County)

70. City rankings (Sustainlane)

71. Sustainable design as organism Guiding Principle of Sustainable Design (Leslie Starr Hart 1994)

72. Limits to growth graphs

73. Ecological footprint

74. Footprint illustration (NZ Ministry for the Environment)

75. Integrity at core (University New Hampshire).

76. Personality enneagram within spheres (Blake)

77. Human-ecologic interchange (Washington State University)

78. Action at different levels (Ecosteps)

79. Sun (wheel really) Carillion

80. House at centre (Icology: Empowering individuals to end poverty)
This is our vision of the world: Universal access to quality, affordable and ecologically sound housing solutions.

81. Life cycle (Katholieke Universiteit Leuven)

82. Simply sustainable business model (NZ Ministry for the Environment)

83. Simplified flows (from Christain Science Monitor, John Kehe)

84. Human values journey (Robinson and Goleby)

85. Balance between society and environment (Taylor after Miller)


86. Organisational consciousness (Hoolenbach, University of Western Cape).

87. Marshall and Toffel apply Maslow to human and natural environment (Goffman: Defining Sustainability, defining the future)

88. Sustainability science (Kyoto)

89. Invisible values (Horiba investor relations)

90. Integrated ecological-economic worldview
O’Connor‘s image of non-ecological economic worldview

91. O’Connor‘s image of Daly (Beyond Growth)

92. O’Connor‘s Integral Economic worldview

93 Resource funnel (The Natural Step)

94. More complex funnel

95 Natural Step System Conditions

96. Natural Step System Conditions

97. Natural Step System Conditions (again)

98. Criteria flower (Steve Henry and Mark Jackson’s arrangement of Edwin Dzaskefki’s design criteria)

99. Capital and carrying capacity (from Colorado College, or here in Italian, neither sourced)

100. (no significance in number!) Computing Impact (Forum for the Future’s Connected: ICT and sustainable development)

101. Country positioning (from Colorado College, not sourced)

102. Development spirals (UNESCO)

103. Bottled water (Green Earth Beverage)

104. Sustainable infrastructure (Hokkaido University)

105. Widening engineering framework (University Cambridge Centre for Sustainable Development) (Note the cost/time/quality at the centre – “pick two you can’t have all three”)
 106. Complexity of Sustainability in China
(Financial) impact flow chart, Natsuko Kikutake NoBoundaries via Zones of Emergency

107. Poverty linkages interactive from Density Design

Who are the poor? Poverty is neither a number nor an index. It cannot be reduced to a line that divides those who are above and those who are below, establishing a unique space for social exclusion. Poverty is a multidimensional and complex phenomenon.
108. Earth systems (Global Environmental Centre, University of Wisconsin-Stevens Point )

109. Force field analysis model (Stuart Hill, after Lewin)

110. Venn Diagram as a web (Gutierrez, Sustainable Development Paradox)

111. Pattern Map (Conservation Economist)

112. 4 agendas for design (Design Issues Databank)

115. New paradigm (extension of time/cost/quality) Augenbroe and Pearce

116. Sustainable construction in a methodological framework, consisting of three main axes: System (boundary), Process (actor) and Aspect (sustainability). Augenbroe and Pearce

117. Systems approach (Bossel) (Interacting nested systems)


118. Factors affecting housing sustainability (Daniell et al ANU)

119. Anishinaabe Perception of Social-ecological Environments (Davidson-Hunt and Berkes)

121. Consequence analysis (AirQUIS)

122. Dimensions (Canadian Environmental Assessment Agency)
Evolution in environmental decision-making have defined circumstances in which more time (CIA) more space (RIA) or more systemic depth (SEA) is required. With each increase, the task (shown by the box) gets bigger and more cumbersome. Sustainable development requires ongoing, integrated and systemically complex analyses, and the task is both large and complex


123. Maori Tertiary Framework (NZ Ministry of Education)

124. Sustainability/Vulnerability (google caches to here, http://www.sustainablefoodlab.org but traced beyond that).

125. Holistic and fragmented worldviews (from Morgan, 2004b after Roberts, 2001, src: David Rei Miller, Western and Mäori Values for Sustainable Development)

126. Mauri model (Morgan, 2004a src: David Rei Miller, Western and Mäori Values for Sustainable Development)
There is thus a need for a decision-making tool that can be used at the Western-Māori interface, which is where most local government projects are developed. The mauri model developed by Kepa Morgan of Mahi Maioro Professionals is a set of assessment criteria similar to the Hellström model. It uses terms from Western science and mātauranga Māori that may be considered analogous. Corresponding to the four aspects of sustainability (environment, culture, society and economy) are four levels or spheres: the environment, hapu, community and whānau

127. Permaculture design principles (Tippett, Holocene)

128. Permaculture design principles (widely used…here, also here)


130. Sustainability Practitioner (Leith Sharp – ex Harvard? via World is Green)

131. Deisgn process Wever and vanKuijk
Four design strategies
We provide a typology of four user-centered design strategies for inducing sustainable behavior.
- Functionality matching: adapt a product better to the actual use by consumers and thereby try to minimize negative side effects;
- Eco-feedback: the user is presented with specific information on the impact of his or her current behavior, and it is left to the user to relate this information to his or her own behaviour, and adapt this behaviour, or not;
- Scripting: creating obstacles for unsustainable use, or making sustainable behaviour so easy, it is performed almost without thinking about it;
- Forced functionality: making products adapt automatically to changing circumstances, or to design-in strong obstacles to prevent unsustainable behaviour.
The four strategies are supported with examples from packaging, automotive and consumer electronics.

132. sustainability governance and reporting from Maggie Lawton.

133. similar space from Workspace (pdf of seven key principles)

134. Sustainability on different dimensions (Ecosteps)

135. Sustainability Tree (Ecosteps)
.gif "sustainability_tree1")
136. Sustainability related to brand value (Oliveira and Sullivan reported on Environmental Leader)

137. Mindmap from Natarajan Ishwaran and Rob Bernard

Here are more diagrams to explain sustainability (earlier post, 1-137).
138. 5 mindsets
- Earthly – focusing on the interplay between environmental and developmental agendas in the short- and long-term both globally and locally;
- Analytic – based on ‘systems thinking’ and encompassing assessment, planning and management;
- Careful – based on respect for complexity and uncertainty;
- Collaborative – focusing on the interplay of interests, values, cultures and capacities of various actors;
- Action – guiding strategy formation to manage change, continuity and learning for sustainability.
 139. 3 aspects mixed with a production cycle (Huhtamaki)

140. Governance and sustainability (Aras and Crowther)

141. Education for sustainable development without the participatory element as “big brother sustainability” Wals and Jickling

142. Assessment tool for cities (Ecostep)

143. Sustainability leadership principles (Mary Ferdig, Sustainability Leadership Institute via Nebraska Sustainability Leadership Workshop)

144. Tragedy of the Commons depicted in system terms (Senge via Warwick).

145. Map of Future Forces Affecting Sustainability (Global Environmental Management Initiative)

An Imperative for Looking Long: The 21st century will test our ability to grasp the future impacts of present choices, but even as we struggle to incorporate future knowledge into our day-to-day decisions, we’re tuning up our bodies and minds and even our cultural frameworks for a much longer view.
146.
Global sustainability related to international business

147. Sustainable farming (DEFRA)

148. City comparison (McKinsey company, in a study on the transition to sustainability for the greater London area (GLA)

149. Scenarios (Gallopin et al via Africa Outlook UNEP)

150. Backcasting (Arising) (see also TNS framework, backcasting process)

151. Pathways to sustainable industrial societies Osamu Saito , Encyclopedia of the Earth (see also principles from Morioka)

152. Pressure state response framework (OEDC via EoE).

153. Framework for environmental and economic accounting (Peter Bartelmus)

154. Resource flows across society set in the context of entropy (Everard)

155. Resource and energy flows within nature’s sustainable cycles and within a theoretical sustainable society (Everard TNS?)

156. Social-ecological system that places the built environment (an artefact) in an overlapping zone between culture and nature, with causation occurring in both directions (Fischer-Kowalski and Weisz in Moffat and Kohler )

157. Spatial scales, aggregation and specific effects (Moffat and Kohler)

158. Cultural, natural and material realms over spatial and temporal scales (Moffat and Kohler)

159. Spectrum of definitions Ken Haggart

160. Balance (Earth Illustrated) (see also Altran)

161. 5 capitals (Sigma project)

162. What, for how long? (National Academy of Sciences 1999)

163. Handprint (Action towards sustainability)

164. Increasing commitment Peter Mellalieu

165. Learning to do values framework (UNEVOC)

166. Commons river (from Barnes’ Capitalism 3.0)

167. Sustainable business value matrix (SustainAbility and UNEP 2001, used in simplified form here).

168. Ecosystem services (from Millenium Ecosystem Assessment, pdf, used in scenarios)

169. The maintenance of Ecosystem services with time, space and interventions (MEA, applied by Pereira to Sistel Portugal)

170. Invisible losses (Turner, in relation to Canadian aboriginal perspective).

171. Self-organising holarchic eco-social systems (Waltner-Toews, see also scale effects). 
172. 3 Venn and Strong seen as stages along a continuum (Engineering for Sustainable Development)

173. Ecological footprint/deficit map (Pierce)

174. How many planets? (from UK Interdependence Report) See also WWF One Planet Living

175. Nested adaptive cycles (Holling)
The growth phase we’re in may seem like a natural and permanent state of affairs-and our world’s rising complexity, connectedness, efficiency, and regulation may seem relentless and unstoppable-but ultimately it isn’t sustainable…
I think rapidly rising connectivity within global systems-both economic and technological-increases the risk of deep collapse. That’s a collapse that cascades across adaptive cycles-a kind of pancaking implosion of the entire system as higher-level adaptive cycles collapse, which causes progressive collapse at lower levels.” (Holling in Worldwatch)

(applied to Western Australian agriculture by Allison and Hobbs)


176. Human ecosystem model (Machlis)
The human ecosystem is defined asa coherent system of biophysical and social factors capable of adaptation and sustainability over time. Human ecosystems rest upon a foundation of abiotic and biotic factors taken as base conditions: a solar-driven energy system obeying thermodynamic properties, biogeochemical cycles of high constancy, landforms and geological variation of great complexity, the full genetic structure of life including biophysical properties of homo sapiens. The base conditions limit, constrain, influence and occasionally direct many human ecosystem processes. Boundaries can be spatially identified through ecological transition zones, administrative and political boundaries, or more fine-scaled analysis of sharp perturbations in system flows

177. Steady state economy (in comparison with standard growth model) Herman Daly. Summary from SANZ.
The Standard (Growth) Economy diagram is equivalent to the Triple Bottom Line and Mickey Mouse models. It assumes the possibility of evergrowing cycles of production and consumption without considering the role of the supporting ecosystem, thus establishing the belief that there are no biophysical limits to growth of the economy.
By comparison, the Steady State Economy diagram represents stabilised population and consumption. Resource throughput and waste disposal remain roughly constant, the scale of economic activities fits within the capacity provided by ecosystems, there is fair distribution of wealth, and allocation of resources is efficient.

178. Integral framework (Wilber’s integral quadrats, used by Barrett Brown) applied by Winton (in Br0wn).

179. Brown’s 15 elements of Ecovillage living

180. The Barometer of Sustainability (ICUN)
The Barometer of Sustainability is the only performance scale that measures human and ecosystem wellbeing together without submerging one in the other. The Barometer’s key features are:
• Two axes, one for human wellbeing, the other for ecosystem wellbeing. This enables each set of indicators to be combined independently, keeping them separate to allow analysis of people-ecosystem interactions.
• The axis with the lower score overrides the other axis in the analysis. This prevents a high score for human wellbeing from offsetting a low score for ecosystem wellbeing, or vice versa. This approach reflects the view that people and the ecosystem are equally important and that sustainable development must improve and maintain the wellbeing of both.

181. ‘The Egg of Sustainability’ (Robert Prescott-Allen, in IUCN, 1995)

182. Red triangle/Green Circle (from SustainAbility Gearing Up).
These high friction worlds are represented by the red triangle: low levels of trust increase friction in the system, with different sectors fighting (or ‘scapegoating’) each other.

183. Mapping environmental problems by management and revsersibility (UNEP Geo4)

184. Global environmental outlook framework (UNEP Geo4)
Net gains in human well-being facilitated by the social and economic sectors have, however, been at the cost of growing environmental changes, and the exacerbation of poverty for some groups of people

185. Shrinking Earth (UNEP Geo4)

186. Sustainability Asymptogram (Onwueme and Borsari – Proquest link)

100 percent sustainability is a perfect state that is practically unattainable by anybody or any system. No matter how good a person or system is, there is always a sustainability deficit that cannot be overcome, as entropy affects living systems and their physical habitats without exceptions. This means that there is always room for improvement. Different persons or systems are located at different levels on the curve, with larger or smaller sustainability deficits, but with deficits all the same.
187. Meadows’ framework (after Daly). (Balaton Group)
I see the triangle as saying there’s no way human ends can be realized without healthy, functioning natural and economic systems

188. Ecosphere as a mail sorter (Collins)
Imagine all of Earth’s chemistry as a mail sorter’s wall of letter slots in a post office, with the network of compartments extending toward infinity (see the bottom figure, next page). Each compartment represents a separate chemistry so that, for example, thousands of compartments are associated with stratospheric chemistry or with a human cell. An environmentally mobile persistent pollutant can move from compartment to compartment, sampling a large number and finding those compartments that it can perturb. Many perturbations may be inconsequential, but others can cause unforeseen catastrophes, such as the ozone hole or some of the manifestations of endocrine disruption. Most compartments remain unidentified and even for known compartments, the interactions of the pollutant with the compartment’s contents can usually not be foreseen, giving ample reason for scientific humility when considering the safety of persistent mobile compounds.

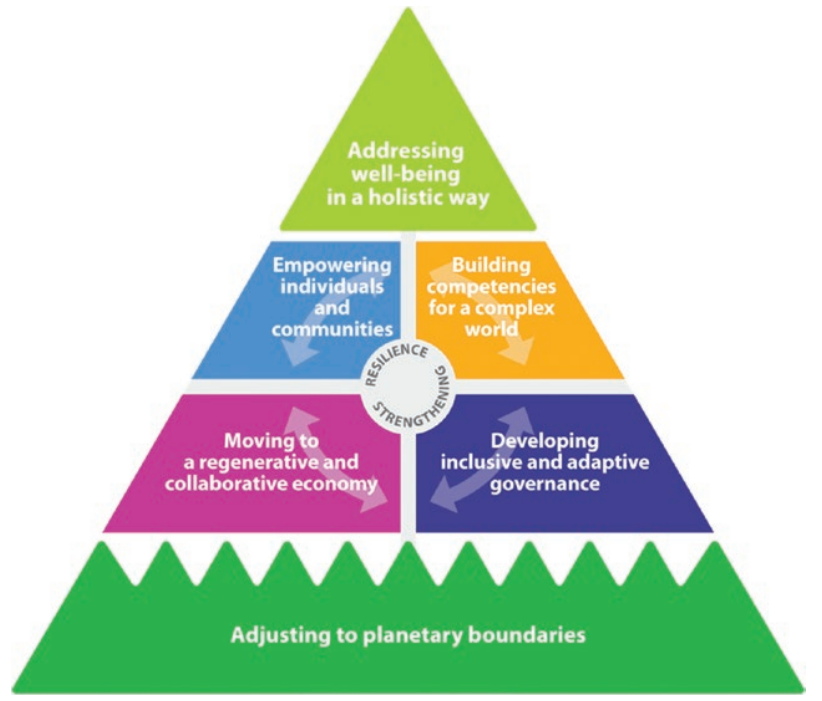
189. Sitra Sustainable Wellbeing Model (in Cook 2018)
190. Dominant and Life-affrming guiding metaphors (Glasser 2018, Glasser 2019)
The Cognitive, Agricultural, and Industrial Revolutions were adventitious. They were not planned or designed; they happened spontaneously and gradually. Driven by System 1, they were the result of our species’ unconscious opportunistic tendencies and ostensible biases towards perceived short-term beneft, self-interest, and silver bullets (leaping to innovative solutions before we really understand the problem we think we are trying to solve or whether the solution is really better than the status quo). Later, the acceleration of unfettered, decontextualized economic and technological growth further enshrined anthropocentrism, individualism, exploitation of humans and nature, and swelled
inequity.Our coming of age as a species, the Sustainable Well-being Revolution, is about taking responsibility for the awesome powers that we stumbled into.

191. Capitalist system (IWW poster, see also)
192 Cause and effect diagram (Fishbone or Ishikawa diagram, instructions). This from Stephen Hinton.

193 Road depends on where you start (Jo Johnston)
 194 Realms (Baudot via Ford)
![]()
195 Global footprint versus Human Development Index (WWF via Oildrum)

196 Sequence of world systems 1949, 2007, 2030, 2050 (Charles Hall via Oildrum)

197 Node diagram (Isaksson and Steimle, img)

198 Human life project (young child version, also young adult and adult). (Jennifer Ranville, overview)

199 Cycles in Sustainable Economy (Carana).

200 Creating sustainable value framework (Hart and Milstein via Brinq)

201 360 model (Hollingworth)

202 Zoom zoom to make the tree grow (Mazda)
Mazda is working towards a sustainable future that brings continued happiness and excitement to people in a global society, by developing vehicles that never fail to excite, visually capture the customer’s heart, and provide a fun driving experience that keeps bringing them back to Mazda.

203 Diagram of Everything Living (Gurdjieff see also Ray of Creation)

204 Four capitals (on a tree) University of Vermont Gund Institute for Ecological Economics

205 Pattern Dynamics (Tim Winton)
Through his work as a sustainability educator Tim recognised the need for a common ‘language’ in sustainability. PatternDynamics is a set of symbols representing the organizing principles of the natural world.

206 First Nations Ecology (First Nations Development Institute – can’t find original, this via)

207 Mind map (many variants, this “Intention to sustain” Touchedbyamoose, see also)

208 Four Dimensions of intelligence (TLC Solutions)
The four dimensions are based on the concept of dimensions of space and time, where the use of predominantly one dimension leads to a one-dimensional form of leadership. The more we are able to utilise additional dimensions, the greater depth we develop and implement as leaders. The fourth dimension is absolutely critical – the dimension of time. Most people can be a great leader at a single point in time, but what makes a great leader over time, sustainably, is the fourth dimension.

209 Self organising success (Mike Bell, Wisdom Meme)
All self-organising systems rely on the interconnectedness of eight design elements (or energies) for their survival and growth:

210 Child rights ecology model (ex UN Convention Rights of the Child, David Ortiz via Open University).

211 Steps to Ecology of Mind (Gregory Bateson via Poe)

212 Spaceship
Spaceship Earth was so extraordinarily well invented and designed that to our knowledge humans have been on board it for two million years not even knowing that they were on board a ship
there are no passengers on Spaceship Earth Fuller (1965 in Vallero 2005. 367)

(see also representations of cabin ecology research)
213 Permatopia (Mark Robinowitz)

214 Industrial Bubble (Geoff Brown)

215 Five Earths of the Bible (Lamb and Lion Minstries)
The first earth was the one created in the beginning (Genesis 1:1). It was perfect in every respect (Genesis 1:31). But because of Man’s sin, God placed a curse upon the earth (Genesis 3: 17-19).
The fourth earth — the millennial earth — will be very different from the present earth. The earthquakes that will produce it will be the most severe in history. Most important, the curse will be partially lifted, making it possible for Man to be reconciled to nature and for nature to be reconciled to itself. The wolf will dwell with the lamb because the wolf will no longer be carnivorous. The nursing child will play with the cobra because the cobra will no longer be poisonous (Isaiah 11:8).
But Satan’s last revolt at the end of the Millennium will leave the earth polluted and devastated (Revelation 20:7-9). Thus, at the end of the Lord’s reign, God will take the Redeemed off the earth, place them in the New Jerusalem, and then cleanse the earth with fire (2 Peter 3:10-13).
 216 Change Map (Clare Graves, Beck and Cowan via eman8) See also Spiral dynamics (image)

217 Sustainability mapped as megatrend (Richard Watson). Higher res.

218 Deformation of Pentagram (Di Castri via Savchenko)

219 Ecology, Equity, and Economy Triangle by McDonough and Michael Baungart From the book, Cradle to Cradle: Remaking the Way We Make Things by William McDonough and Michael Baungart

220 Alden Dow’s A way of life cycle (“Alden B. Dow Midwestern Modern” by Diane Maddex)
 221 Puzzle (from Affluenza.org)

222 Puzzle Slide (Henry Fiddler)

213 Social zones of sustainability (Confronting Change)

224 Mimetic feedback influence model ( Gutirrez from Girad) (imitation role as motivator)

225 Pattern of Sustainability (Joanne Tippet, dissertation)

226 River system health. Triangle has flows, processes, and is in context of larger scale. Vugteveen et al. (2006). 
227 Continuum of human impacts and normative valuation of quality. For river condition Vugteveen et al. (2006).

228 Entrepreneurship (Tilley and Young)
229 Accounting cube (Forum for the Future)

230 Niche transitions (Schot and Geels)

231 Venn diagram with sustainability as integration (cf intersection) Schalange
232 “Sustainability is a relational principle” (Sandelands and Hoffman)
233 Triangle (sort of) in transition (Said, Malaysian construction firms IJOrgInnovation 2:336 ).
![]() 234 Prism (Puhakka et al, Scandinavian tourism)
234 Prism (Puhakka et al, Scandinavian tourism)
235 Markets (O’Riordan after Anderson)

236 Navajo Hooghan (developed by Navajo Flexcrete, O’Neill et al.)
The Hooghan is highly symbolic of the Navajo’s spiritual understanding of the interconnectedness of all things through all time. A visitor enters the Hooghan from the East, the direction in which the door of the Hooghan always faces. East is the direction of the sunrise, which begins the day and is symbolic of the beginning of life. The visitor moves clockwise through the four quadrants. The first quadrant belongs to the Mother, who represents work and wealth, which is passed through maternal inheritance. The Father and, when he visits, the Medicine Man, occupy the south-west quadrant. The Father ties the families and clans together through marriage. The Medicine Man is a vehicle for the fundamental beliefs and values of the Diné. The north-west quadrant is for the Children, whose basic needs must be taken care of by the Father and Mother. The north-east quadrant is where the visitor ends and where Visitors gather when in the Hooghan. The Navajo consider all of life to be integrated and sacred, thus the entire structure is the ‘Spiritual’ whole. The Hooghan thus embodies all of the aspects of life.

237 Strategic life-cycle management (SLCM)—sustainability principles as system boundaries. (Principles are Natural Step, Ny et al)

238 Belief–Action–Outcome Framework (Melville after Coleman)
We introduce an additional antecedent, organizational structure, as well as an additional outcome, behavior of organization (Figure 2). In this way, we account for dual socialization (individual psychic states are shaped by social structure (link 1) and organizational structure (link 1′)) and dual outcomes (combined individual action may improve organizational (link 3′) and environmental (link 3) performance)…

239 Lifestyle balance (Matusaka and Christiansen)

240 Ethical frameworks (and surely a golden snitch). Laszlo et al.
241 Integrative triangle applied (Kleine and von Hauff)

242 Integrative triangle applied to institution (Kleine and von Hauff)
 243 Integrative triangle: levels and tendencies (Kleine and von Hauff)

245 Integrative triangle as an assessment tool (Kleine and von Hauff)
 246 Harmonic and conflict relationships on Integrative triangle (Kleine and von Hauff)
 247 Wilbur’s holon (Kira and Eijnatten)

248 Organisation, development and human resources (Jabbour and Santos)

249 Causal loop diagram: Qualitative system dynamic (effects of changes in municipal wastewater management, Guest et al.)
250 Pocket knife (as part of quality process management, Goel)

251 Logically vivid system (Dinga)

252 Interactions between disciplines required for sustainability as gears and layers. Relationship of protectiveness of ecological health layer, requires several tiers (here shown as gears) (Using buffer lands, Burger) 
253 Continuum of interest (Hemant Puthli)

254 Stock of environmental quality (tourism sites, Johnston and Tyrrell)

255 Circles stacked and in a graph of time and space (Japan for Sustainability)

256. Imperatives (Scottish Government attributes Irish EPA, but I can’t find)

257. Triangle with explicit balance (INAP)
The balance point at A, which weighs the social and economic more heavily than the environmental, is equally acceptable as the point of balance at B, which weighs the environmental more heavily. The most suitable point of equilibrium can be identified only through an integrated consultative process involving all stakeholders.

258. Aims of Environmental Education (NZ Government)

259. Future generations (Australian Government Intergenerational Report)

260. Three circles in one (espdesign)

261. Stool gives a short shrift (Storck)

262. Spring (KÖVET Association for Sustainable Economies)

263-266 Systemic mapping of strategic dilemmas (Anthony Judge for Intersectoral Dialogue in preparation for Earth Summit).
To explore and illustrate new possibilities, the focus of the exercise described here is on identifying “strategic dilemmas· underlying debates on Earth Summit issues. These are the dilemmas which reflect such seemingly irreconcilable concerns as safeguarding watercourses versus exploiting essential hydro-electric energy reserves. The assumption is that the set of these local (namely issuespecific) long-term dilemmas may offer clues to new patterns of global (namely inter-sectoral) strategies and bargains.
The intention was to obtain suggestions for inter-sectoral images which could best capture the Earth Summit insights and empower people to move forward in new ways.
There was a concern to move beyond the traditional text representation of the challenges of inter-sectoral dialogue and to endeavour to open up new possibilities by portraying sectoral and issue relationships in two and three-dimensions.
Pattern of strategic dilemmas in table form designed to code and organize strategic dilemmas of sustainable development. Sustainable development is a function of the pattern as a whole rather than of its components.
263. Table of strategic dilemmas
(A checklist of sectoral declarations) fails to respond to the need to raise the level of debate by offering a global (inter-sectoral) context for specific bargains, checks and balances. Such checklists, like Agenda 21, are effectively overwhelming. They encourage simplistic attempts to identify “the most important problem” whose solution it is hoped will magically transform all the others.
(The table) is one attempt to respond to this situation by showing how different social functions,understood as strategic opportunities, interfere with each other to engender a pattern of strategic dilemmas.

Example code groupings

264. Network of bargain areas
The traditional tabular presentation (of the table) is itself a conceptual trap. It encourages a very mechanistic approach to the pattern of dilemmas, reinforcing tendencies to much-contested forms of “linear thinking”. The linearity may be deliberately challenged by allowing the information to be encoded or projected onto a network. In this exercise the network has been deliberately chosen to facilitate comprehension of global properties of the pattern of strategic dilemma.
The 6 hierarchical structures below may be viewed as caricatures of a set of currently competing world views. In each, the dominant function (from the table) tends to distort or suppress the operations governed by the recessive functions (in much the same way as the gene for brown eyes masks the expression of the “blue eyes’ gene). The challenge of sustainable development is to interweave the functional contributions so that all are both expressed and constrained under appropriate circumstances.

265. Representation of issue arenas on icosadodecahedral net
Globally patterned network (see Figures 3A and 3B) chosen to be compatible with the set of strategic functions (in a previous table). The areas can then be used to signify issue- specific bargain arenas. The network is thus a globally organized network of local bargain arenas (where global and local are understood in a functional rather than a geographical sense).
The systemic coherence of the network pattern of Figure becomes clear when it is seen how the 2-dimensional network may be folded around the surface of a sphere in 3 dimensions. This establishes the functional globality of the pattern of bargain arenas and the associated strategic dilemmas.
Further insights into how local bargains may interlock may be obtained by considering the tensegrity structures which illustrate the principles by which spherical structures can be rendered self-sustaining in practice. Tensegrity structures are effectively patterns of sustainability.


This approach points to new policy possibilities in which the degree of global consensus required is reduced to a minimum (in a design sense) by localizing the patterns of disagreement. In this way disagreement no longer acts globally — tearing apart the global community. Rather it is locally confined and understood as a long-term strategic dilemma on which ·consensus· can only be achieved in the short-term. Sustainability thus lies at the global level not at the local level.
266. Two columns of bargaining areas
These may be understood as simpler (3-valent) and more complex (5-valent) bargaining arenas around specific concerns.
…a tentative indication of the significance of each code is given here (not all shown here) . The codes appear in two columns. The left hand column indicates a development-focused application of the strategies. The right hand column indicates an environment-sensitive application of the strategies.

267. Prism of health and sustainability (Parkes et al.)

270. Trajectory of environmentally responsible design (NZ Ministry for the Environment)
This figure illustrates that ‘Conventional practice’ and ‘Green/high performance design’ both fall beneath the bar of sustainability. This is because they are still degenerating ecosystems and human health. ‘Sustainable design’ can be thought of as neutral. This is because it neither causes ecosystem degeneration, but nor does it contribute to positive outcomes. ‘Restorative design’ and ‘regenerative design’ are regenerative systems and are above the bar of sustainability. This is because they have positive ecological and community outcomes. As design moves from conventional, to green, through sustainable and onto restorative and regenerative, less energy is needed. A conventional design can be thought of as relating to a fragmented system. Green or high performance as well sustainable design solutions tend to focus on new techniques and technologies. Restorative design takes into account the whole system, and regenerative design encompasses a full understanding of living systems (including humans).

271. Triangle showing factors, on ‘geographic space” ( Nijkamp modified by Dourojeanni) 
272. Diverse hierarchical levels and limits of universal lawlessness (Gasto et al 2009)
The core problem of sustainability is given by not respecting the highest hierarchical levels, exceeding their limits of universal lawfulness. A good decision must be sound in each and all of the hierarchical levels.

273. Focus point of four hierarchical dimensions (Gasto et al 2009)
…relate the contiguous pairs of the four fundamental hierarchical dimensions with four acting axes. Between the local and the anthropocentric are the stake-holders, or civil society, directly managing the phenomenon. Territory governance arises between the anthropocentric and the global context. This scheme sets the properties and demands of the ruled system (natural and anthropogenic) and the provisions that the ruling system must have (anthropogenic) to give control to the territory (Jentoft, 2007). It also states that the general functions of the ecosystem has to be considered for such effects as the maintenance of zones destined to control greenhouse gases, the regulation and purification of waters, and the conservation of culture. The maintenance and application of global international agreements is centered on the relationship between the ecocentric axis and the globalization of human actions. Whatever the nature of the human actions, they must be conditioned by restrictions of ethical and aesthetical nature, which are located between the local and ecocentric axes. If these factors are not satisfied, system sustainability deteriorates.
In this context, human presence constitutes an integral part of all ecosystems; its actions are relevant in global impact and deterioration (McDonnell and Pickett, 1993; Vitousek et al, 1997; Lubchenco, 1998). The focal point is the center of divergence from where the position of confluence of the different hierarchical axes intervenes in the human actions and the social agent’s decision-making are established. Therefore, the natural and cultural generic restrictions are integrated into the territorial restrictions. As a result, new illicit spaces appear, because the solution can be contained in the inner legal space of one of the systems, but outside of other systems.

274. MAIN prism (Kain 2000, in Keiner) (an abstraction of World Bank’s four capitals model and CSD’s social, economic, environmental, institutional).
Mind, Artefact, Institution and Nature in order to relieve the prism from the burden of expressions as social and economic, which are judged to be more confusing than explanatory. The environmental dimension (nature) comprises all natural capital, which may be subdivided into stocks of non-renewable and stocks of renewable resources. The economic dimension (artefact) stands for all man-made material assets such as buildings and roads. The social dimension (mind) should be perceived as the awareness of the individual subject (worldview, knowledge, and experience). The institutional dimension concerns the organization of our society and the relation between people.

275. Never-ending triangle of sustainable development (Välimäki 2002, in Stanners et al. 2007).

276. Daly empty versus full world (Daly 2001, selected essays 2007).
![]()
277. Conceptual framework within which the territorial, temporal, and personal aspects of development can be openly discussed (Seghezzo 2009)

278. Roots of the modern view of sustainability (Kidd 1992, in Bell and Morse 2008)

279. Venn diagram with feedback loops (DEFRA Estuary Guide 2009)

280. Spatial systems framework (Niu et al 1993).

281. Linkages between ecological, social and cultural systems (Ingold 1980).
Not strictly sustainability, but interesting as 1980 exploration of dynamics of relationships between social and ecological systems. Used to explore different models of utlisation of reindeer (hunting, pastoralism, ranching), despite similar environment and ecology in Artic tundra.

282. Living Resource Conservation for Sustainable Development (World Conservation Strategy 1980)
The strategy saw conservation as a means to achieve social and economic objectives, and social and economic constraints as barriers to achieving conservation objectives (elements are on the same page, nearly integrated as what we now know as sustainability).

283. Circles of sustainability (McCarthy and James wiki)
The Circles of Sustainability approach is explicitly critical of other domain models such as the triple bottom line that treat economics as if it is outside the social, or that treat the environment as an externality. It uses a four-domain model – economics, ecology, politics and culture. In each of these domains there are 7 subdomains.

284. Sustainable Food Systems (3 circle Venn diagram with food supply chain) (Institute of Food Science and Technology 3keel Richard Sheane)

IFST (highlighted on the figure above):
-
Resource risks and pressures: The food system is dependent on the natural environment and at the same time is causing significant environmental impacts
-
Healthy sustainable diets: There is a need to deliver good human and environmental health outcomes from the food system at the same time
-
Circular economy and sustainable manufacturing: The current economic model of “take-produce-consume-discard” is unsustainable
-
Novel production systems and ingredients: There are opportunities for developing new farming and manufacturing technologies to deliver sustainable nutrition
-
Decent work and equitable trade: The livelihoods and working conditions of the 1+ billion people who work in the food system need to be improved
-
Transparency, traceability and trust: New software and data can help drive improvements in food system sustainability and strengthen consumer trust
285. Hire wire act. (Thinkup construction)

286. Sustainable Livelihoods Framework http://www.glopp.ch/B7/en/multimedia/B7_1_pdf2.pdf
“…The framework depicts stakeholders as operating in a context of vulnerability, within which they have access to certain assets. Assets gain weight and value through the prevailing social, institutional and organizational environment (policies, institutions and processes). This context decisively shapes the livelihood strategies that are open to people in pursuit of their self-defined beneficial livelihood outcomes.” (Kollmair et al., 2002)

287. Window of viability on top of a hill. (Ellen MacArthur Foundation)

289. Strong sustainability bullseye linked to Landscape Sustainable Science (and design-in-science paradigm, Huang et al 2019).

290. Principles on a three pillar triangle (Penn State after Gagnon, see also Alkadd et al. 2016)
Those principles placed in the center of the diagram combine all three aspects of sustainability to a certain degree and hence their implementation would benefit all societal, environmental, and economic stakeholders.

291. Aidan Davidson’s atom (2008).
In my efforts to think and act through paradox in search of sustainability, the much-maligned idea of ambivalence has been of great help. Conversely, I have found unhelpful the Venn diagrams routinely used in sustainability texts to depict overlapping sets of cultural, social, economic and environmental concerns. I offer, then, with usual caveats about simplification, the metaphor of atomic structure as a potentially more interesting heuristic device.
Imagine principles of sustainability as a tightly aggregated nucleus around which orbit only loosely aggregated goals of sustainable development. The small area of agreement established by the ideal of sustainability is nonetheless sufficient to bind together a wide constellation of diverse sustainable development objectives. These objectives orbit in varying relations of proximity and stability to sustainability ideals, establishing a large field of contestation. Just as the cohering of positively charged nucleus and negatively charged electrons produces the elemental character of an atom, so too the ambivalent coupling of ideals and practices is the defining, coherent strength of the quest for sustainability. And just as the great majority of space within an atom is empty, composed not of matter but rather of potential trajectories for movement and interaction of matter, so too is the value of debate about sustainable development not to be found in fixed definitions and assertions. It is to be found in the movement and interaction of ideas and interests on retrospective questions of the future.

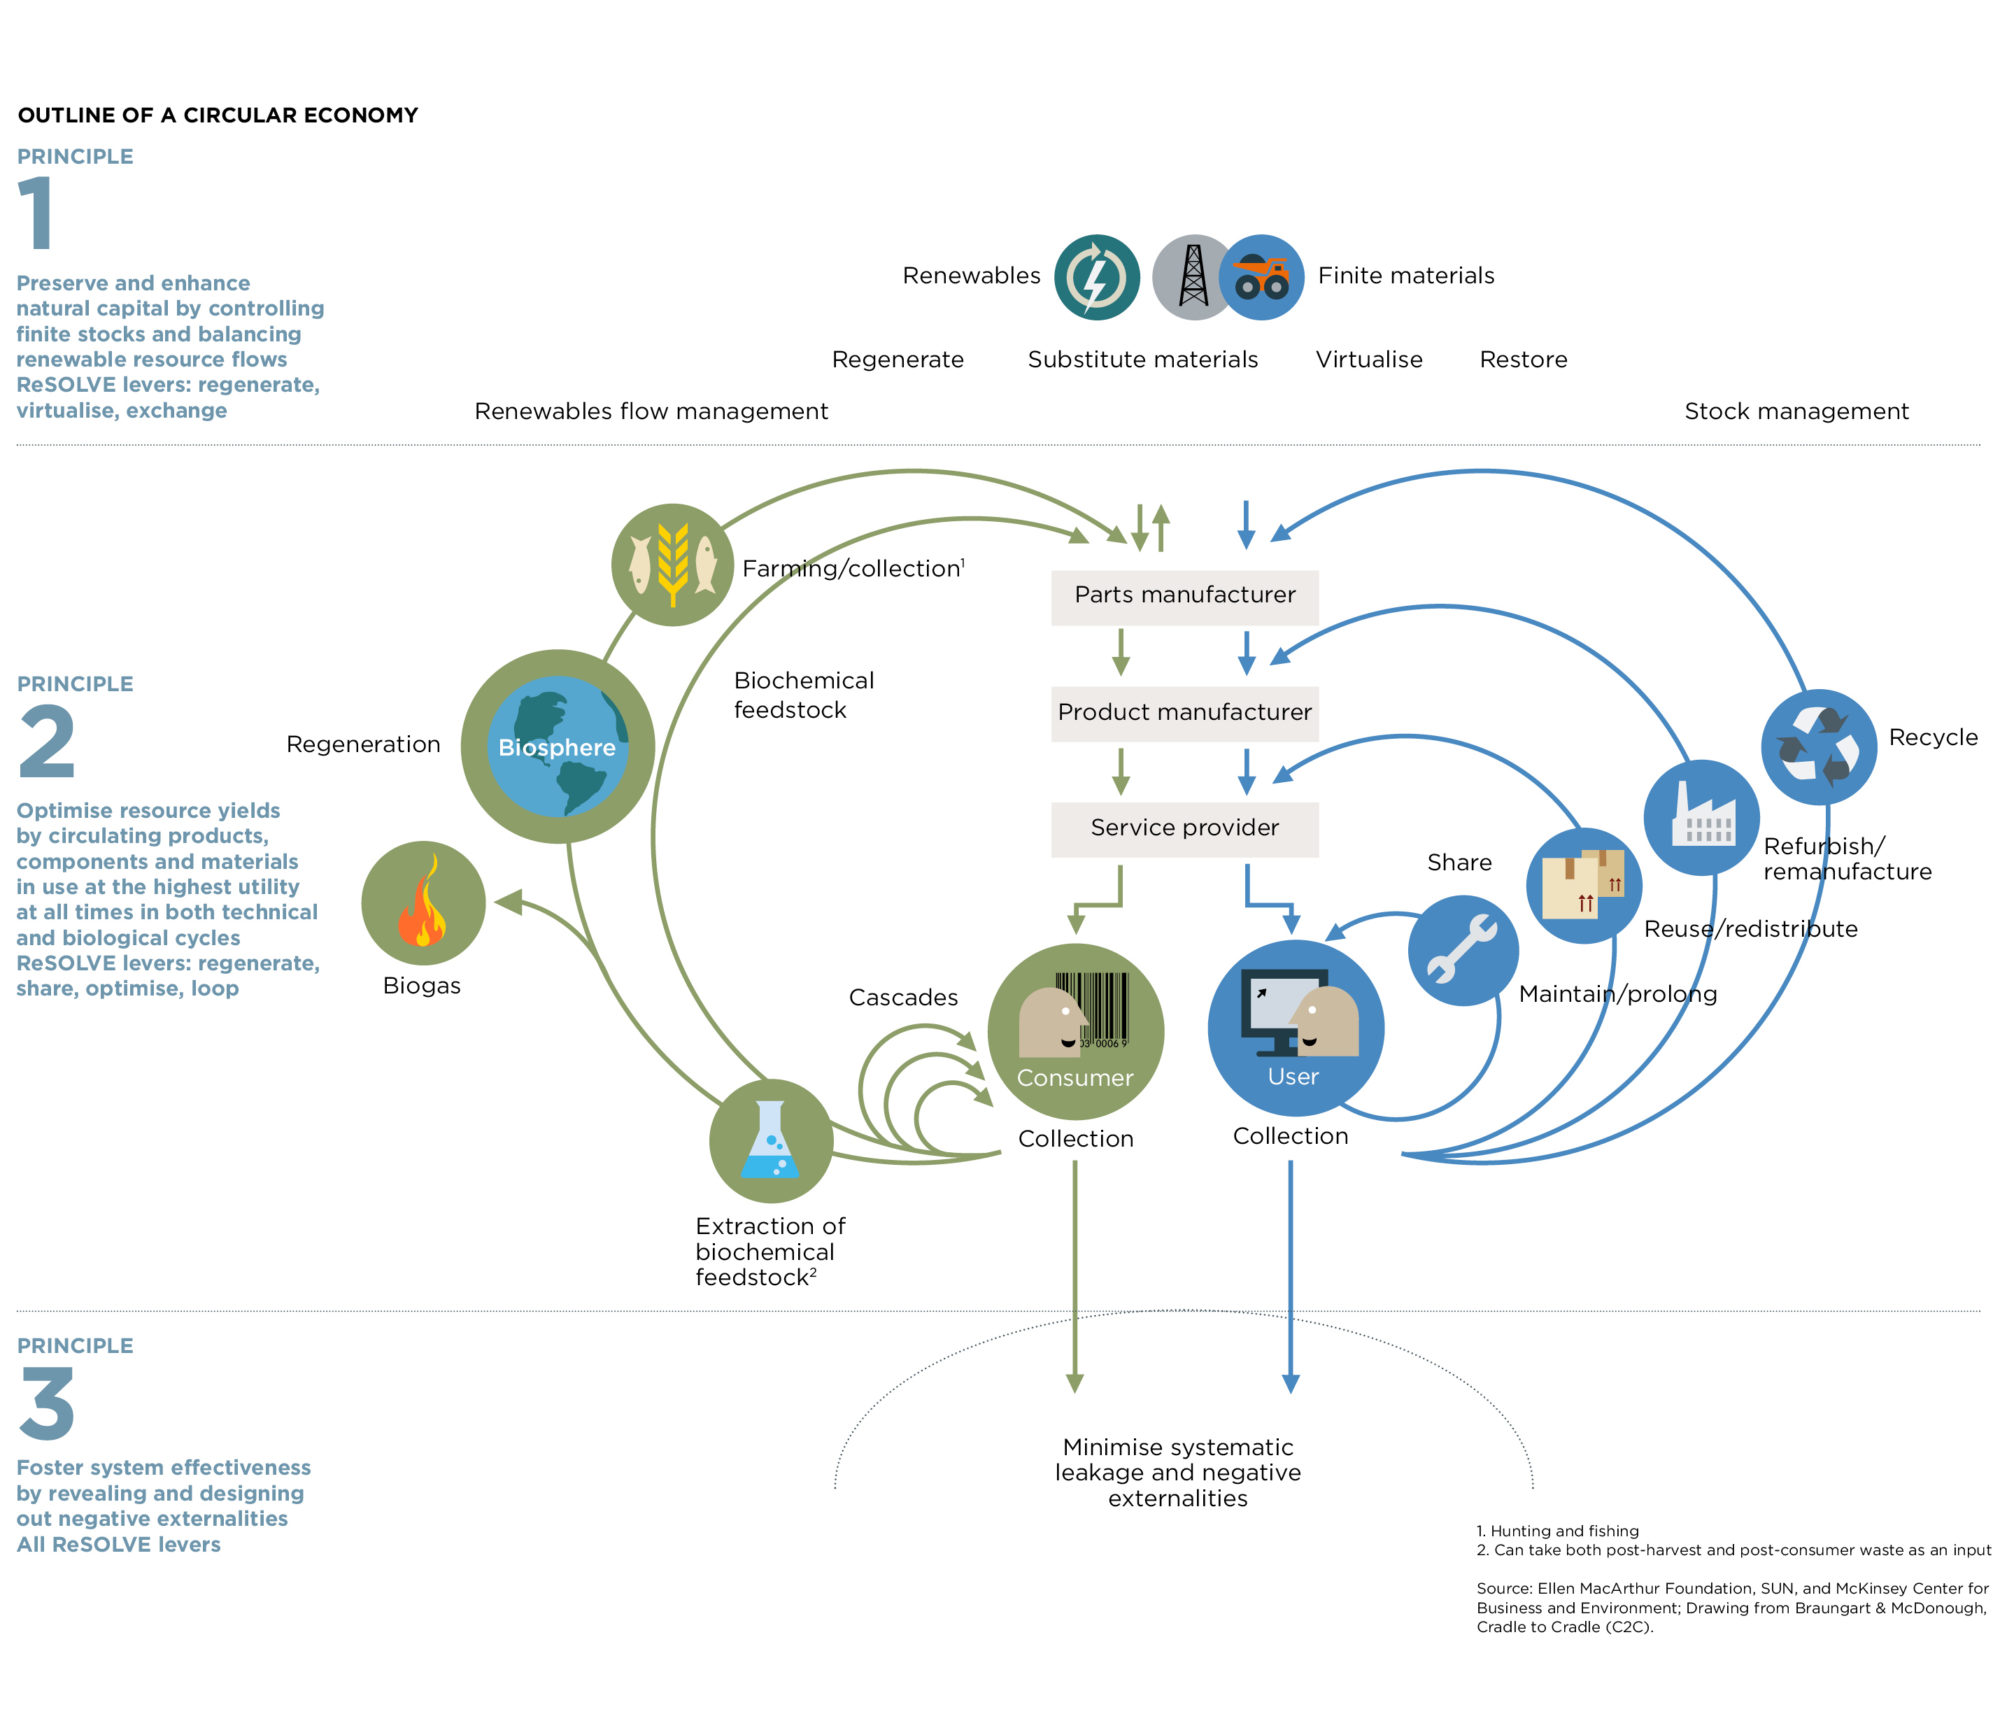
292. Butterfly (Ellen MacArthur Foundation) (OK, not strictly sustainability).
circular economy is regenerative and restorative by design
293. Spider diagram with explicit “transformation” dimension (Wilhelm and Wydler 2014). (After Wals and Corcoran Sustainability as an Outcome of Transformative Learning 2006).
In these spaces, three dimensions can be distinguished: a systemic, a normative and a procedural dimension (with the focus on the transformation of a system). These dimensions enable more technically-oriented sustainability assessment tools to be translated into socio-political decision-making processes.

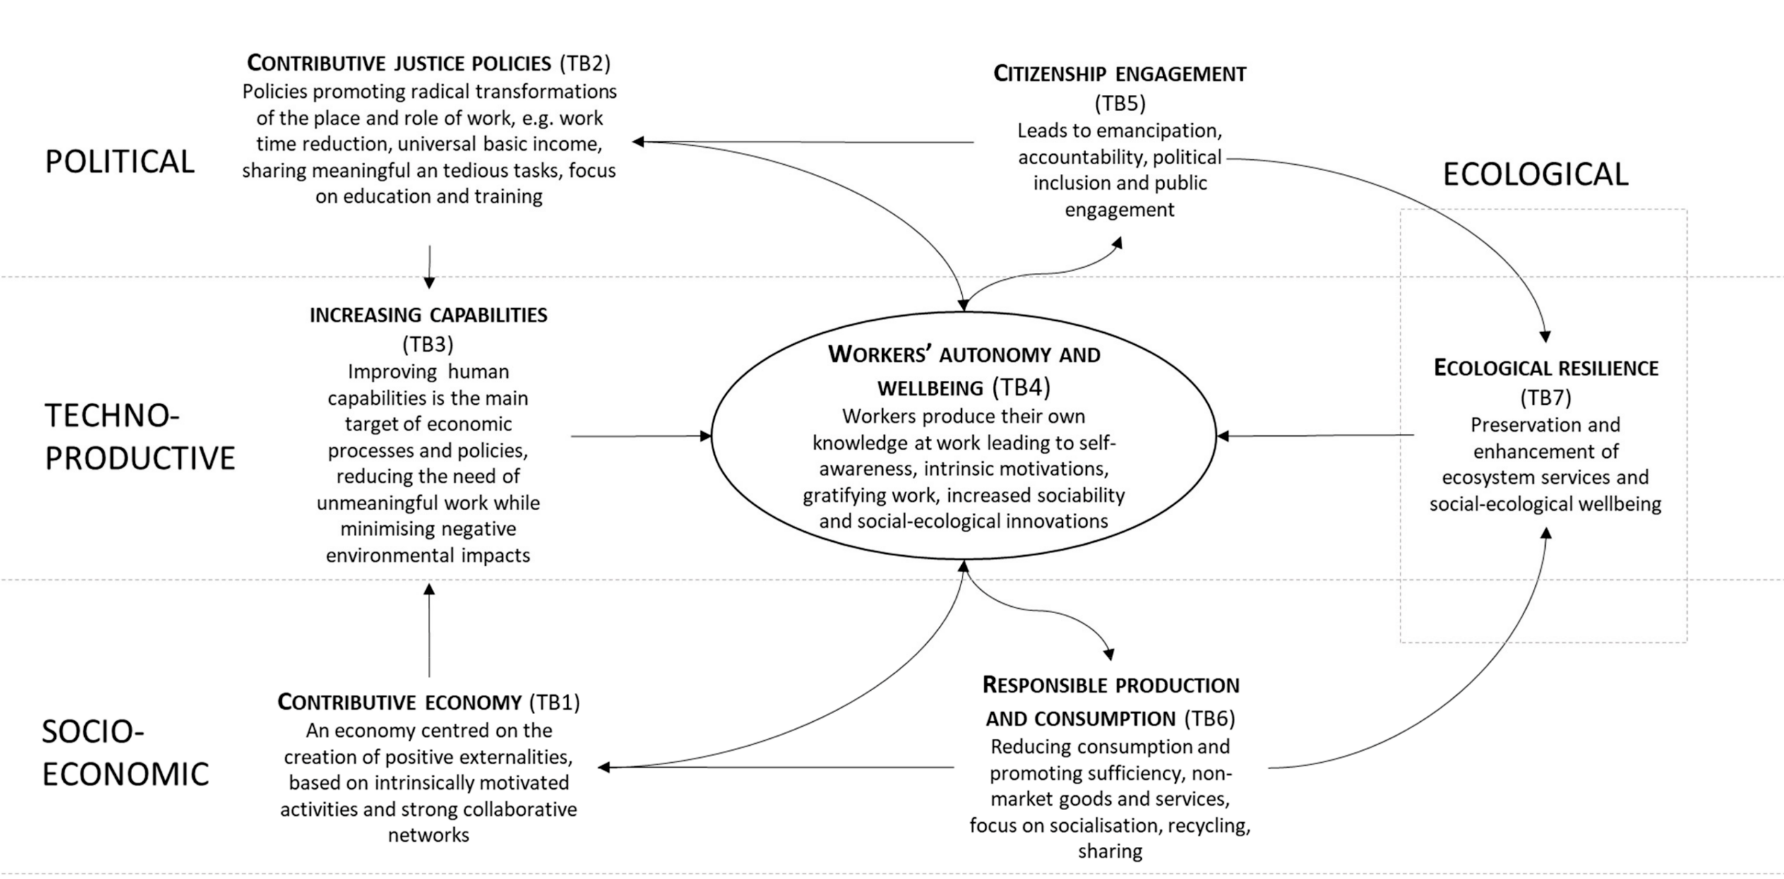
294. Social-ecological transition and work (Bottazzi 2019)
Idealistic view of a social-ecological transition to contributive economy and contributive justice policies. Contributive economy (TB1) is based on intrinsically motivated collaboration between multiple contributors to create positive externalities. Contributive justice policies (TB2) promote a transformation of the conception of work to be considered as a value in itself and not just a mean of production. Both TB1 and TB2 principally seek to generate human capabilities as a main outcomes of socio-economic processes (TB3), leading to an improvement of workers’ autonomy, sufficiency and wellbeing (TB4). As a result, workers are able to produce their own knowledge and become more self-aware as they have more time for reflexivity, are driven by intrinsic motivations and increase their sociability and their capacity to generate social-ecological innovation. Worker’s autonomy also positively influences citizenship engagement (TB5), leading to emancipation, accountability and public engagement, supporting in return contributive justice policies (TB2). Raising awareness for social-ecological issues allows for more responsible production and consumption (TB6), supporting in return the contributive economy (TB1). TB5 and TB6 are both direct drivers of ecological resilience (TB7) that in return influence peoples’ well-being.
295. Culture is taking over the petri dish. (Duxbury 2016)

296. Somebody ate a piece of the pie. (a brainstorm around sustainable textiles)

297. Rejection of Venn, then alternative…Venn. (Tyler Caine, Intercon 2014)
The three-circled diagram strikes me more as conciliatory to the boundaries of an existing system rather than aspirational towards the creation of a new one. After all, it was the old system that has got us to this point in the first place. The tenants of sustainability should migrate beyond the green circle to frame the entirety of the system. There are degrees of balance that can encompass each circle, all of the circles and all of the circles interactions with each other so that the growth of one does not have to come to at the cost of another.

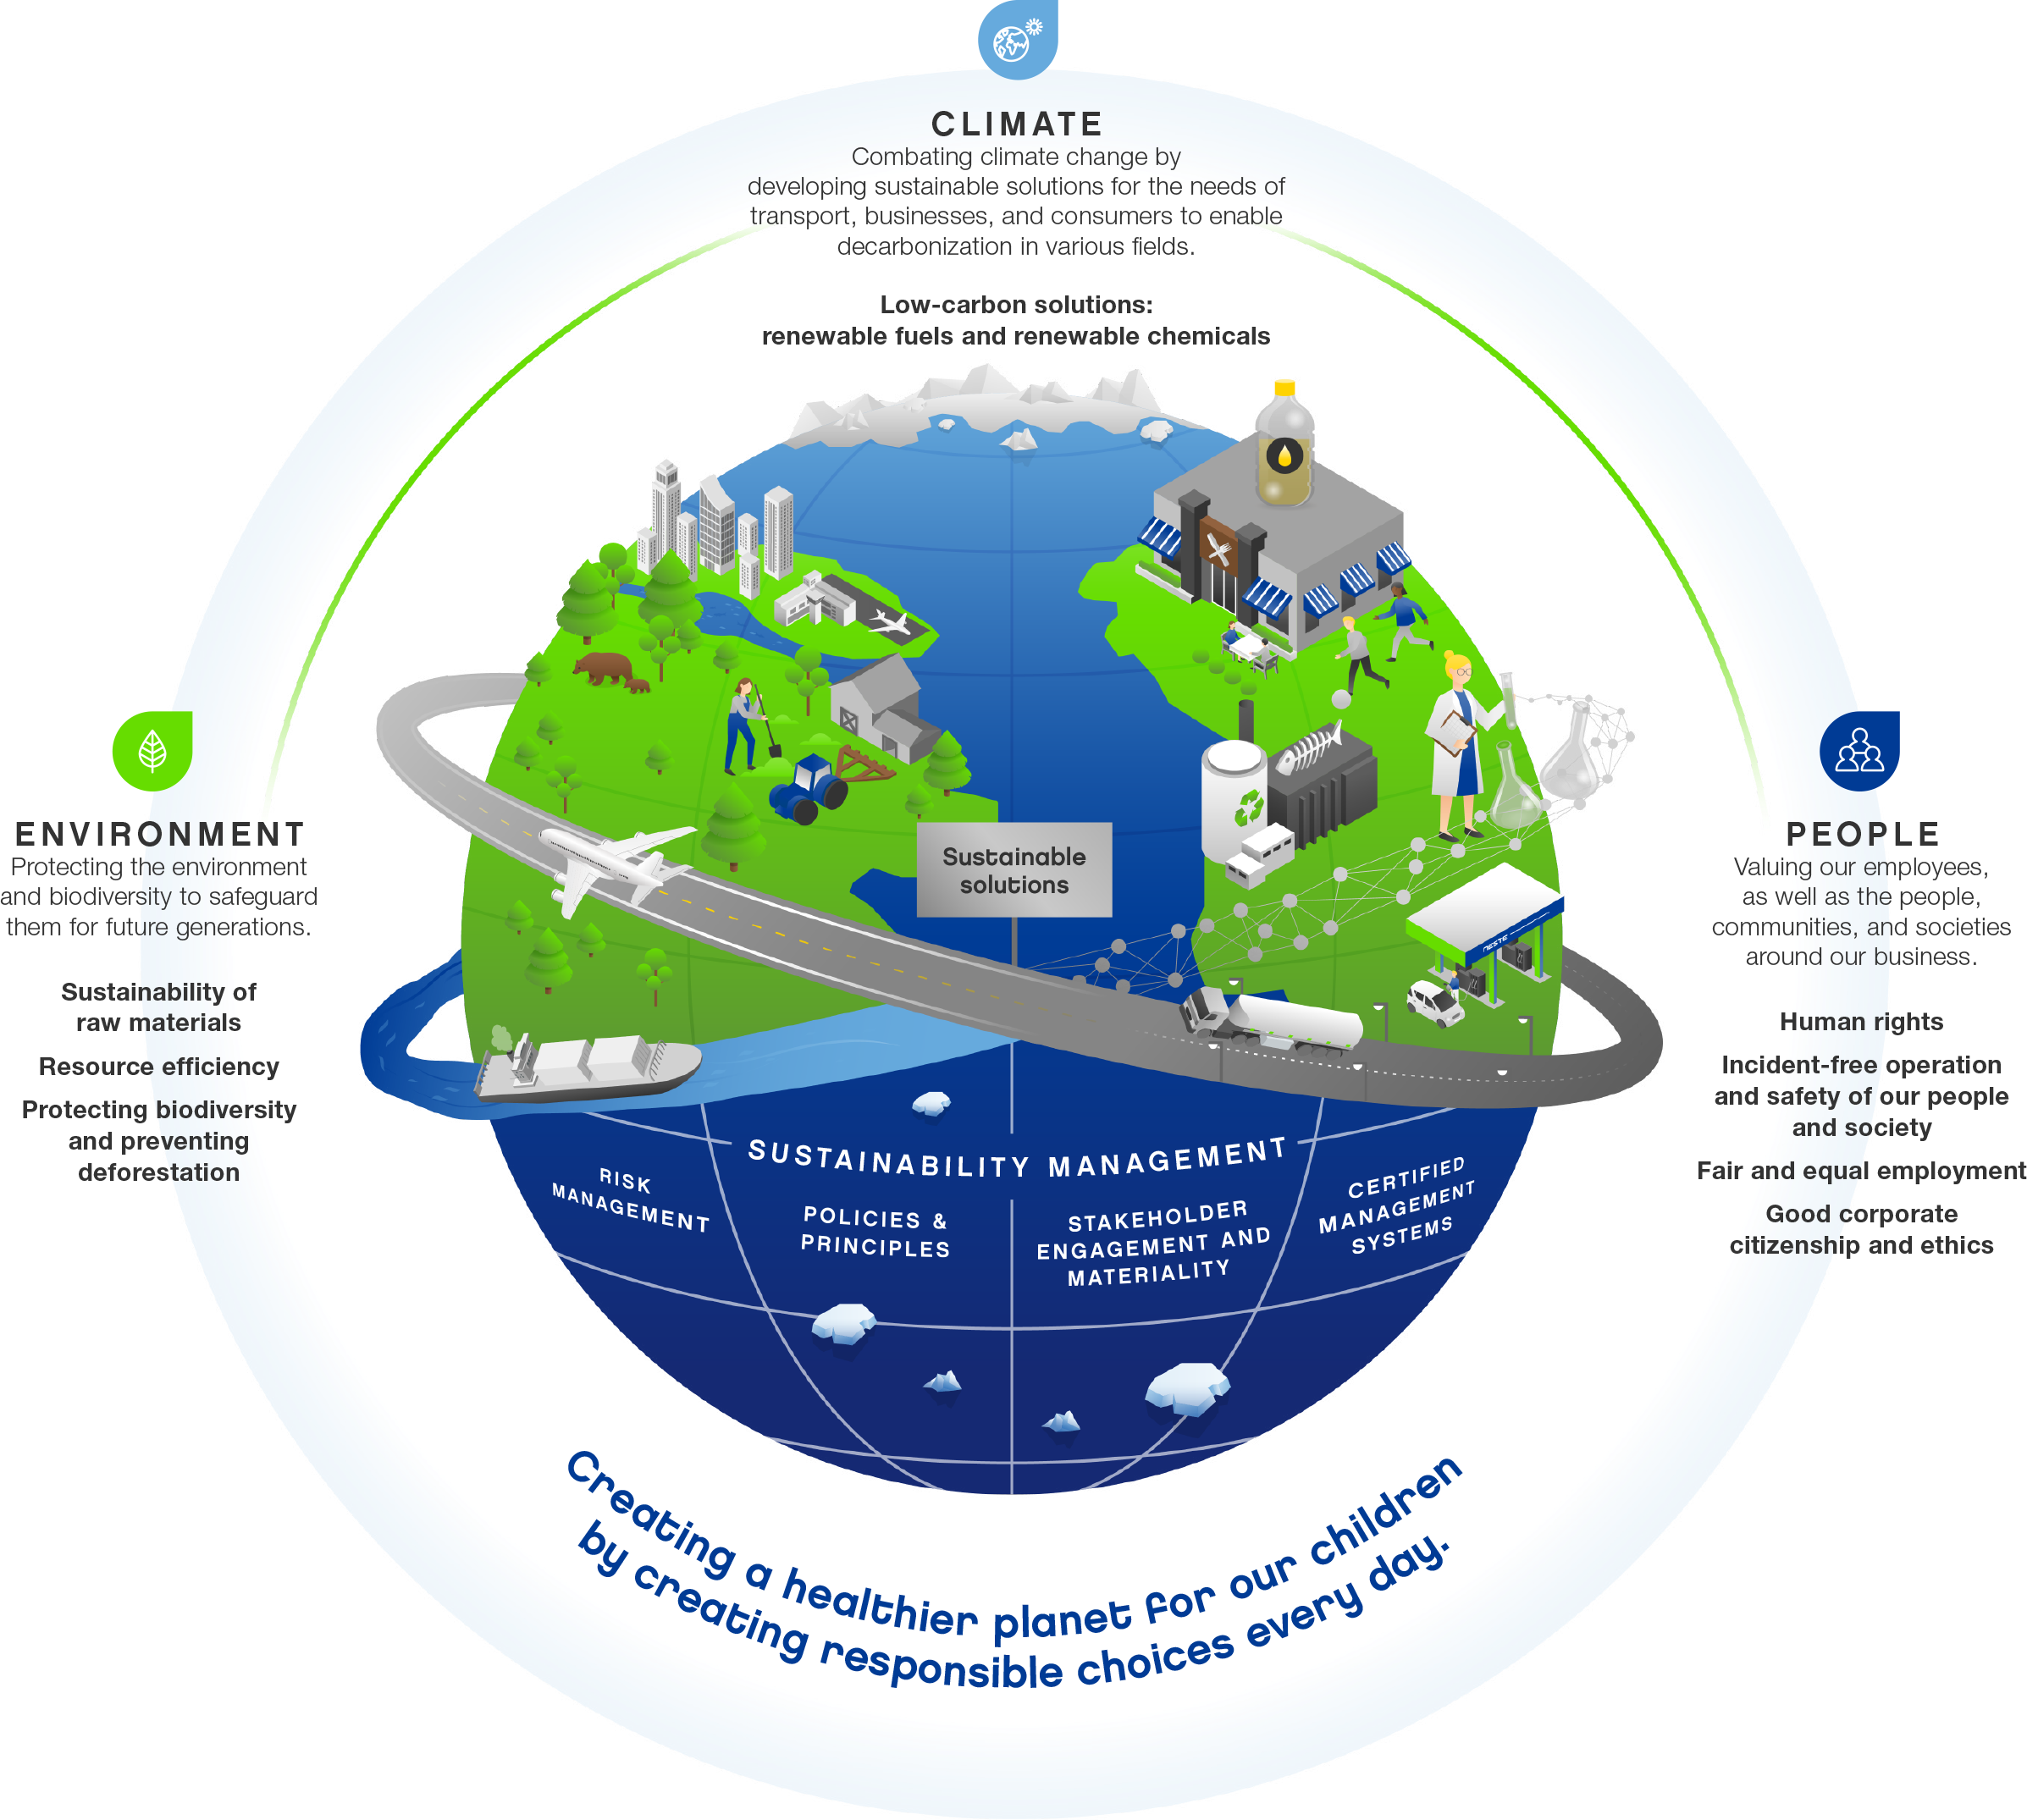
298. Neste’s “core of strategy“ (eg renewable jet fuel)
299. Flying boxes. Why? beats me. (SmileTemplates)

300. Kate Raworth’s Doughnut
Humanity’s central challenge in the 21st century is to meet the human rights of all people within the capacity of Earth’s life-support systems. In other words, we need to get into the doughnut: the safe and just sweet spot between social and planetary boundaries

301. Rodrigo’s rods and inner-tubes (https://doi.org/10.1016/j.jclepro.2008.02.008)
(existing models, Venn, Daly etc) However, they all suffer from being highly anthropocentric, compartmentalised, and lacking completeness and continuity. These drawbacks have reduced their acceptance and use by more advanced sustainability scholars, researchers and practitioners. This paper presents an innovative attempt to represent sustainability in three dimensions which show the complex and dynamic equilibria among economic, environmental and social aspects, and the short-, long- and longer-term perspectives.
302. Pillars with identity, quality and efficiency between (Kyelou and Ierapetritis 2019)

303. Living principles framework roadmap (AIGIA)
The Living Principles for Design framework is a catalyst for driving positive cultural change. It distills the four streams of sustainability—environment, people, economy and culture—into a roadmap for sustainable design that is understandable, integrated, and most importantly, actionable

304. Sustainable design ecosystem (AIGIA)

305. Anna Krachey’s Design thinking

306. We’ve had an impossible triangle before, but I couldn’t resist this architectural version.

307. Nature-based solutions (IUCN 2019)
Nature-based Solutions (NbS) are “actions to protect, sustainably manage and restore natural or modified ecosystems that address societal challenges effectively and adaptively, simultaneously providing human well-being and biodiversity benefits

308. SDGs and value creation (Integrated Reporting)

309. Venn in a triangle in a circle (The Centre for Liveable Cities Liveability Framework)

310. What’s social sustainability? I dunno either. (More than Green)

(part of animation that turns these triangles into buildings and map squares).

311. SDGs as a…
(there a lot of variations. Other than this bike, I’m including the coloured blocks or wheel of the SDGs only if it adds substance to the diagram or model).

This for example, would not make it onto the post (except as a counter example, obviously)

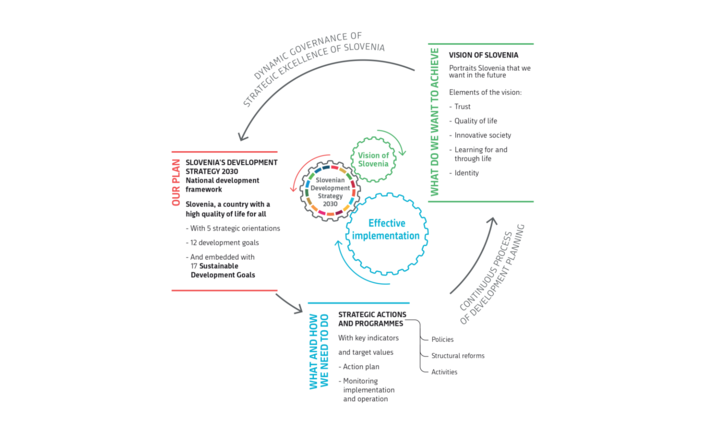
Although it is useful as a visual shorthand for sustainability: (Slovenian Development Strategy)
312. Whereas this use of the SDGs adds value by showing that sustainability is an holistic and a transformation (J. Lokrantz/Azote, Stockholm Resilience)

313. SDG Wedding Cake: mapping of SDGs to Strong Sustainability model (Rockström, see also Teebweb)

314. Systematic inclusive approach and equilibrium of strategic orientations (Slovenian Development Strategy)

315. Cultural Materialism: Triangle with different take on pillars (Lyngaas 2016)

316. Hero’s journey (Shari Welsh) (after Joesph Campbell’s Monomyth).

317. Structural sustainability principles as a bubbly Venn diagram (Bofylatos and Spyrou 2016)
A framework to deconstruct and frame the cognitive space associated with sustainability has been proposed in Bofylatos et al 2012. This framework was based around the notion of “structural principles of sustainability”, the six principles selected after a long bibliographical review attempted to frame the cognitive space in which sustainability will emerge. Those are: holistic, local, safe, cyclic, socially acceptable, and rational in the use of energy and materials (Bofylatos 2013) through this process we were able to visualize sustainability as the point of intersection of a Venn diagram with six objects (the principles identified). This frames the problem space in which we speculate sustainability will emerge

318. PRiSM Principles (Green Project Management)

319. Forms of Sustainable Value Creation Patterns (Carroux 2017 and Lüdeke-Freund 2108)
“A sustainable business model pattern describes an ecological, social, and/or economic problem that arises when an organisation aims to create value, and it describes the core of a solution to this problem that can be repeatedly applied in a multitude of ways, situations, contexts, and domains. An SBM pattern also describes the design principles, value-creating activities, and their arrangements that are required to provide a useful problem-solution combination.”
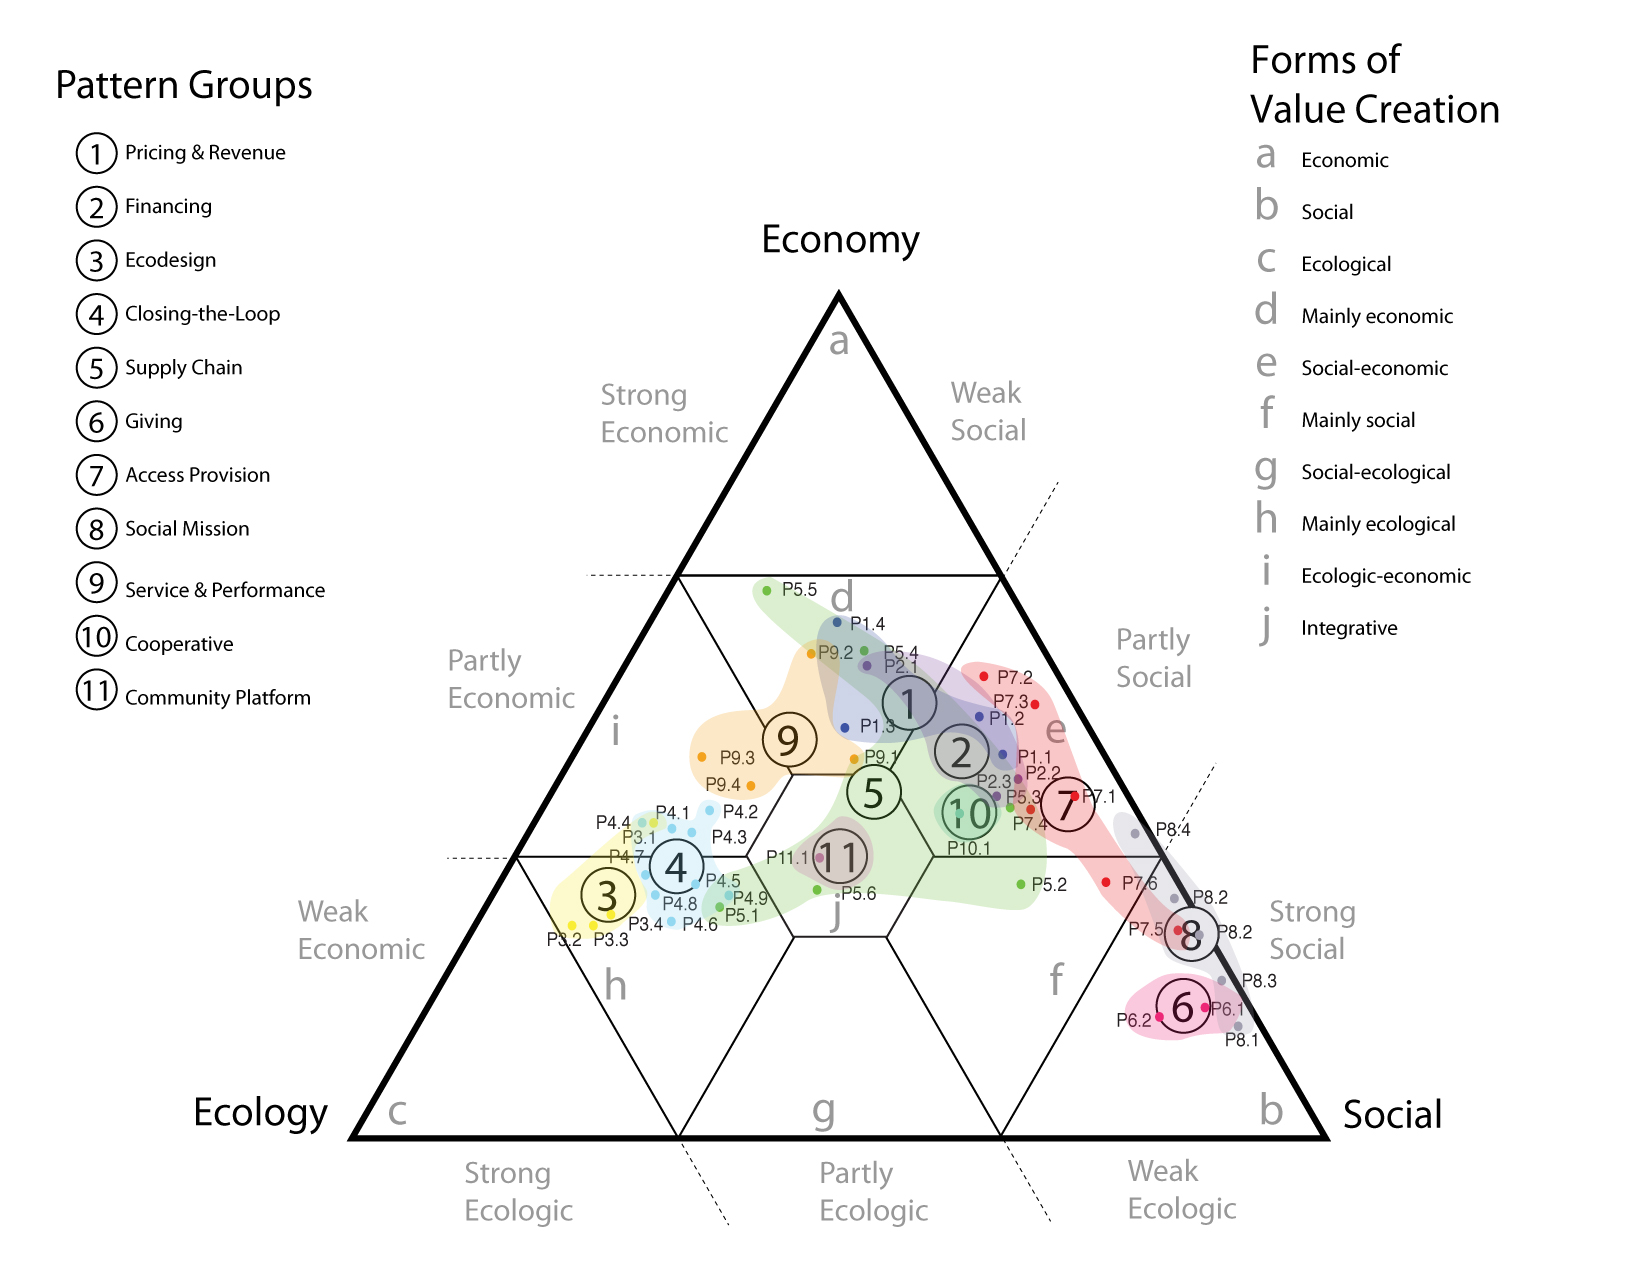
(like a soil texture triangle, this representation assumes a 100% sum – where increase in one aspect must have a decrease the other two).
320. I had to include this because it is so bad. Not only is it a Venn diagram, but in trying to pimp it up for display, they’ve broken it even more – sustainability is at the intersection of all three pillars, not just economic growth as this image points to (Slidegeeks)

321. Dimensions in SDGs – and a hint of origami (European Commission)

322. Hugs. Inequality as link between society and biosphere. (Hamman via Tilman)
We employed a social-ecological systems framework and identified pathways that link inequality and the biosphere. Our review finds that most research has focused only on one-directional linkages between inequality and the biosphere. We highlight examples where bi-directional and cross-scale linkages are present. Such systems call for approaches that consider the complex feedbacks and dynamics of inequality that are present at the nexus of society and the biosphere.

323. Capital interactions (Hill 2015)

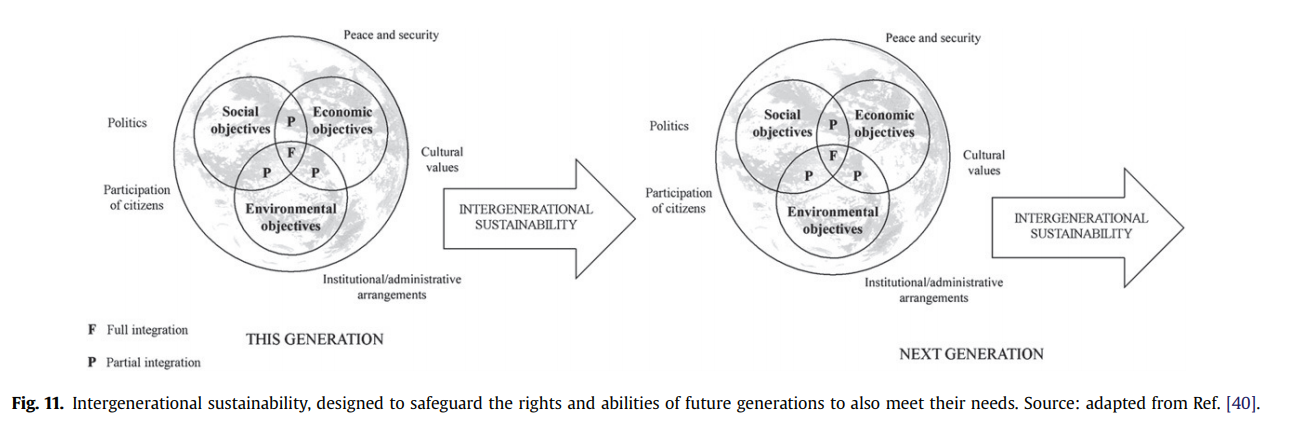
324. Intergenerational sustainability. Lozano introduces time by repeating a Venn diagram.
The figure depicts the integration of the economic, environmental and social aspects, and how these keep the same weight in respect to each other from one generation to the next. Abstractly, the picture shows the stable and non-diminishing use of resources (economic, human and natural).
325. Time tube. Lozano (2008) considers a Strong Sustainability model as 1st Tier Sustainability Equilibrium (flow around a circle), which can then be stretched over time. Where the tube and the time-line diverge and the shape forms a cone is a “disequilibrium in the time dimension. Lack of long-term perspective”.

326. One Ring to rule then all. Lozano (2008)
The final step involves the interactions of both equilibria into a Two Tiered Sustainability Equilibria (TTSE). This is achieved by inter-relating the First tier sustainability equilbiria (FTSE) in dynamic change processes through time, passing from the inter-generational to the holistic perspective. In this case the FTSE may not be the same today and in the future. In the TTSE all aspects including the time perspective interrelate, or example the economic aspects of today with the economic aspects of the future, but also with the environmental aspects of the present and the future, as well as with the social aspects of the present and the future. These interactions occur with all the other aspects of the present and the long-term, which make the cylinder
suffer a metamorphosis into a doughnut shape by imploding in the direction of the time axis (Fig. 15), for this to occur time needs to bend. In the TTSE sustainability issues lie inside the doughnut and are in perennial movement inter-relating with other issues, continuously rotating in the two axes shown in the figure.

327. 23 Honey bee practices (Avery and Bergensteiner 2007)
328. Regenerative system sketch (from Mang and Haggard 2106).

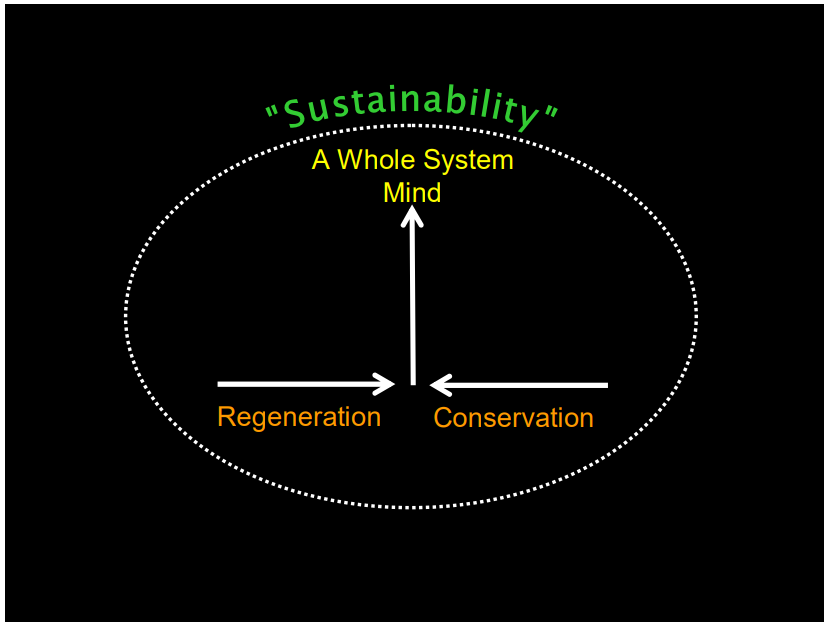
329. System of mind (Bill Reed 2007)
We have the opportunity and imperative to evolve our thinking and practice in a way that can contribute to regenerating our planet. Slowing down the processes of degradation, while essential, is insufficient; regenerating the evolving resiliency and matrix of life in each place is the other half of achieving a sustainable condition – in fact it’s the easier and less expensive half if we only shift the purpose of design and the process of thinking this way. This nature of work will require us to think more and more like living systems and embrace a whole systems mind and design process in order to wholly participate in the system of life. The role of architecture and development will be dramatically enriched and positive – plus it’s just plain, powerfully, good fun.
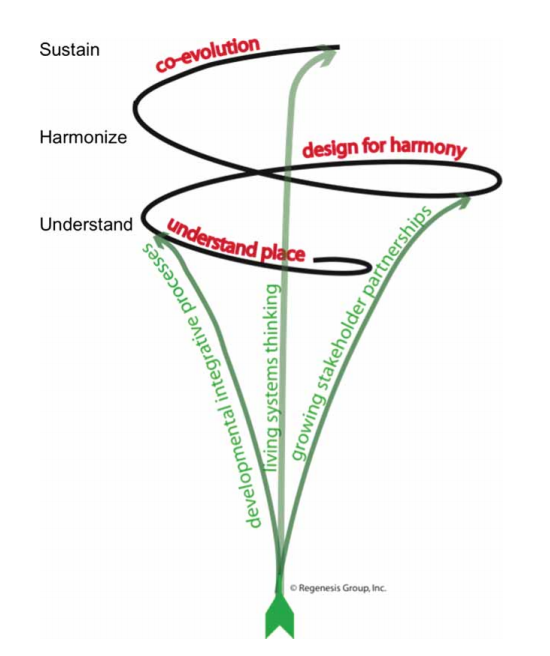
330. Phases and process of regeneration (Mang and Reed 2012)
Figure 4 depicts the three phases – Understanding/Conceptualizing Right Relationship to Place, Designing for Harmony, and Co-evolution – that emerged as essential to this methodology, and the three developmental processes – Growing Stakeholder Partnerships, Living Systems Thinking, and Integrative Developmental Processes – that are key to creating and sustaining the holism required to make this an evolutionary spiral, growing systemic capacity as it actualizes a project
331. Levels of ecological strategies (Mang and Reed 2012)
A number of ecological strategies for sustainability were developed during the 1980s and 1990s that were organized around the core set of philosophical, theoretical and scientific concepts that underlie the ecological perspective of reality. All were aligned around a commitment to net positive goals for the built environment, and to integrating human structures, processes and infrastructures with natural living systems to that end. They differed in the systemic scope they encompassed, falling into four broad categories along a spectrum of comprehensiveness.

332. Essential Living Processes framework (Mang and Reed 2012)
This framework was developed by Regenesis for setting overarching project aims to guide the design and construction process. It is based on the six critical processes that enable living systems to support the evolution of life. They include the ability to provide the material structuring that forms the basis for life processes— nourishment, shelter (habitat), and the generation and exchange of resources for growing and evolving more life. Because humans cannot be separated out from any living system, the factors go beyond the material factors—the outer landscape of a place. They also include the “inner landscape” that sources our spirit and will and drives us to cherish and protect the places we inhabit. They include the ability of a living system to create a sense of identity and foster belonging through its culture, to support meaningful and contributory lives, and to invoke the spirit and inspiration that sustains caring. The framework enables setting aims and goals (and later developing indicators and measuring systems) for how the processes generated by the project support ecological, economic and social health in each of the six areas. The interrelationship of these processes and how they cross ecological, societal, and economic arenas is graphically represented

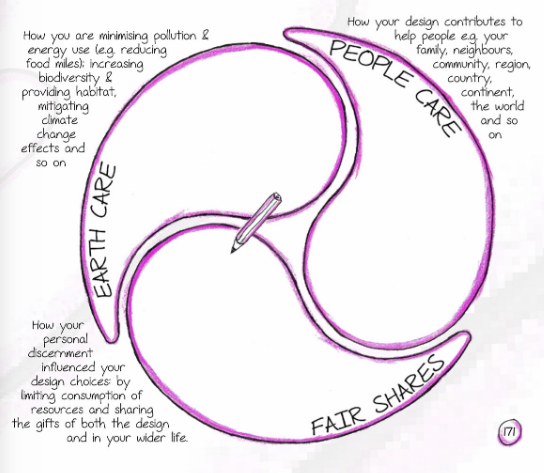
333. Permaculture ethics (Jasmine Dale Permaculture Design Companion)
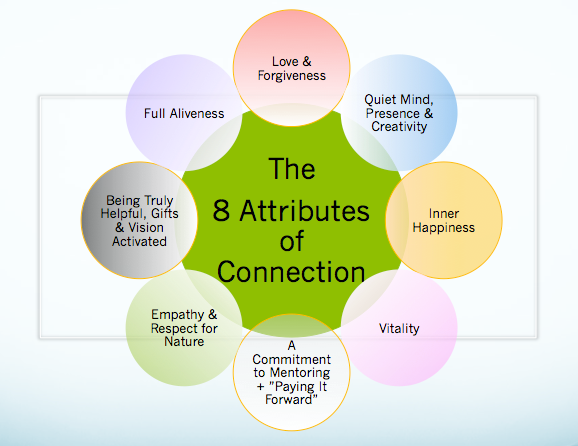
334. 8 shields mentoring
Patterns of historic trauma around the world have contributed to a massive loss of culture and a loss of the legacies of ancient wisdom traditions that support future generations living in harmony with each other and the natural world. The collective grief from this widespread loss has resulted in a mass amnesia, and the breakdown of intergenerational mentoring communities.
Join a global movement of support in the best practices of cultural mentoring, nature based mentoring, designing for peace, healing grief, and community building.
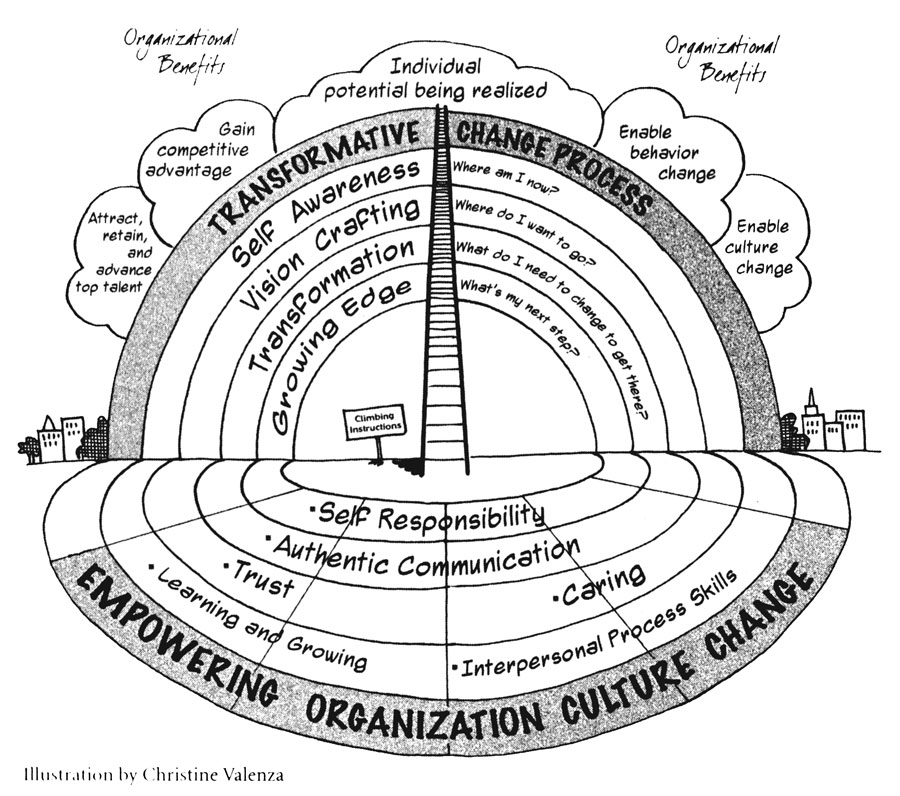
335. Transformation through social connection (David Gershon. Empowerment Institute, Christine Valenza)
335. Colourful permaculture. (various, can’t find original).

337. Another permaculture (I’ll stop now), I’m particularly interested in how this one represents economy as a cyclic flow (google image, not linked and no hits from tineye).

338. Te Whare Tapa Wha (Mason Durie)
Māori health expert Mason Durie developed the whare tapa whā model of health in 1982. Encapsulating a Māori view of health and wellness, it has four dimensions: taha wairua (spiritual health), taha hinengaro (mental health), taha tinana (physical health) and taha whānau (family health). Different parts of a wharenui (meeting house) represent each dimension.
339. Vision 2050 (WBCSD 2012) Road Map
Note the “road” into time (the y-axis) uses a personal aging metaphor “turbulent teens” with action rows described accordingly.
The pathway and its elements neither prescribe nor predict, but are plausible stories the companies have created by “backcasting”, working back from the vision for 2050 and identifying the changes needed to reach it.
We see two timeframes: the Turbulent Teens, from 2010 to 2020, and Transformation Time, from 2020 to 2050. The Turbulent Teens is a period of energy and dynamism for the global vision of sustainability. It is a formative decade for the ideas and relationships that will take place in the 30 years to follow.
From 2020 to 2050, the traits formed during the first decade mature into more consistent knowledge, behavior and solutions. It is a period of growing consensus as well as wrenching change in many parts of society – climate, economic power, population – and a time for fundamental change in markets that redefines values, profits and success.

340. Vision 2050 roadmap mural (Bob Horn)

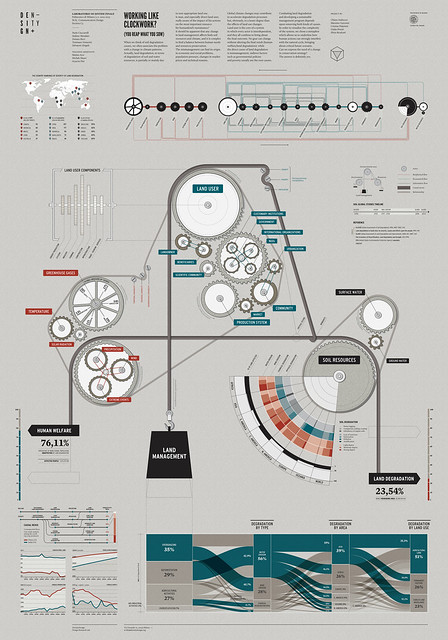
341. System diagram as a machine (Density Design Working like clockwork) (see also biodiversity as Sankey).
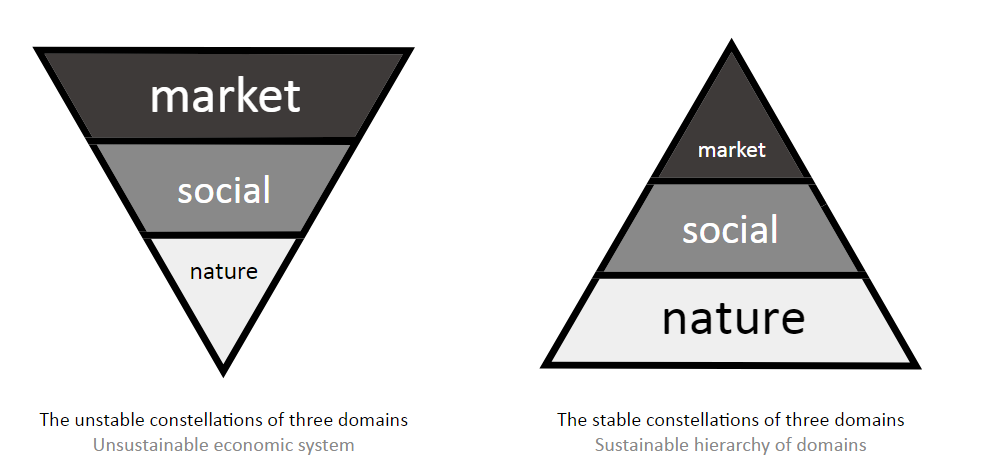
342. Unstable unsustainable constellations of the Three Domains (Joanna Broehnert 2018 after Vandana Shiva).
343. Four becomes three – four pillars including function of society gets reduced to people, environment and business when measured (Empower).

344. Modern Day Slavery (Global Sustainability Network)

345. Scottish National Performance Framework (image with measures)
It is 10 years since the Scottish Government launched our world-leading National
Performance Framework. It sets out a vision of national wellbeing for Scotland and charts progress towards this through a range of social, environmental and economic indicators. The Framework changed how we do government in Scotland. The focus shifted to improving outcomes and how our actions will improve the quality of life for the people of Scotland. This approach to government in Scotland has now been given a statutory basis in the Community Empowerment (Scotland) Act 2015.

346. Keyword network (Alto Data Analytics, original).
Alto Data Analytics collected 72 million data points from 3.2 million comments and 1.7 million interactions created by 1.3 million authors across Twitter, Instagram, Facebook, Reddit, forums, blogs, news and other digital sources in English and Spanish.
The interconnection of the key themes revealed adjacent narratives such as gender, hunger, sustainable cities, the circular economy and how blockchain technology is impacting the environment. The data visualisation shows zero waste is closely connected with the discussion around sustainable cities, the circular economy, sustainable investing and how blockchain is related to renewable energies in the context of technological impact.


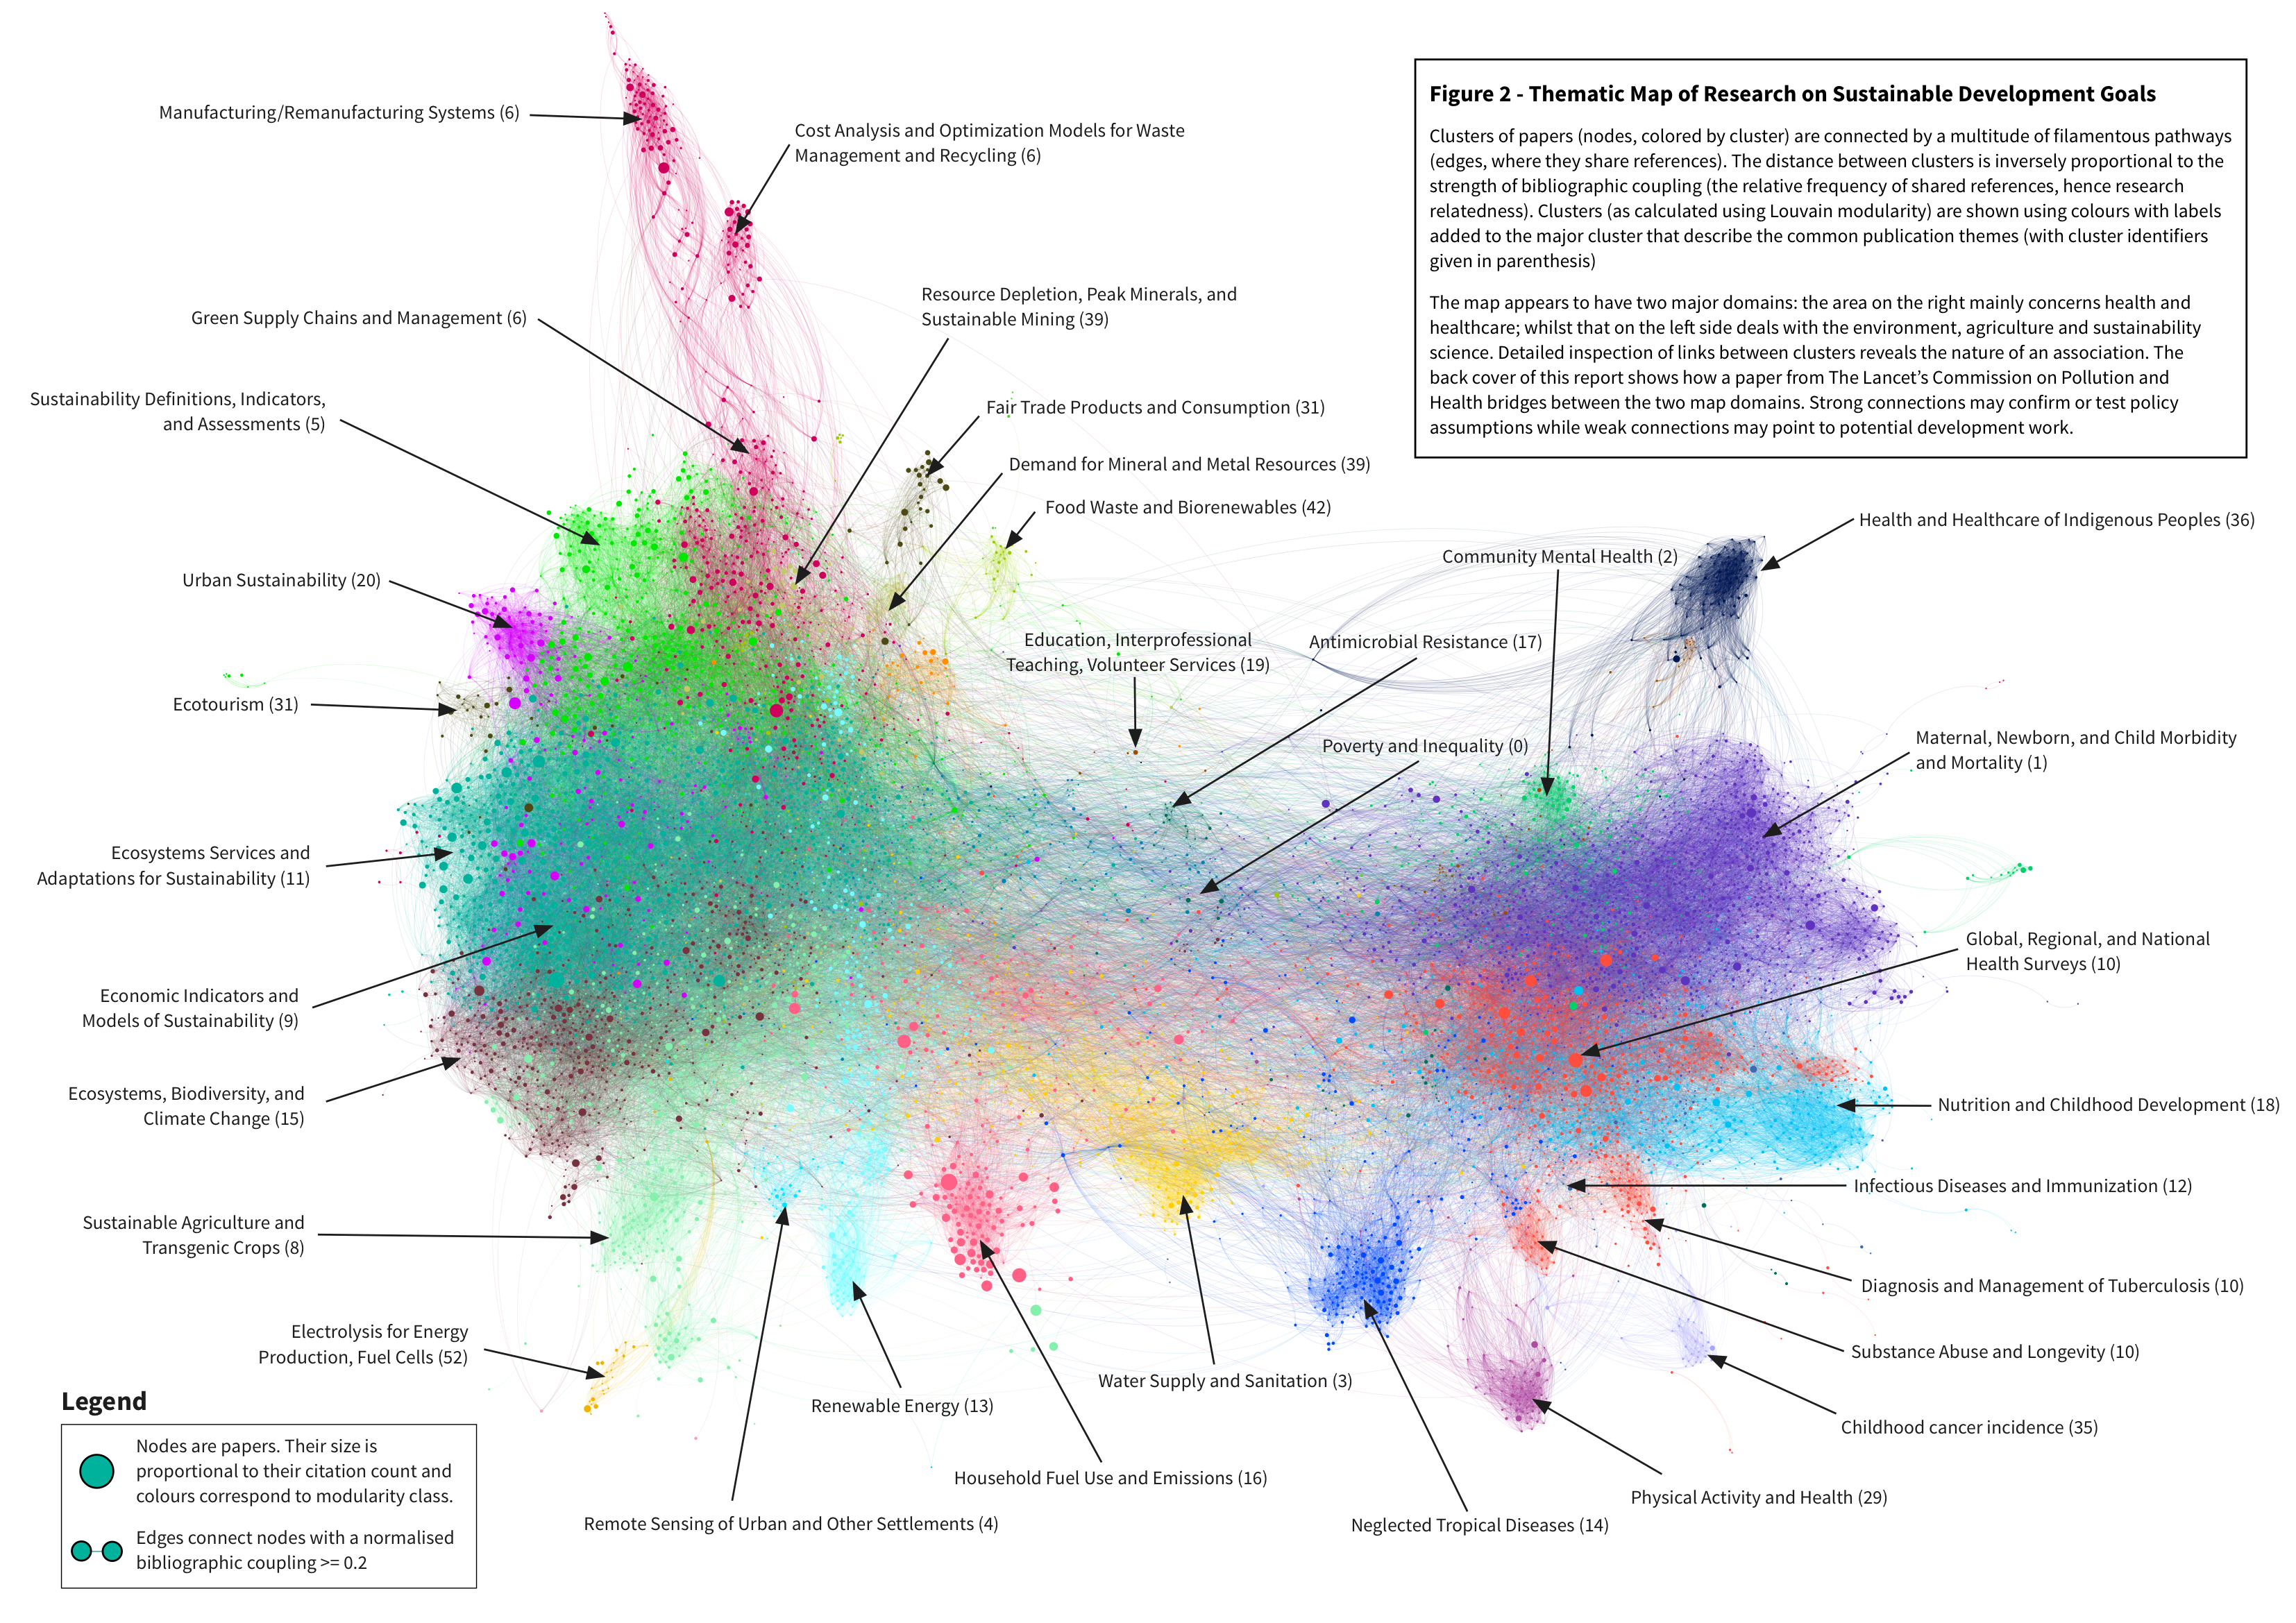
347. Navigating the Structure of Research on Sustainable Development Goals (Martin Szomszor)
…shows that there is a dual focus across the research landscape. The majority of papers are published in Environment, Agricultural and Sustainability Science (on the left hand side) or Health and Healthcare (on the right hand side).
However, transdisciplinary research is an important theme of our report. You can see many small research areas, such as Water Supply and Sanitation, Poverty and Inequality or Education, Interprofessional Teaching and Volunteer Services, joining the two large domains in the centre of the map. The most diverse clusters in terms of interdisciplinary content are Sustainable Agriculture and Transgenic Crops, Physical Activity and Health, and Ecotourism and Fair Trade.
These transdisciplinary topics are often of policy interest because they represent opportunities to use knowledge from one area and apply it in another
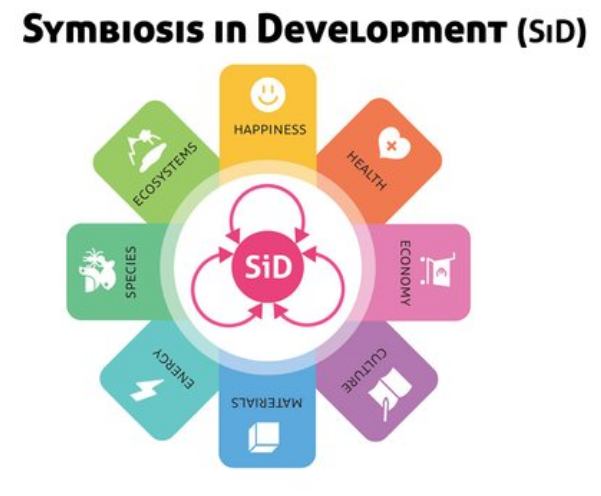
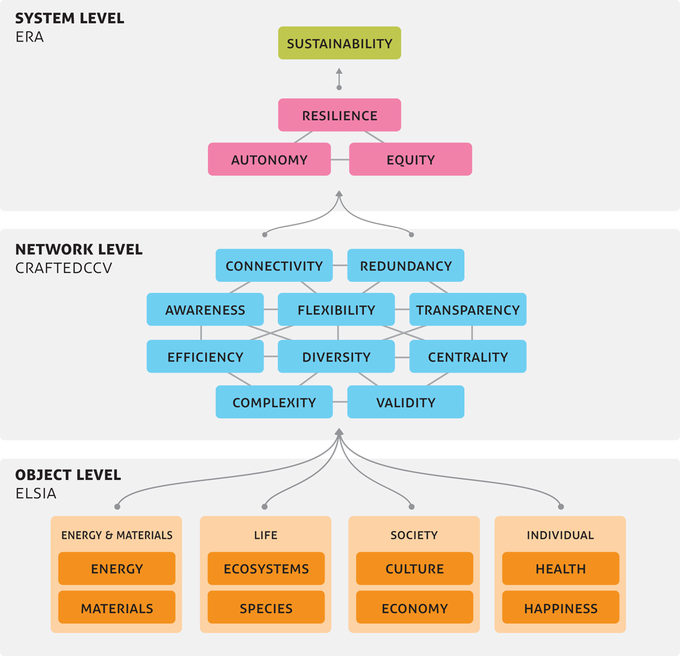
348. Symbiosis in Development – recognizes the need to investigate systems in context, time and space simultaneously. (Tom Bosschaert, Except Integrated Sustainability)


349. Symbiosis in Development (Tom Bosschaert, Except Integrated Sustainability)
“Sustainability is a state of a complex, dynamic system. In this state a system can continue to flourish without leading to its internal collapse or requiring inputs from outside its defined system boundaries.
Applied to our civilization, this state is consistent with an equitable and healthy society, as well as thriving ecosystems and a beautiful planet.”
350. And because I had the Scottish version, here’s the Well-being of Future Generations (Wales) Act

351. Ear ye Ear ye. Not sure what this is about (Ardea used it, citing Getty Images).

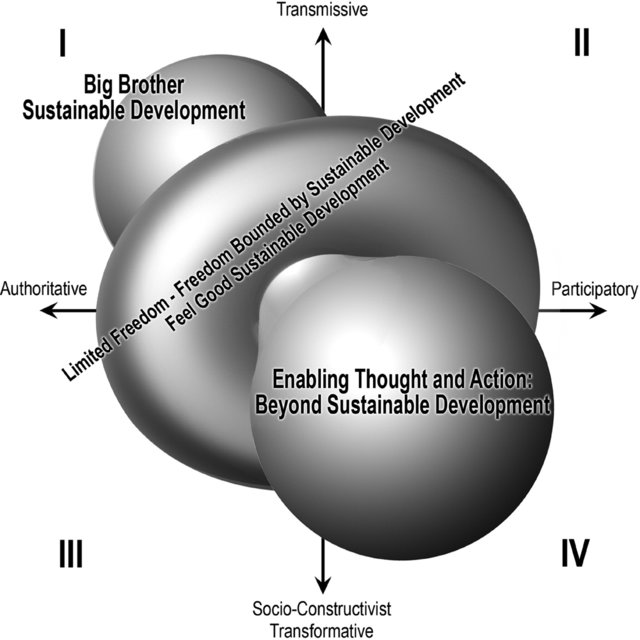
352. Positioning sustainable development in education within two force fields (Jickling and Wals 2008)
353. Sustainable development actors from Philippine Agenda 21 (note, no actor for environment, several links to PEDA but website gone link)

354. Sustainable pathways (between SDGs and Planetary Boundaries) (WBGU, this version Nakicenovic)

This version has the grey “overarching narrative” and makes “targets” explicit.

355. Clustered SDGs on The world in 2050 (TWI2050) framework (via IIASA)
The World in 2050 [TWI2050] framework for Sustainable Development Pathways (SDP) of attaining the SDGs within Planetary Boundaries by 2050. The SDGs are universal, holistic and inter-dependent, thereby indivisible. The indicative clustering of the SDGs proposed here, has the sole purpose of emphasizing the inter-dependence between human wellbeing, world development and Earth system stability.

356. Harnessing digital finance for sustainable development (UN Environment). So wait, the financial sector isn’t connected to the real economy? And how does it impact sustainable development?

357. Force-field analysis (applied to land reclamations)

358. Sustainable Community Based Resource Management (Kyushu University).

359. Sustainability Forces Wheel (Winston 2010)
The way I picture using this framework is to “spin” the wheels and match up the forces. In this way, executives can think through what the combinations mean for an industry or company.
Along the outside run the big sustainability challenges we face as a species — these are the issues that society increasingly expects business to deal with and help find solutions for.
These issues affect companies directly of course, but importantly they also pass through a prism of magnifiers.
In the third wheel I’ve placed key stakeholders that pose questions about a company’s social and environmental performance.

360. Integrating hybridity and business model theory in sustainable entrepreneurship (Davies and Chambers 2108)

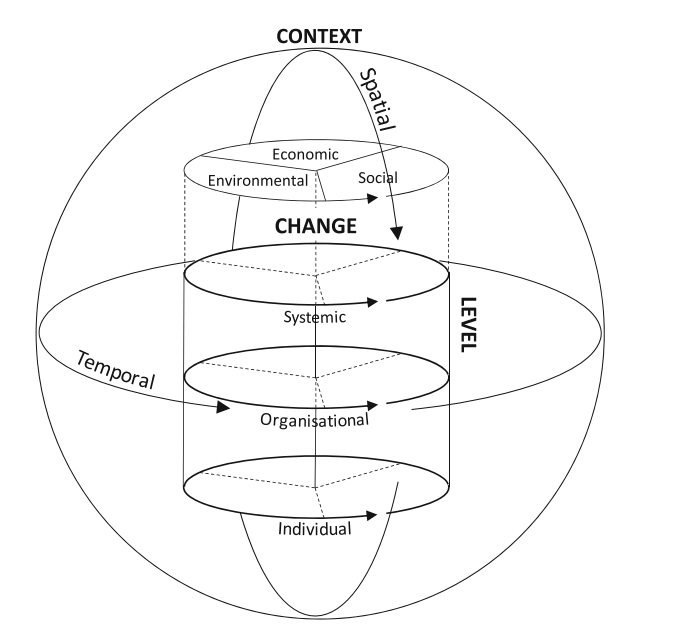
361. Tensions in Corporate Sustainability: Towards an Integrative Framework (Hahn et al. 2015)
While the three sustainability dimensions form the backbone of our framework and cut across all other dimensions of our framework (see Fig. 2), we argue that a full understanding of tensions in corporate sustainability requires a more fine-grained analysis that further extends and specifies the economic–environmental–social triad.
To capture the sources and characteristics of tensions in corporate sustainability, we distinguish three additional dimensions—(1) level, (2) change, and (3) context—that further specify tensions between economic, environmental and social aspects. Combining these three dimensions with the economic–environmental–social triad results in our analytical framework
362. Distributive justice as basis for intergenerational sustainability (Vasconcellos Oliveira 2018)
Each of the targets was benchmarked against the principles of equalitarianism, prioritarianism, and sufficientarianism. The results are grouped by goal (showing) predominance of egalitarianism (egalitarianism is the distributive justice
theory that states that societal burdens and benefits (e.g., wealth, income) should be divided equally among all citizens. This falls on the postulate that all human beings are equal in worth and in moral status. When egalitarianism is applied to future generations, the result is the obligation of distributing equally the burdens and benefits among present and future people [35]) in subjects like peace, justice and institutions (Goal 16), and in quality and education (Goal 4).

363. Three prongs (but not your usual pillars, instead it’s the interaction of potentials) (Yuliya Rashitovna Gainullina)
In our opinion, it should be understood that the functioning and development of the economic system is only the consequence of the functioning and development of human potential. The functioning of the ecological and economic system, in our opinion, shall be interpreted as the consequence of the efficient investment activity and use of investment resources. The functioning of the ecological and social system is a derivative of the living standard of human and society, processes of creation and development of all types of novelties and innovations.
Studying the three-pronged concept of the sustainable economic development, its derivative can be formulated and at the same time the sustainable development, according to Figure 4, will be understood as a balanced interaction of the human potential, innovation and investment systems of the functioning of the economy of the country.

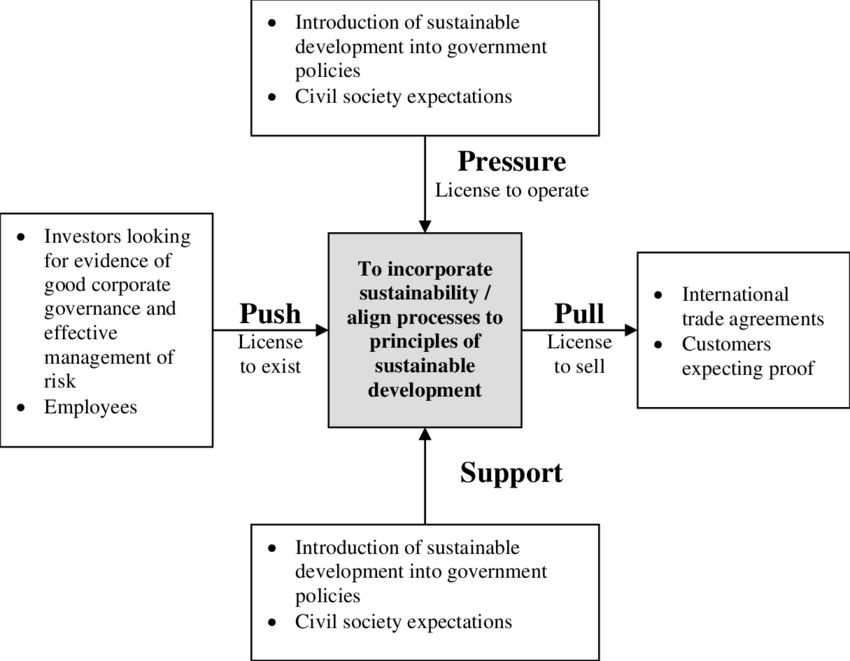
364. Push-pull model – Drivers for the incorporation of sustainable development into business practices (Brent and Premraj 2007).
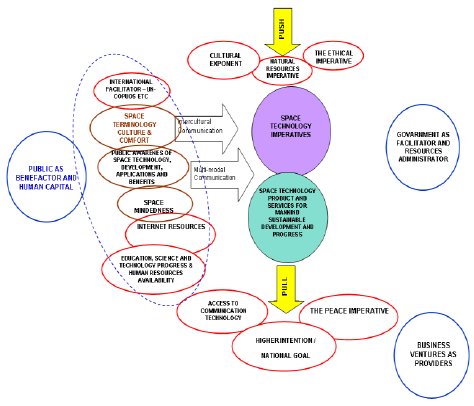
365. Push-pull model applied (Harijono Djojodihardjo) Note, I try to avoid diagrams about specific applications (in this case Space Technology), but I think this one adds a unique modelling approach to our understanding of sustainability itself
An upstream-downstream (or push-pull) model illustrating the relevance for sustainable development of Space Technology within a local cultural background
366. Lifestyle impacts (link to larger, SPREAD 2050)

367. Pillars stacked into an um… pillar of systems (Cities as sustainable system Xuemei Bai 2016)

368. Tension and Wisdom (Sasse-Werhahn 2018)

369. Mindfulness (Wamsler in Brossmann 2018)
A framework for systematizing and analyzing the interlinkages between mindfulness and sustainability from the individual to the global scale (Fig. 1). These aspects are culturally shaped and include: (1) subjective well-being; (2) activation of (intrinsic/ non-materialistic) core values; (3) consumption and sustainable behavior; (4) the human–nature connection; (5) equity issues; (6) social activism; and (7) deliberate, flexible, and adaptive responses to climate change. The framework thus supports the understanding that mindfulness can be seen as a key concept to politically sensitizing people and organizations to the consequences of unquestioned structures and power relations.
The mindfulness-sustainability framework can broaden the spatial horizon and help to understand impacts on (distant) communities that might be incongruent with declared values. Understood in this way, mindfulness is no longer a concept that only addresses cognitions and cognitive schemes, but also fosters a sense of appropriate or just behavior (cf. Senghaas-Knobloch 2012). It, therefore, bridges the gap between individual and global scales and wider socio-political structures.

370. Social Sustainability Framework (Design for Social Sustainability: A framework for creating thriving new communities) (Woodcraft 2011)
The Young Foundation has developed a framework containing four elements
that are essential to build new communities that will be successful and sustainable in the long term. These are: amenities and social infrastrucutre; social and cultural life; voice and influence; and space to grow. While all four elements are needed in every new community (alongside good housing, high quality public buildings and spaces, local economic opportunities and design that supports pro-environmental behaviour) social success and sustainability cannot be prescribed in the same way that the standards for green building or environmental sustainability can. A more flexible approach is needed that leaves room to reflect local circumstances and the diverse nature of every community and its individual residents.

371. Value creation in sustainable dynamics model (Stark and Lindow 2017)
The Sustainability Dynamics Model for the first time ever enables the visual and
qualitative capabilities for showing the interdependencies and causal effects of
value creation solutions (e.g. as part of sustainable product development and sustainable manufacturing) with the major systems of the three sustainability dimensions of environment (planet/earth), economy (enterprises) and society (individual). At this point, in time the Sustainability Dynamics Model exists at a foundational level in order to allow high level and principle trade-off discussions and qualitative reasoning.The Sustainability Dynamics Model (SDM) is an instrument for describing the direct and indirect effects of value creation solutions on the three dimensions of sustainability and vice versa. Since value creation solutions are the key elements they become the central focus of the model. The three dimensions of Sustainable Development (environment, society and economy) actually represent systems of their own and evolve around the value creation solution
The effect of a value creation solution on the dimension systems of sustainability
can be defined as an inside-out effect. Even so, cause and effect vary with different value creation solutions and their impact on sustainability, among other factors. The
Sustainability Dimension Model allows an opposite contemplation, which is called
an outside-in effect.The direct and indirect effects along the Sustainability Dynamics Model can be
defined as inside-out effects and outside-in effects. These effects can be either
observed when the model is read from the inside (sustainable value creation) to the
outside (sustainable dimension systems,) or, vice versa, from the outside the inside.

372. Value Creation Factors treat pillars as dimensions (Bonvoisin 2017)

373. Value mapping tool (in Evans et al. 2017, Yang 2017, Bocken 2014, Yang’s thesis 2015) (including “value uncaptured”)

(Also some interesting looking cards).

374. A tree. just because. It’s really a graphical index to Synovation‘s services, but I like it.

375. Sustainability as part of sociotechnical innovation system of impact and time scales (Gaziulusoy and Brezet 2015)

376. Another tree. This time here because of the depth of learning dimension (Valley 2017)

378. City Resilience Index (based on Arup’s Sustainable Project Appraisal Routine).
(text from Adams 2018)
As its circular form suggests, in addition to detailing the “strengths and weaknesses” of a given city, the CRI provides a holistic framework in which certain causal relations across the various indicators can be identified.
While both the SPeAR and the CRI are reflexive tools for assessment, a crucial difference between the two is how each locates a particular temporality in regards to the crisis it aims to address. In the case of the SPeAR model, its role is clearly preventive: it works as a framework to improve upon “business-as-usual” practices of urban design by demonstrating how the ecological footprint of a given scenario can be lowered and energy use mitigated.
Unfortunately, the world surpassed Peak Sustainability in 2005 when the big gamble of staving off climate change with lackluster campaigns of better-than-business-as-usual development was confronted with the very visible effects of climate change.

378. 1000 year sustainability (Mouri 2014)

379.1000 year sustainability (2) (Mouri 2014)
Conceptual diagram of a socio-ecological system for millennial-scale sustainability development, which is influenced by spatial and temporal variations, and the relationship between human and economic activity, and environmental issues

380. Transition to sustainable (water) (Johannessen and Wamsler 2017)
A conceptual model for the process of transition into a more sustainable and hazard-resilient state of urban water. Here, all three levels of resilience need to be taken into account (socioeconomic, external hazards, and social-ecological scale) so that focus on resilience at one level does not compromise the sustainability of another (1-2), where enabling and disabling factors for human agency (3) influence the process of social learning, monitoring, and memory (4). Actors need to navigate uncertainty through prioritization and diversification (5). When thresholds of risk awareness and action capacity are reached (6), measures are put in place, and/or a reorganization occurs (7) and the system makes a transition.

381. Chemical pyramid (Heintz 2014)

382. Typology of business sustainability (Dyllick and Muff 2016)
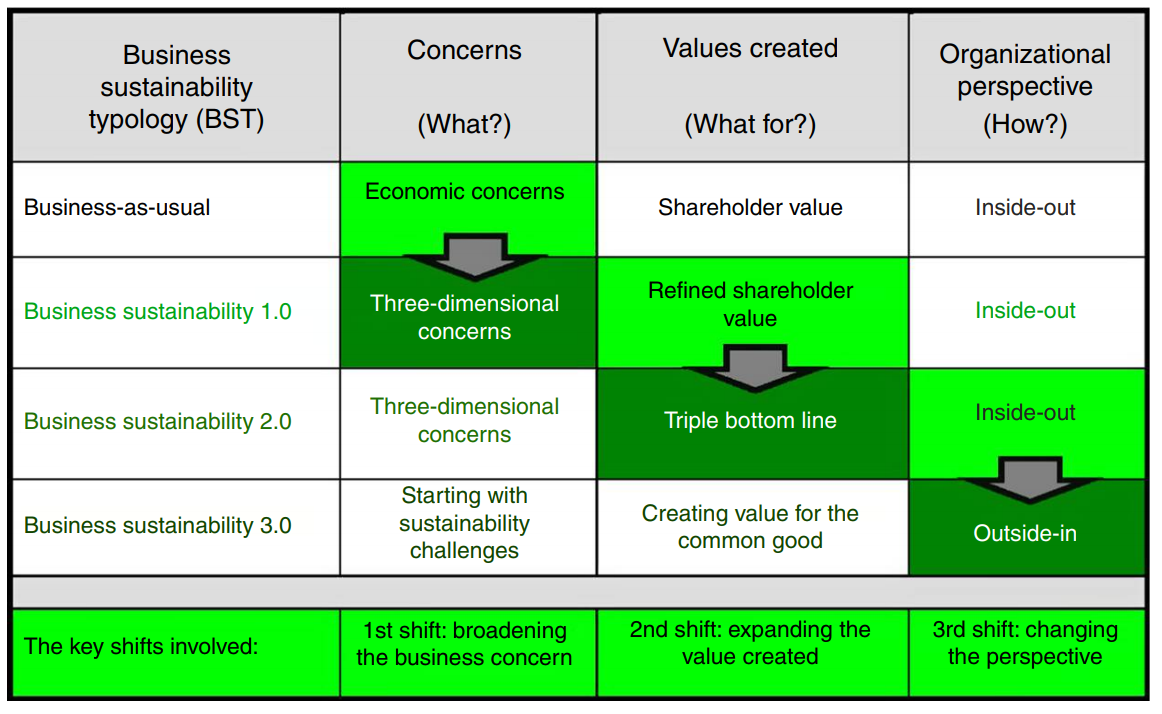
383. Circle model (Muff 2017)
The real challenge here is the need for an integrated approach of the three key challenges that are need to be overcome when shifting from “inside‐out” to “outside‐in” perspective in order to truly solve the SDGs. It is helpful to consider these three challenges as three different dimensions of engagement as referred to when discussing global responsibility: the “I – we – all of us” (see Figure 2). There is the individual level that addresses the leadership dimension discussed as the third challenge (the “I”), the group level addresses the organizational dimension identified as the second challenge (the “WE”), and the Grand Challenges or issue‐related challenges reflects the larger societal dimension of the first challenge (the “ALL‐OF‐US”). These three dimensions are interconnected and interdependent. Wanting to change one dimensions often implies the necessity to change and amend the others. It is important to work with tools that are designed so that they address not only each challenge individually but enable a further three‐dimensional transformation across all three challenges.

384. Move the dots with your eyes. The circles show the rate of change in dynamic management. No idea what the dots are. (NOAA fisheries and climate change 2019)
The strategy involves first assessing the risk and vulnerability of species, habitat, management approaches and human communities to climate-induced changes. Second, scientists, resource managers, fishing industry members and others evaluate how the existing suite of management measures would perform under different climate and socioeconomic scenarios and identify gaps in institutional capabilities, jurisdictional relationships and funding. And third, they define the optimal combination of management measures and approaches to facilitate adaptation and resilience.
-
Fixed Measures. Developed, implemented and revised over longer timeframes, every ten years or more. Examples include: restrictions on areas where different fishing gear can be used, aggregate harvest limits (catch limits for groups of species), fishing moratoria and marine protected areas.
-
Adaptive Measures. Account for annual or multi-year variability of resources and include quota-based fishery management, rotating closure areas or seasonal closure areas that are adjusted annually or periodically (less than five years).
-
Dynamic Measures. Used during the fishing year to minimize socio-economic consequences with the help of environmental and ecological forecasts and nowcasts that include real-time input from fishermen. These include in-season adjustments to fishing quotas or areas or continuously updated maps of bycatch high-risk areas.
385. Sustainability in Digital Futures (Towards our common digital future. German Advisory Council on Global Change)
Three Dynamics of the Digital Age. The chart shows the positive case of the Dynamics being successfully contained through goals and design. All three Dynamics are already emerging in parallel today, albeit with different levels of intensity, so there is no strict chronological sequence involved. Each Dynamic consists of different subpaths pointing in different directions. The name given to each Dynamic reflects the priorities for action required in each case. The texts beneath the figure give keywords on the potential (upper row) and risks (lower row) of the three Dynamics.

386. Normative compass (Towards our common digital future. German Advisory Council on Global Change )
Normative compass for the Great Transformation towards Sustainability in a digitalized society. The transformation can be achieved by interaction and a balance between the following three dimensions: ‘Sustaining the natural life-support systems’ (N): Comply with planetary guard rails and avoid or solve local environmental problems. ‘Inclusion’ (I): Ensure universal minimum standards for substantive, political and economic inclusion. ‘Eigenart’ (E): Recognize the value of diversity as a resource for successful transformation and as a condition for well-being and quality of life. Up to now, human dignity has been the WBGU’s implicit normative starting point. It cannot be realized without the three compass dimensions, but, as a result of numerous challenges, it is becoming an increasingly explosive issue in the Digital Age. For this reason, the WBGU explicitly names the inviolability of, respect for and the protection of dignity as an aid to orientation in the context of the Transformation towards Sustainability.

(Eigenart translates from German as a peculiarity or individuality, or “individual character”)
387. Theory of Ecologic Transition: a dynamic towards sustainable development (Fernandes 2012)
In effect, by reconciling the elements of profit, innovation and conservation in what is necessarily an unstable equilibrium, reducing assaults on the environment as far as possible (Figure 1), the question of sustainability extends the concept of solidarity. Solidarity is understood here to mean equity, among both the various populations and the individuals of which they are composed, and among the current agents of development and future generations. These thus gain a significant status in the wider issue of discussion on the viability of the Earth, the common homeland of a Humankind that is increasingly considered in its global sense.

388. Mapping approaches (Hopwood 2005)
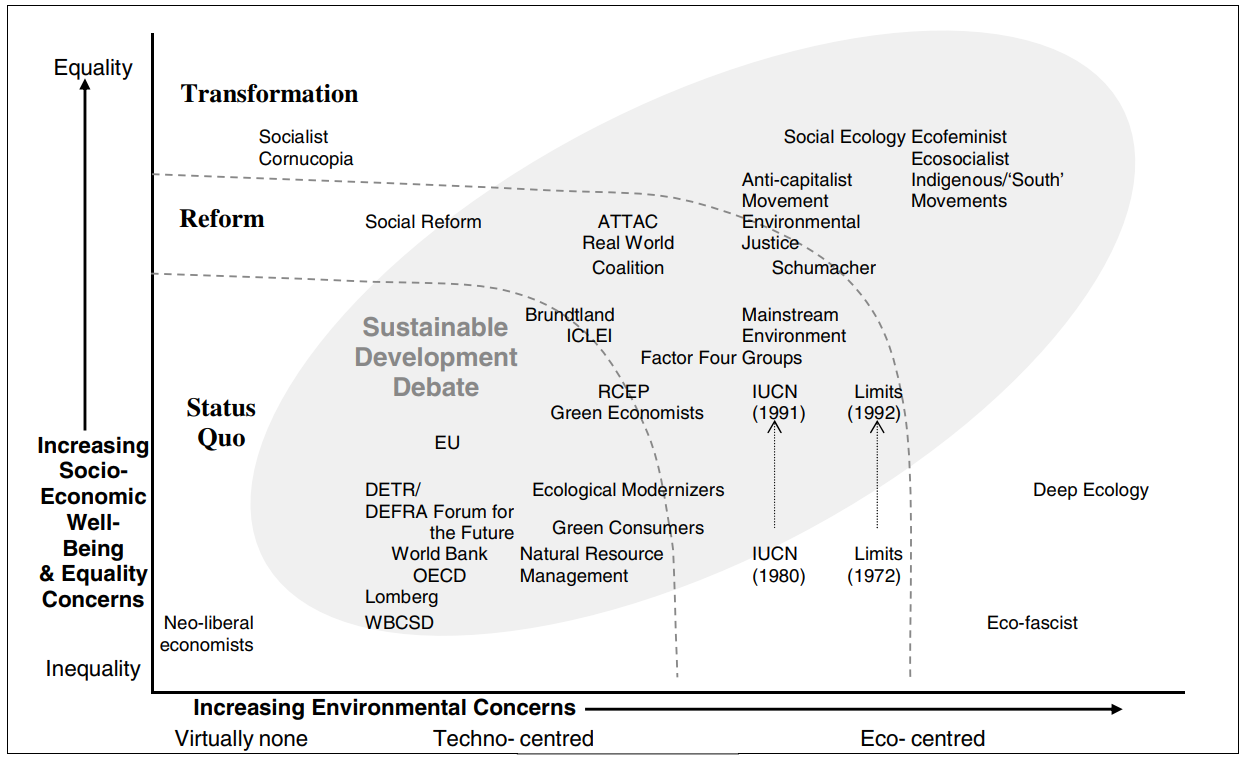
389. Dynamic sustainable management (Solablity)
In order to remain profitable, companies need to anticipate future trends and risks, both internal (in terms of operational management) and external (in terms of market, regulatory, and technology developments) – and this is what sustainable competitiveness is about. Sustainable management means integrating all the “non-financial” factors that have indirect financial impacts. Sustainable management is not a revolution – it is a natural evolution of management approach and paradigms in an increasingly complex business environment.

390. Sustainable Self (Murray 2011)

391. Wellbeing and hazards (in Tuuli Hirvilammi).

392. Decoupling – impacts and resources (UNEP 2011)
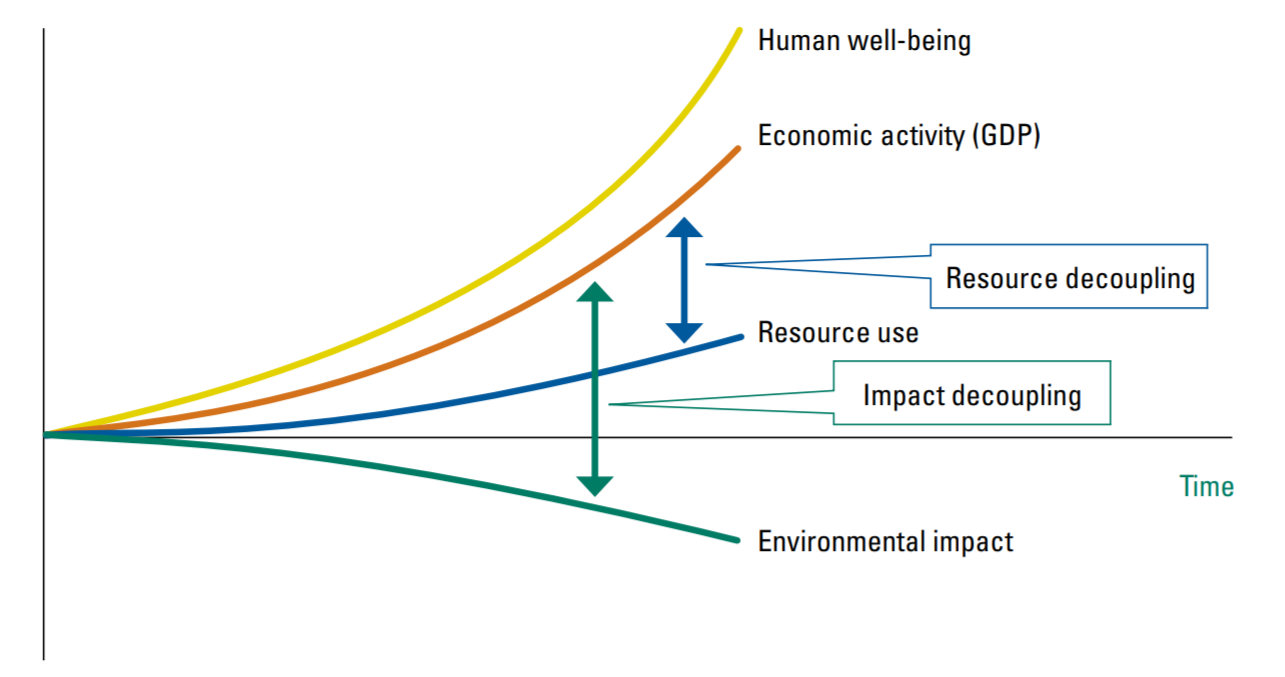
393. Industrial Ecology (University Leiden)
Our department ‘s research aims to support the ecological transformation of society and environment towards sustainability. The research subject is Industrial Ecology in its broadest definition, covering environmental systems analysis, and incorporating the social and economic aspects required for sustainability analysis. System analysis involves the development and application of concepts, methods and models.

394. Sustainable Innovation (Nadi Choucair)

395. Influence diagram of SDGs (Lim et al. 2018)
Influence diagram of the SDGs: illustrating links among the SDGs. Some goals have been split into subgoals to facilitate more precise mapping. Arrows highlight where one goal is likely to have an impact on another goal. The arrowhead represents the goal that is impacted. There is no value attached to the type of impact (i.e., it could be a positive or negative impact). The arrows just illustrate that a relationship exists.
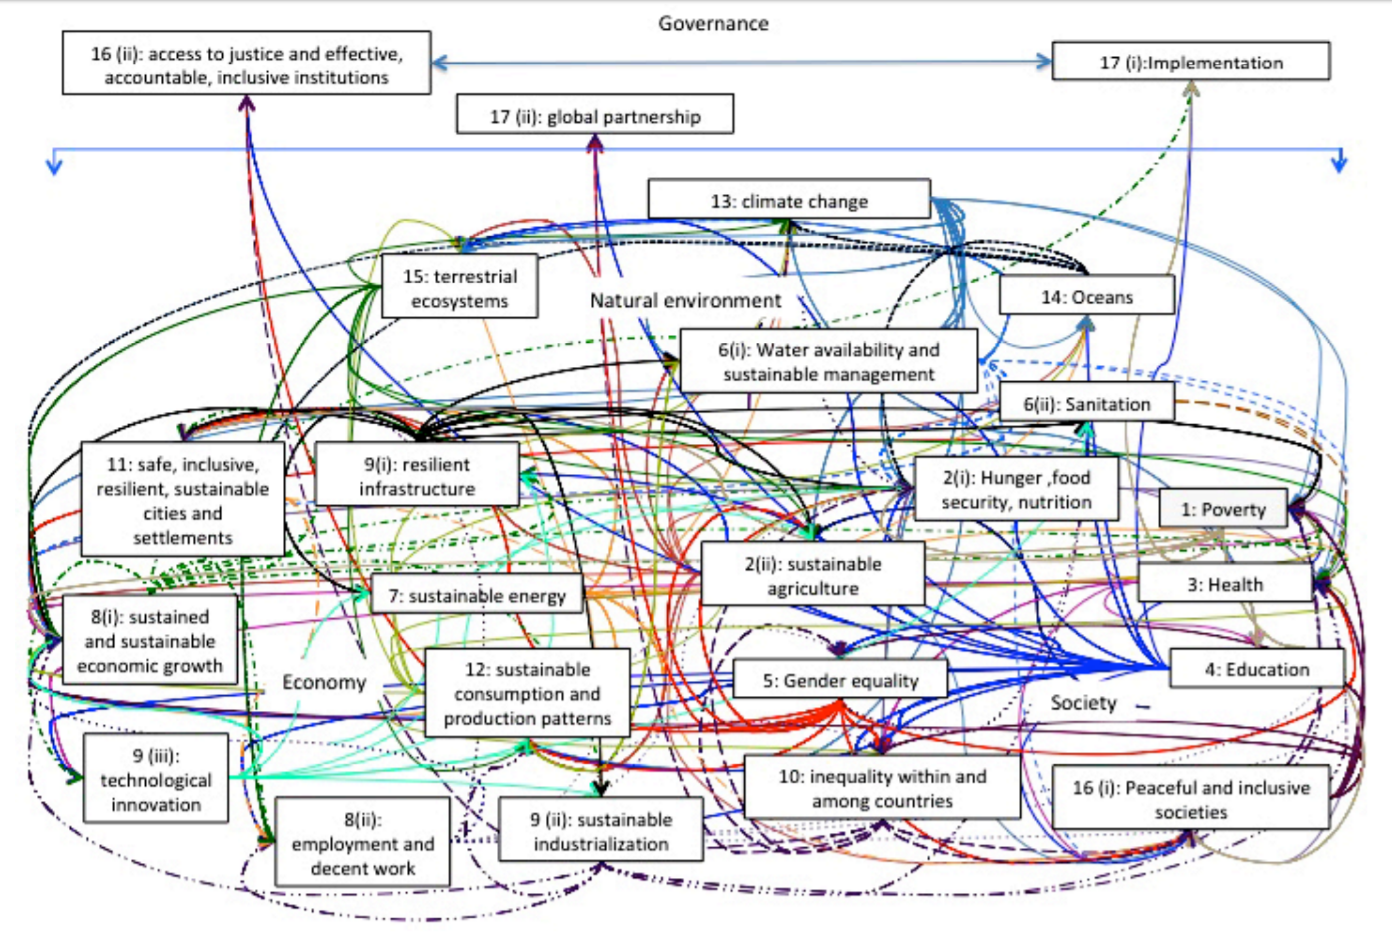
396. Overarching directions (Lim et al. 2018)
Required relationships among the seven overarching directions to orient the SDG system toward the sustainable development end goal: at the core, a stable resilient Earth system (OD3) is the foundation for thriving lives and livelihoods (OD2). This influences and is influenced by a sustainable economy (OD 7). Innovation and education (OD6) are required to facilitate integration across the economic, social, and ecological components of sustainable development and to develop mechanisms to simultaneously advance all three components. This is mediated and regulated by an overarching enabling framework (OD1). To achieve the sustainable development end goal intragenerational (OD4) and intergenerational (OD 5) equity need to be included in the implementation of all other ODs, including OD1. Intragenerational equity (OD4) contributes to future intergenerational equity (OD5).

397. Aligned holistic thinking (DiVito and Bohnsack 2017)
(text via Smart City Innovation Lab 2017)
Researchers…explored the paradox of sustainable entrepreneurs that are oriented on one side towards entrepreneurial growth and on the other side towards sustainable development. Furthermore, they give an insight into sustainability decision making and how entrepreneurial orientation effects sustainability decision tradeoffs.
The singular profile suggests that in making sustainability decision tradeoffs there is a conviction to prioritizing one sustainability dimension above the others. Firms using this kind of singular sustainability decision making are bound by their values and strictly adhere to their principles. Further, they are mission-driven rather than profit-driven and extend theory by showing that sustainable entrepreneurs are more risk taking and proactive individuals and firms. They for example accepted lower profitability or growth compromising the economic dimension. According to the data the focus was on the social dimension like in the following example.
“[We] produce in the Netherlands because I want to be sure about the working conditions. We could produce elsewhere and it would be cheaper [but we don’t want to].”
Flexible decision making accepts greater compromising between the three sustainability dimensions, uses an ordered prioritization and corresponds to high innovativeness and proactiveness.
The holistic profile integrates all three sustainability dimensions, uses an aligned prioritization and corresponds to high proactiveness and risk taking.
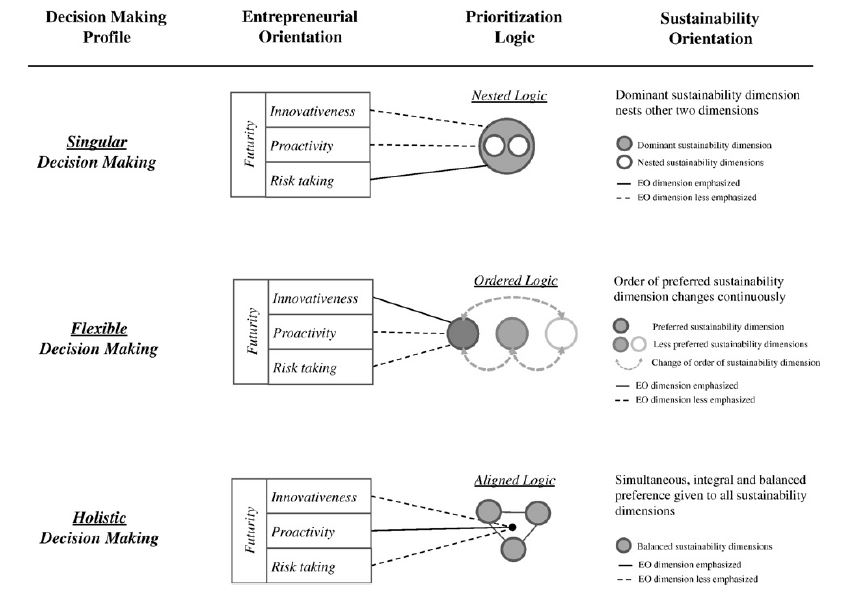
398. Singing in the rain. (Ashrafi 2018)

399. Double-coin quadruple helix (Kolehmainen 2016, via Boyes 2018)
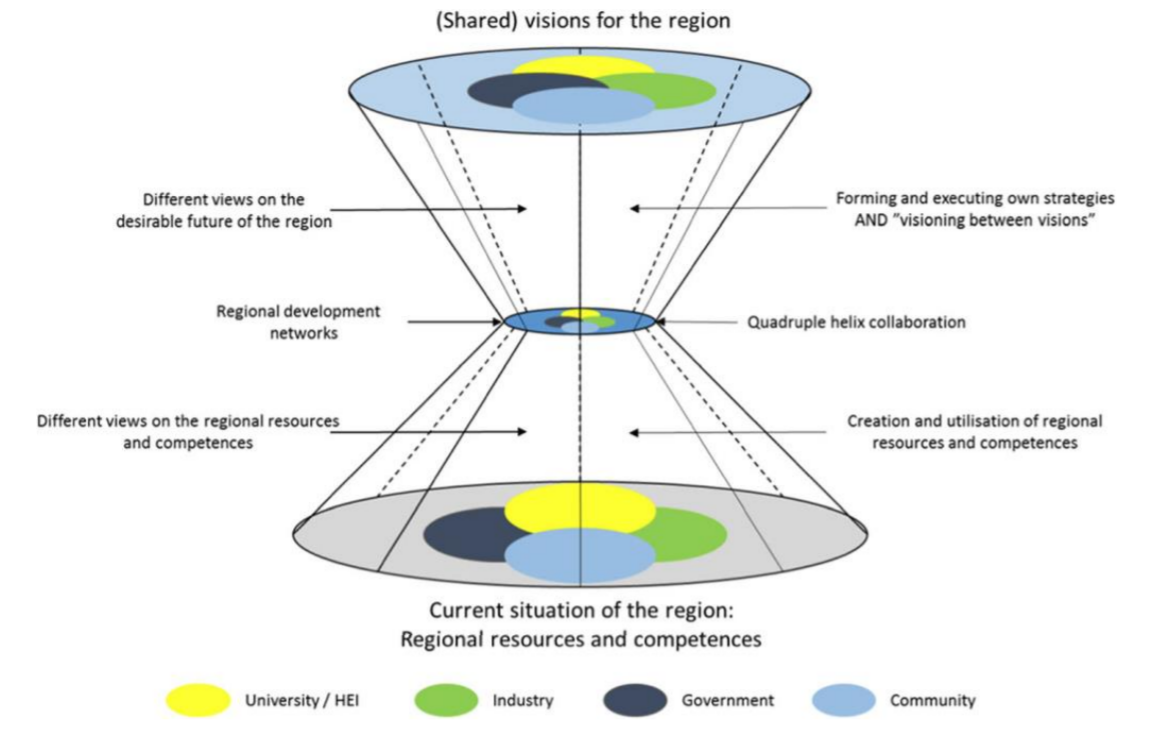
400. Transformation Mindset (Mann et al. 2018)
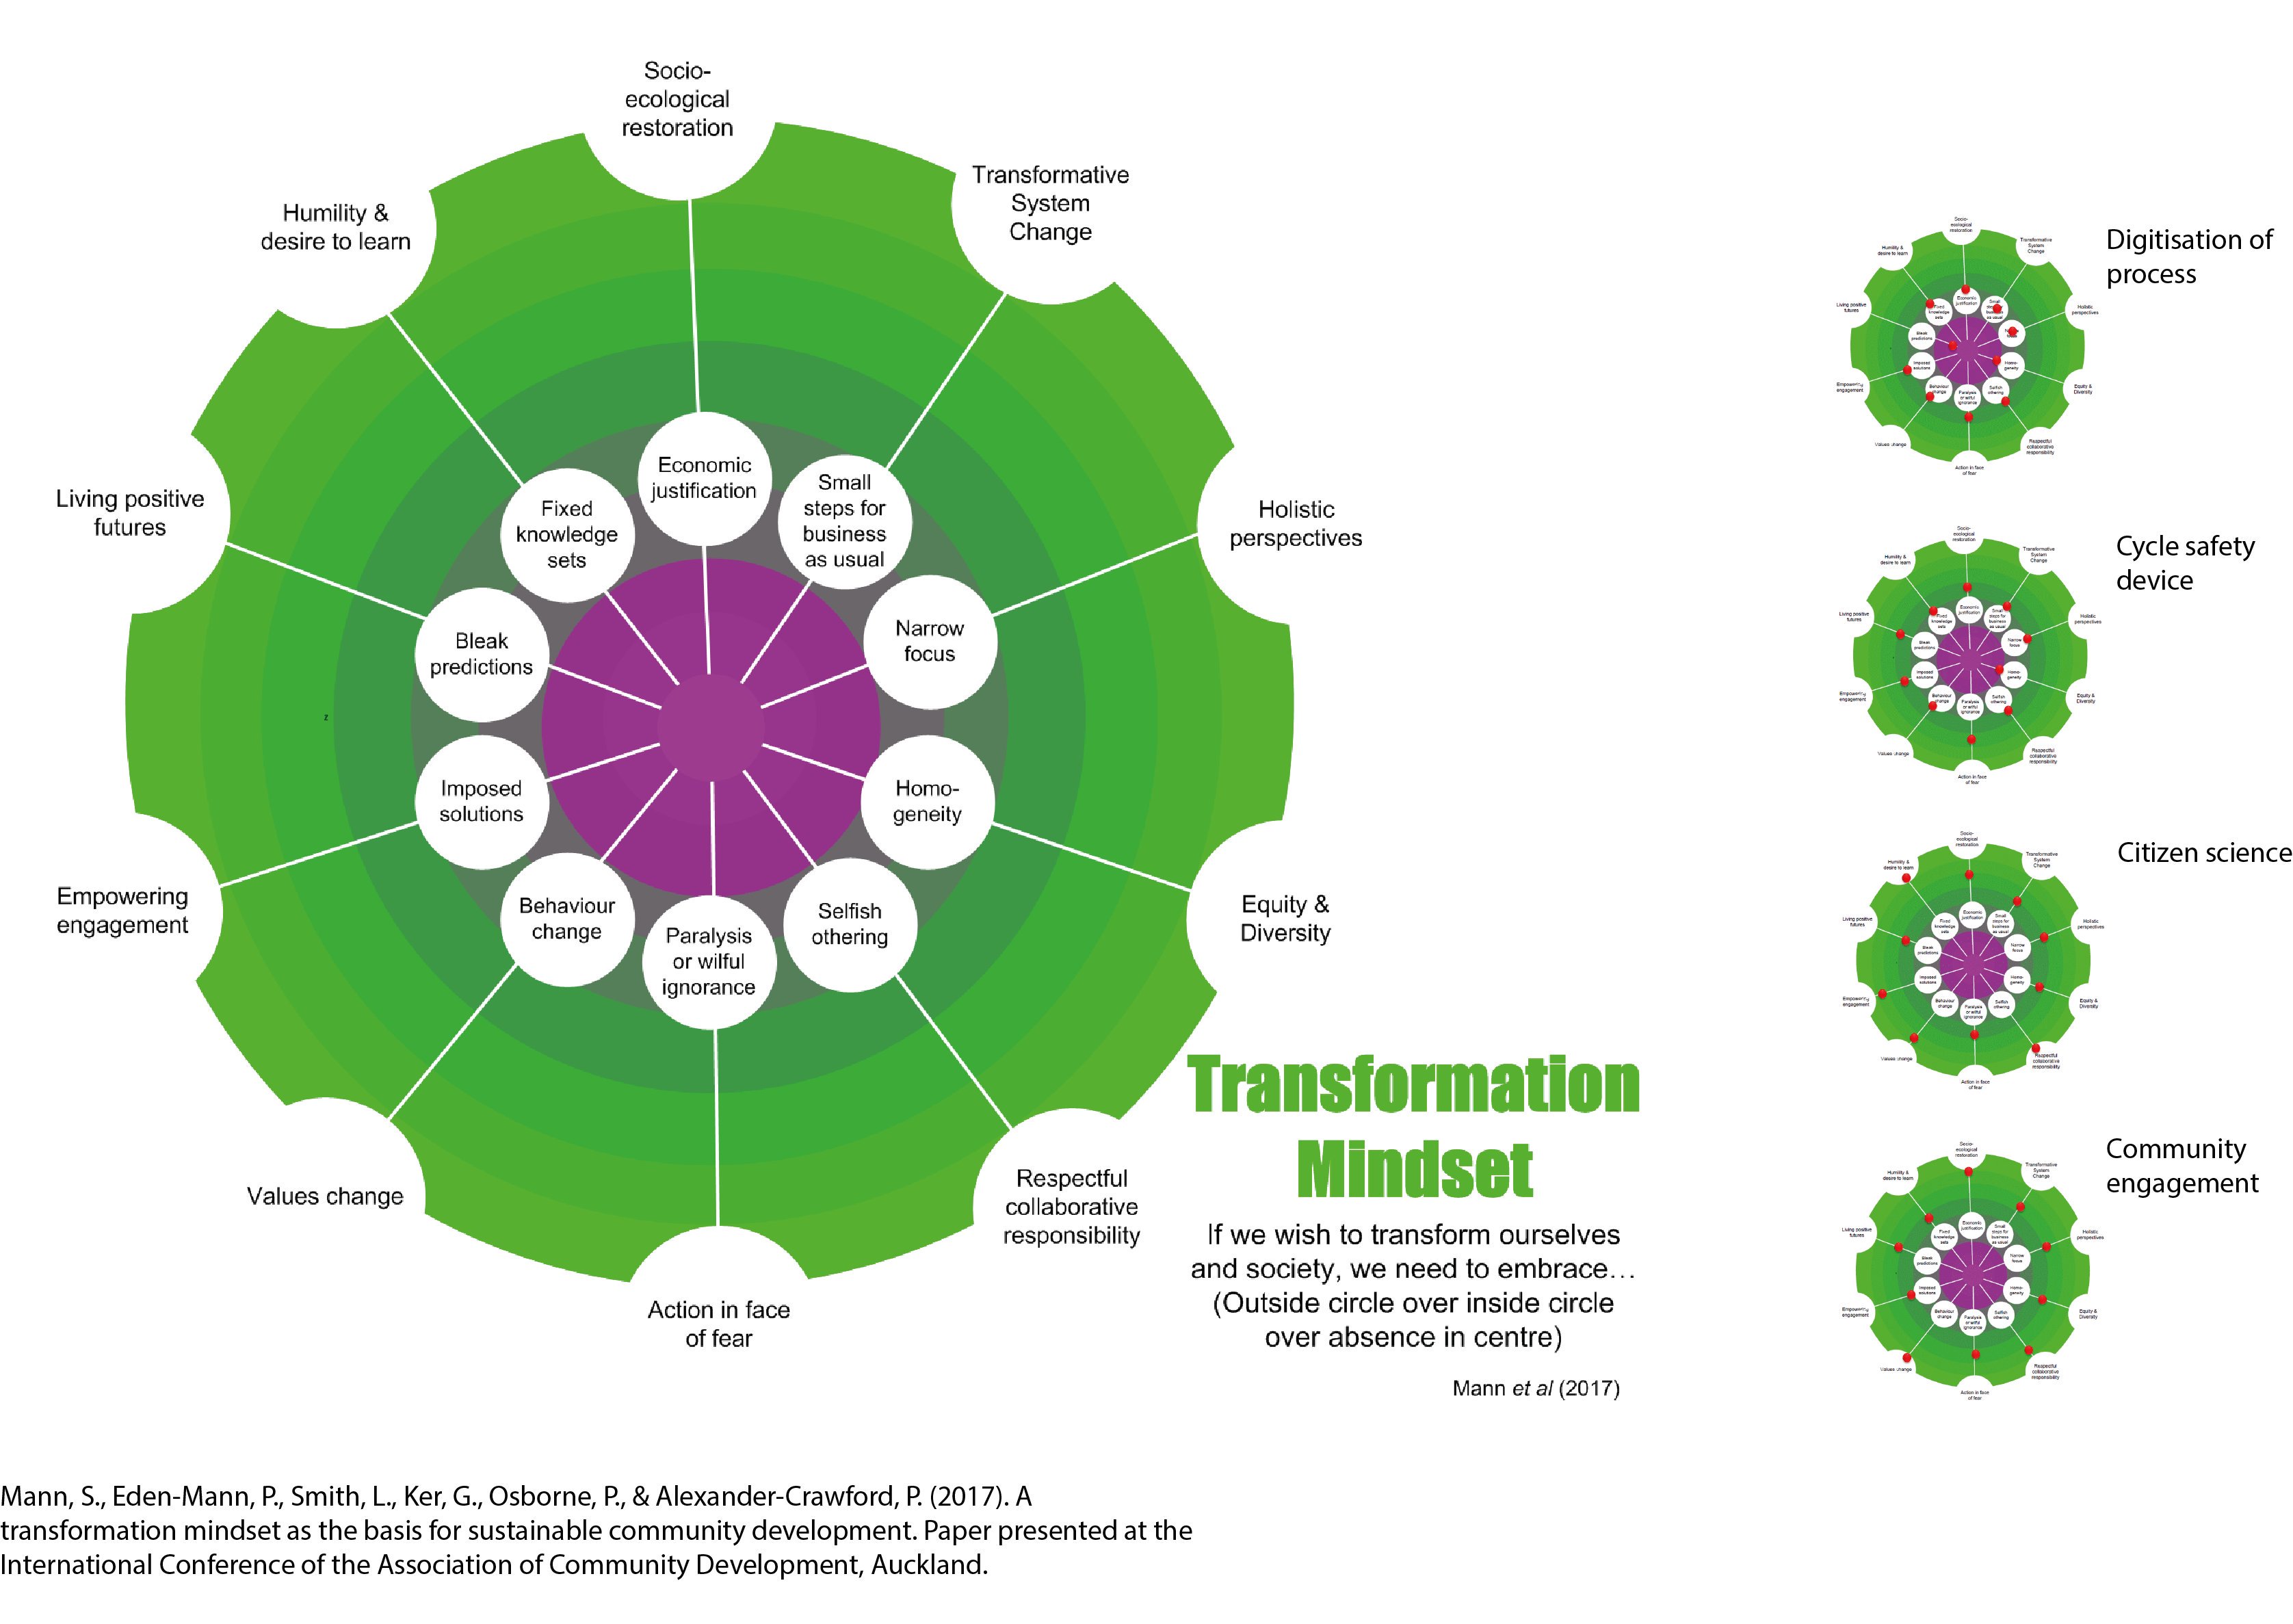
401. Metamap (Ray Maher, Samuel Mann et al. 2018)
MetaMAP is an interactive graphical tool which supports collaborative investigation and design for achieving SDGs. It helps diverse users to integrate their thinking, understand sustainability challenges holistically, and develop well-integrated solutions. In brief, the structure and application of the MetaMAP framework help users gain insight by seeing relationships among parts of the natural environment, built environment and society across multiple spatial and temporal scales. It provides an inclusive framework to help people from different backgrounds integrate their diverse perspectives on sustainability issues into a common understanding. Armed with this holistic perspective, guided process help users to identify points of leverage and design well-integrated sustainability initiatives.

402. Satellites (Stilianakis et al. 2005)
Conceptual model for sustainable development, including environmental health and air pollution. This frame-work for the science/policy interface and policy building includes three different perspectives: ecology, economy and human /social. Their dynamic interaction includes institutional and actor elements, and ultimately leads to decision-making on a target quality of life

403. Minor’s Sustainability Framework
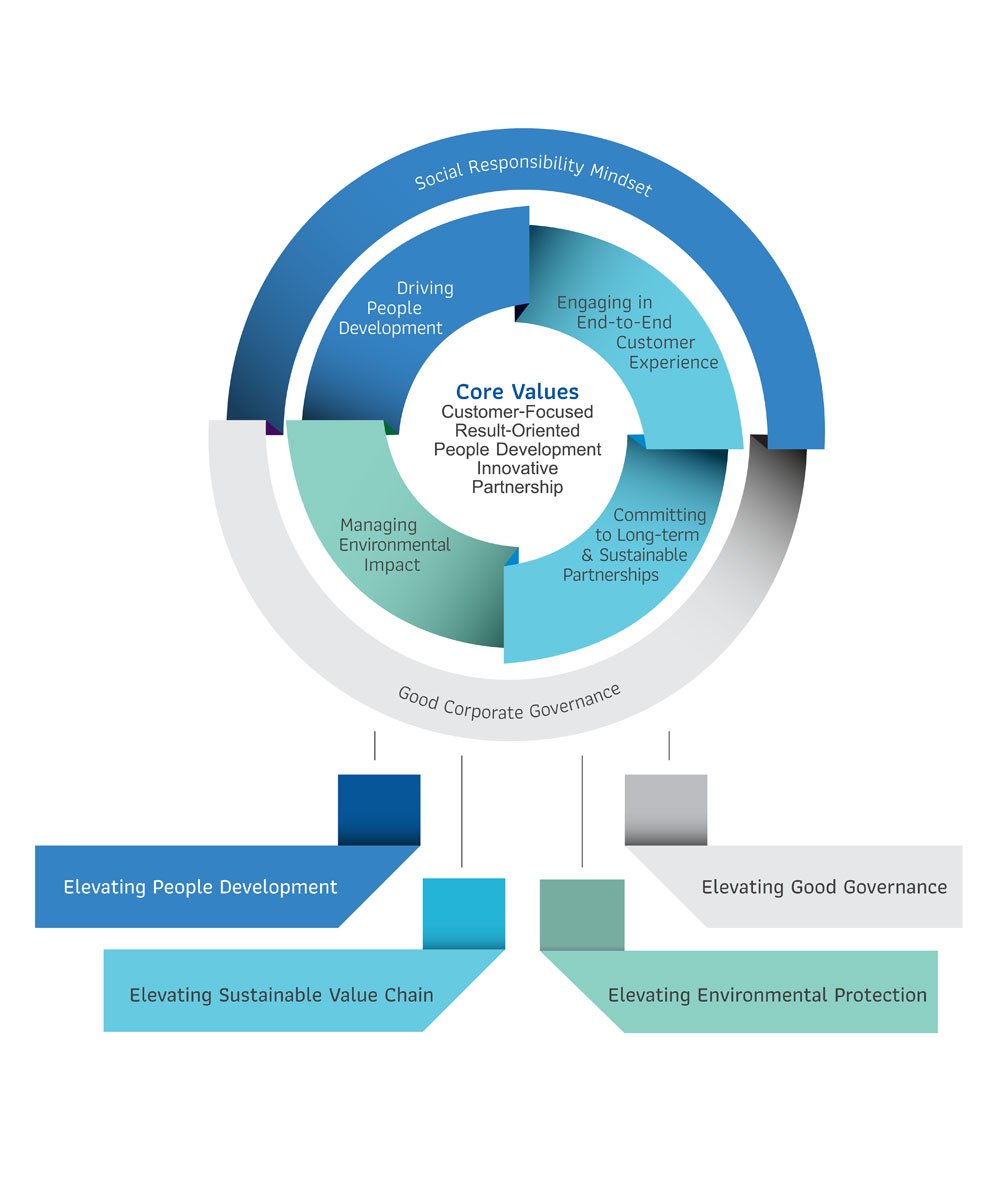
405. 5 pillars wrapped in scenarios and technology (Prosuite)

406. SSS Bubbles – Sustainability, Science, Society. (McGill)

407. ChildFair State tree (Children England 2018)
The diagram shows how we see the ‘branches’ of the welfare state informed by a child-centred version of Maslow’s five needs, and fed by the ‘roots’ of a sustainable economy and environment, and authentic democracy and human rights.
Our inquiry will involve testing the branches of the current welfare state to see how well they deliver on children’s need for home, safety and security, love and belonging, health, and purpose – and how new policies and practices could be designed and structured to enable them to do this better.

408. Ball and cup (Steffen et al. 2016)
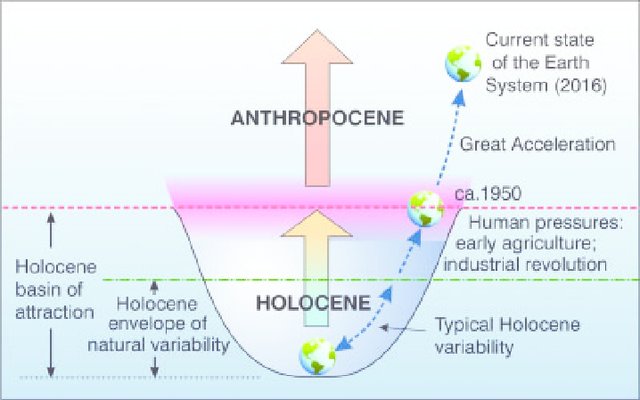
409. Ball and Cup over time (Steffen et al. 2016)
A ball-and-cup depiction of a regime shift. The cup on the right represents a stable basin of attraction (the Holocene) and the orange ball, the state of the Earth System. The cup on the left and the pink ball represent a potential state (the Anthropocene) of the Earth System. Under gradual anthropogenic forcing, the cup becomes shallower and finally disappears (a threshold, ca. 1950), causing the ball to roll to the left (the regime shift) into the trajectory of the Anthropocene toward a potential future basin of attraction. The symbol í µí¼ represents the response time of the system to small perturbations.

410. Trajectories of the Earth System in the Anthropocene (Steffen 2018)
Stability landscape showing the pathway of the Earth System out of the Holocene and thus, out of the glacial–interglacial limit cycle to its present position in the hotter Anthropocene. The fork in the road in Fig. 1 is shown here as the two divergent pathways of the Earth System in the future (broken arrows). Currently, the Earth System is on a Hothouse Earth pathway driven by human emissions of
greenhouse gases and biosphere degradation toward a planetary threshold at ∼2 °C (horizontal broken line at 2 °C in Fig. 1), beyond which the system follows an essentially irreversible pathway driven by intrinsic biogeophysical feedbacks. The other pathway leads to Stabilized Earth, a pathway of Earth System stewardship guided by human-created feedbacks to a quasi-stable, human-maintained basin of attraction. “Stability” (vertical axis) is defined here as the inverse of the potential energy of the system. Systems in a highly stable state (deep valley) have low potential energy, and considerable energy is required to move them out of this stable state. Systems in an unstable state (top of a hill) have high potential energy, and they require only a little additional energy to push them off the hill and down toward a valley of lower potential energy
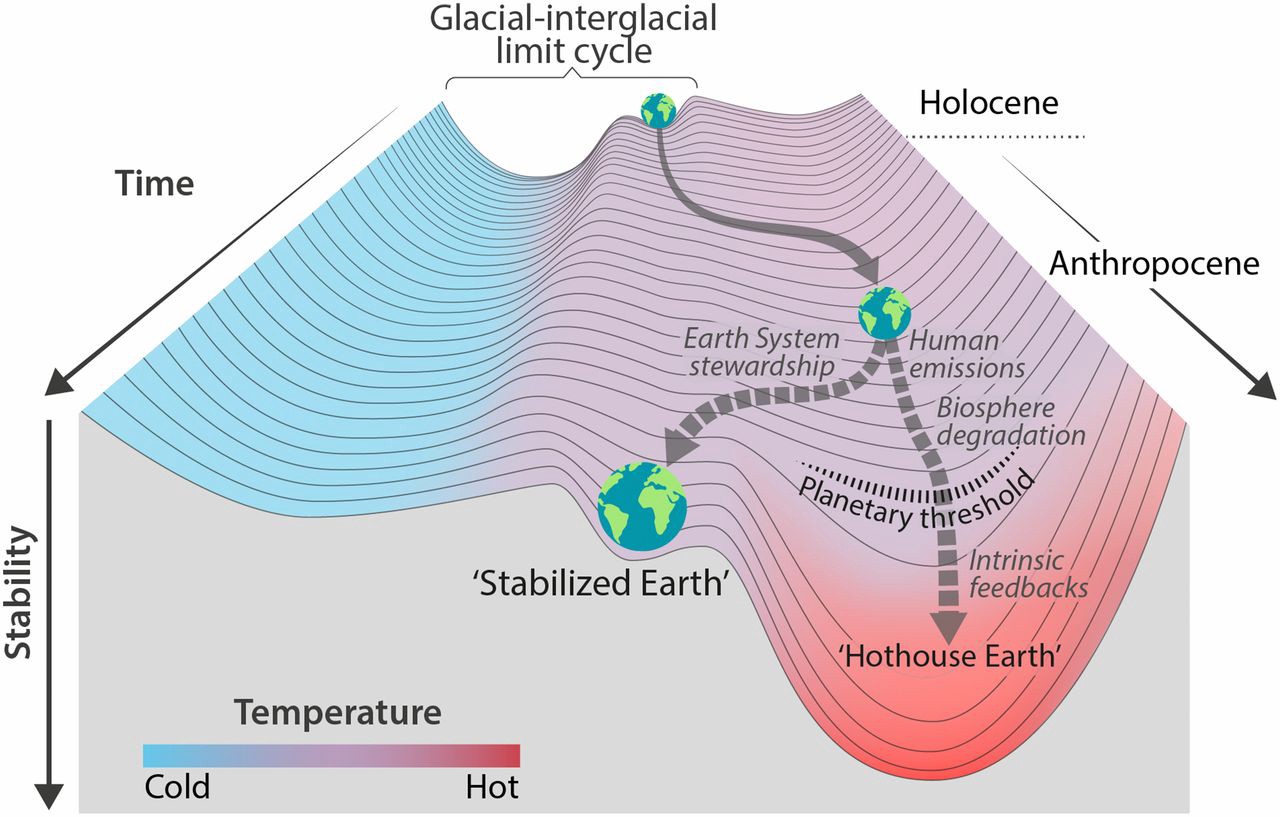
410. Ball and cup sustainable option (A) (Steffen et al. 2016)
The scenario in Figure 6a is broadly consistent with the Sustainable Development Goals and the 2015 Paris climate targets and is based on rapid and deep reductions in greenhouse gas emissions and a radical turnaround in human exploitation of the biosphere. In this scenario, we assume that the climate is significantly warmer than that of the Holocene, but remains in more intense interglacial conditions with most of the Antarctic ice sheet intact; here the intensity of an interglacial is defined by a range of indicators representing different aspects of the Earth System (e.g., proxies for insolation, astronomical parameters, maximum CO2 and CH4 concentrations, global average surface temperature anomaly. In this putative state of the Earth System, biodiversity does not decline much with respect to current conditions.

411. (enough of the balls and cups. How about…) A fractal tree. (Balgojevic 2015).
Tree of multidimensional sustainability”: conceptual dynamic model of a sustainable society based on cybernetic systems and fractal models.
A sustainable society cannot be neatly drawn to fit into geometric forms, such as a triangle or circular diagram, but a new vision is needed in order to show how this system is constantly evolving and making room for different dimensions‘ perceived importance in society [51]. These elements of what make a sustainable society, at any given moment, are never universally agreed upon nor fixed. Ideally, society would be capable of increasing well-being in an equitable and balanced way in terms of resource consumption, neither limiting the economy of material inputs nor the expansion into several dimensions these may be numerous and differentiated but a complete list of these will never be possible (thus presuming there will always be gaps) and points of overlap are unavoidable. Such a possible conceptual model can be given by a tree-like fractal model.

412. Threats or opportunities (Schulte and Hallstedt 2018)

413. Chassis framework (Calfresh Schools)

414. 9 economies (Matrix-Q)

415. Matrix-Q’s timeline. Where we are and where we think we are.(Matrix-Q)

416. Convergence of epistemological currents of sustainability (Cisneros 2015)
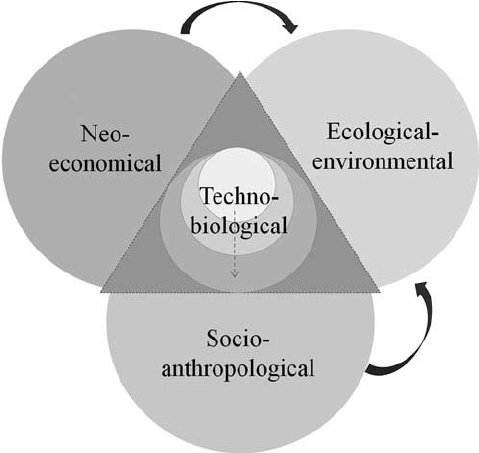
417. Ribbons! (Australian Sustainability Curriculum Framework)

418. Tropophillic (Sustainable Systems International)
Tropophilia is the ability to thrive on uncertainty and chaos, i.e., going beyond resilience and antifragility.
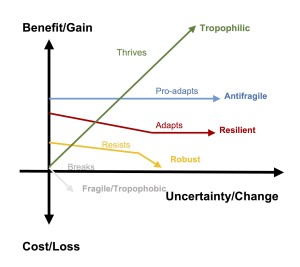
419. Triple Responsibility of an Enterprise (S = Subject of Responsibility) (Schüz 2016)
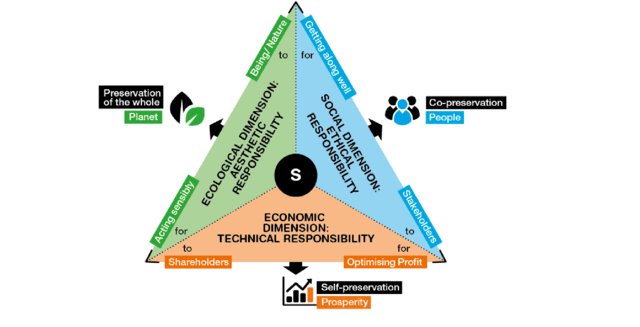
420. Model of Sustainable Corporate Responsibility (SCR) (Schüz 2016)
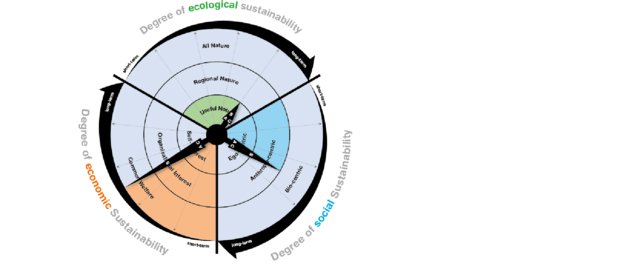
421. Schwartz values extended to sustainability (Education for Sustainability on outer ring) (src)

422. Quintuple Helix. Triple helix of innovation (government + education + industry) + society (quadruple) plus environment. (Carayannis 2012 who lists lots of other versions).

423. Triple helix (innovation’s govt, uni & industry) stemming from Barbier’s Venn (econ, eco, soc) (Scalia 2018)
(why? surely not just because the both have three and you can extrude a sort-of-helix from the intersection?) OK, is explained here…
In Fig. 1, focus is on interaction among the three dimensions represented as a ‘helix’ whose dynamic changes over time modifying the dimensions of the spheres by impacting on economy, environment and society. The model focuses on
the interaction between the roles and actions of key actors that are responsible of relevant effects on the three dimensions of sustainability. In particular:Intersection between society and environment: ‘governing’ actors, typically policy makers, but also associations and other organizations capable of influencing government decisions, are responsible for defining rules and constraints to comply with when using the resources that are available within the general environment; hence, in this area, the set of necessities as what is necessary to protect the equilibrium of the three dimensions of sustainability, is defined;
Intersection between society and economy: ‘thinking’ actors, typically the scientific, academic and education world leading the knowledge creation processes, given
the set of available resources, on the one hand, and the defined rules and constraints, on the other hand, are responsible of defining/creating the possibilities in terms of all the possible evolutionary paths of development that can be followed;
Intersection between economy and environment: ‘economic’ actors, starting from all the possible development trajectories identified by the thinking actors, selects those
more feasible and profitable to develop effective solutions, so complying with the necessity of harmonizing the social, economic and environmental dimensions of
sustainability (effectiveness).

424. Bounded economy of capabilities for flourishing (Jackson 2012)
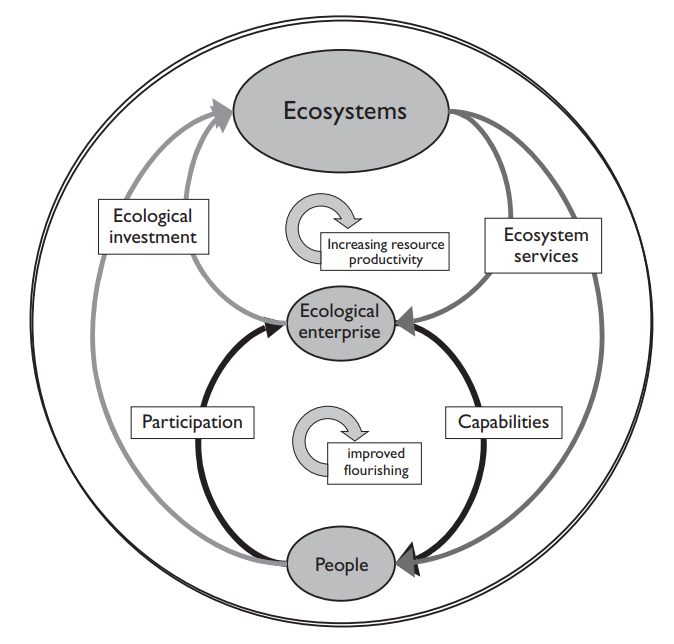
425. Bounded Population-Economic-Ecological System for Sustainable Human Development (Adapted from Jackson by Gutiérrez 2016)
There are three sets of feedback loops: human development, human adaptation, and industrial mitigation. The human development loops (yellow arrows) improve gender equality and other human capabilities, and guide the allocation of income/commodities generated by the economic system. The human adaptation loops (red arrows) drive ecological investment so as to enhance the sustainability of ecosystem services. The industrial mitigation loops (green arrows) improve the productivity of energy and other resources by using “industrial engineering” methods. The working hypothesis is that mitigation loops are helpful as long as their operation is subservient to, and do not interfere with, the human development and human adaptation loops.
The convergence of gender balance, energy balance, and sustainability emerges from gender imbalance and energy imbalance jointly driving human civilization toward unsustainability. Many other factors are involved, but gender and energy imbalances are the most pervasive, and balancing them would have a neutralizing effect on all the other factors that conspire against a sustainable human society. If the transition from consumerism to sustainability is to be attained in a timely and civilized manner, i.e., before it is too late and minimizing violence as much as possible, balancing gender relations and energy flows would be the best (perhaps the only?) way to go.

426. Future world human system further enhanced to show self-correcting environmental and financial management loops (Gutiérrez 2016)
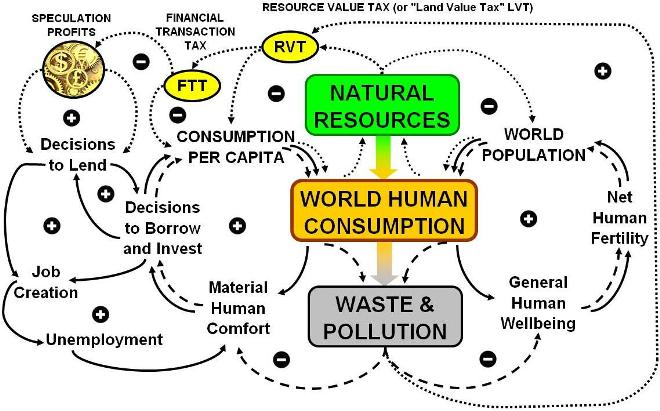
Based on “present world system” (based on Fey and Lam, #427)

427. Ecocosm Paradox (Fey and Lam 1999)
Both population and per capita consumption have positive feedback loops that force them to grow. Population growth is driven by a natural reproduction loop (upper right) and a biotechnology loop that extends life expectancy (middle right). Per capita consumption growth is caused by technology loops (middle left) reinforced by world economics and government action loops (far left).
These major loops arise in our society from human needs and motivations (bottom).
Environmental collapse, resource exhaustion, and toxic pollution constraints may create negative loops that will finally stop the growth (small loops in the very middle).

428. Leverage Points (Fischer 2019 after Abson 2017 after Meadows 1999)

430. Global Alliance for Humanitarian Innovation (GAHI) scaling framework (Lesley Bourns and Dan McClure 2019)
(strictly, this focusses on the narrow sustainability of innovation interpretation of sustainability. But McClure describes his work as Humanitarian Innovation, and I think we can learn from this model, I’ll let it through).
The GAHI framework breaks the scaling challenge into four major parts; Value Creation, Difficult Barriers, Sustainability, and Contextual Variation. Using this model, it is possible to structure and compare much of the one-off learning that has happened since 2015, consolidating progress on a host of different aspects of the scaling challenge:
1. Define Varied Paths to Scale: This work can include poorly understood challenges such as scaling product innovations in resource poor environments and scaling complex system solutions.
2. Solve the Hard Problems: Some specific barriers to scale are particularly difficult to navigate, such as finding business models when the users of the innovation lack funds.
3. Integrate Supporting Tools: There are a growing number of scaling tools for jobs such as assessing scaling readiness. It should now be possible to see how these overlap with one another, where there are gaps, and how new tools might be developed.

431. Resilience as function of adaptive cycle (Lister 2016)
Resilience has origins across at least four disciplines of research and application: psychology, disaster relief and military defense, engineering, and ecology. A scan of resilience policies (see http://resilient-cities.iclei.org/) reveals that the concept is widely and generally defined with reference to several of the origin fields, and universally focuses on the psychological trait of being flexible and adaptable; having the capacity to deal with stress; the ability to “bounce back” to a known normal condition following periods of stress; to maintain well-being under stress; and to be adaptable when faced with change or challenges. However, the use of resilience in this generalised context begs important operational questions of how much change is tolerable, which state of “normal” is desirable and achievable, and under what conditions it is possible to return to a known “normal” state. In policies that hinge on these broadly defined, psycho-social aspects of resilience, there is little or no explicit recognition that adaptation and flexibility may in fact result in transformation—and thus, require the adaptive and transformative capacity that is ultimately necessary at some scale in the face of radical, large-scale and sudden systemic change.

432. Window of opportunity for reorganization and new trajectories (In the context of New Orleans) (Oliver 2013)

433. Four Es of sustainability in engineering – and their conflicts (Basu 2015)

434. Vision for creating sustainable social-ecological and social-technical system (Beiji 2015)
A vision for creating sustainable social-ecological and social-technical systems a global view of resilience is presented
1) Social-ecological and social-technical systems are tightly interconnected (Levin 2005).2) Without having a continuous and an uninterrupted access to flow of different types of resources and materials, these interconnected systems cannot be or achieve resilient. Therefore, maintaining a resilient access to the flow of these resources is essential for their smooth functioning of these systems and systemic management.3) Social actors can change resilience at many levels and across many scalesthrough their ability to think, self-organise and learn (e.g. the grey layer of cognitive map captures these capacities of social actors). Walker et al. (2004) call this meta-capacity as adaptability, defined as “the capacity of social actors to influence resilience”

435. From problematic dichotomies to interconnectedness (Lehtonen 2018)


Adding to the collection.
436. Sustainable well-being as two coupled goals (Glasser 2018)

437. Transformative learning for a sustainable future (Laininen 2018)
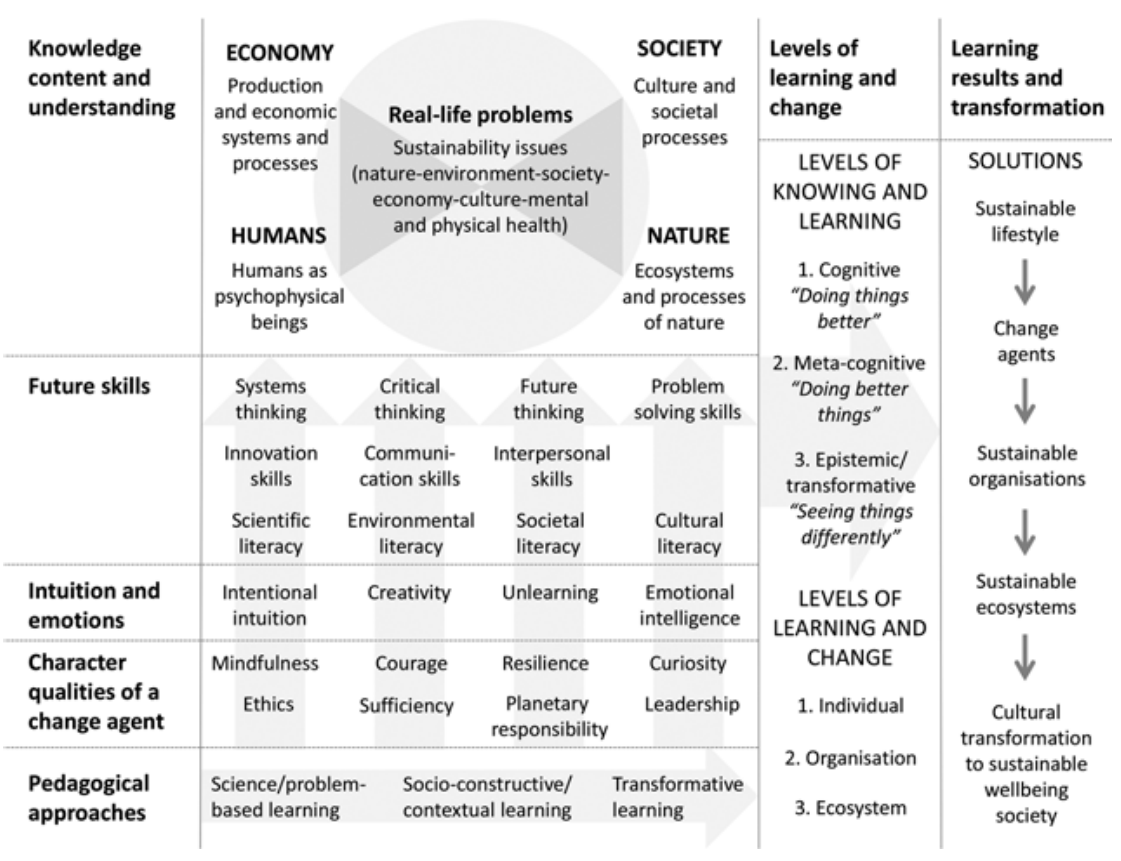
438. Mmm…Cake. (van Kerkhoff 2013)
Sustainable development framework: three tiers of ultimate goals and four layers of enabling goals. Knowledge governance sits at the dashed line between the two base layers.
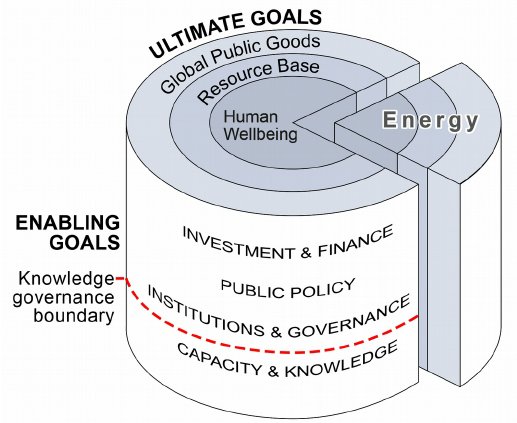
439. The nexus: interlinkages across resources and the SDGs. (Bleischwitz 2018)
The main interlinkages across resource use, such as water being used to produce energy and vice versa. Main resource inputs into the chains of other resources are shown at three main delivery stages, illustrated through different shades of colour: primary production; systems of provision through production, distribution, and consumption; and potential secondary use. The figure describes a five-node approach, but fewer dimensions might be feasible following screening, in order to reduce complexities.

440. Sustainable wellbeing achieved through a Stoic framework. (Whitling 2018)
eudaimonic pursuits …prize virtue (or the progress towards it) over and even at the expense of comfort

441. Intenscope (Kocsis 2014, pdf)
The Intensity Scope…a 2D graphical system is a tool which can be used to highlight and communicate basic consumption–population–sustainability relationships.
To correctly read the plot one should: (1) find the object’s perpendicular projection to the axis in question; and, (2) check the contours of the pyramid to identify the correct intensity proportion (%) for the axis in question.
(Note. Sam doesn’t understand this. He tried really hard).

442. Environmental Livelihood Security (Biggs 2015)
The conceptual framework for investigating environmental livelihood security (ELS) combines concepts of the water–energy–food–climate nexus with the capitals of the sustainable livelihoods framework to achieve a sustainable balance between natural supply and human demand to ensure ‘environmental livelihood security’ (Source: adapted from Biggs et al., 2014).

444. Environmental Livelihood Security as a circle (Biggs 2015)
The notion of Environmental Livelihood Security (ELS) conceptualises the links
between water, energy, food and livelihoods which need balance to achieve a
sustainable system. External influencing factors such as climate change, population
growth, and governance can all impact upon attaining ELS.
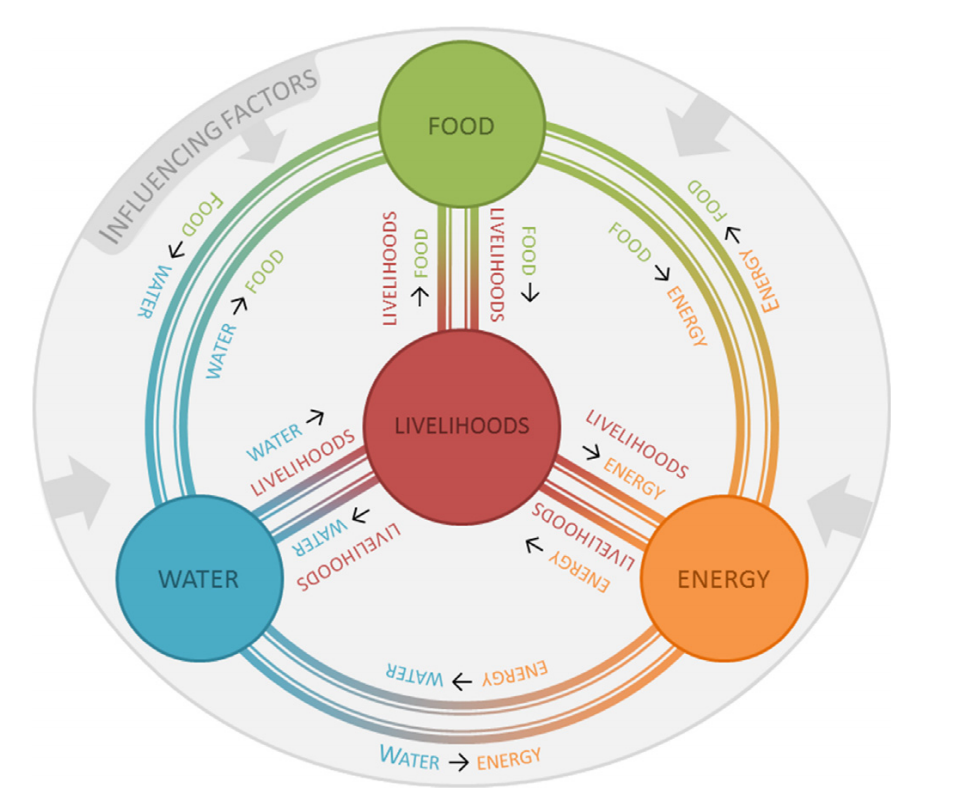
445. White dress (close to be disallowed, is saved by the “effort” dimension making a diagram). (HuffPost 2015)
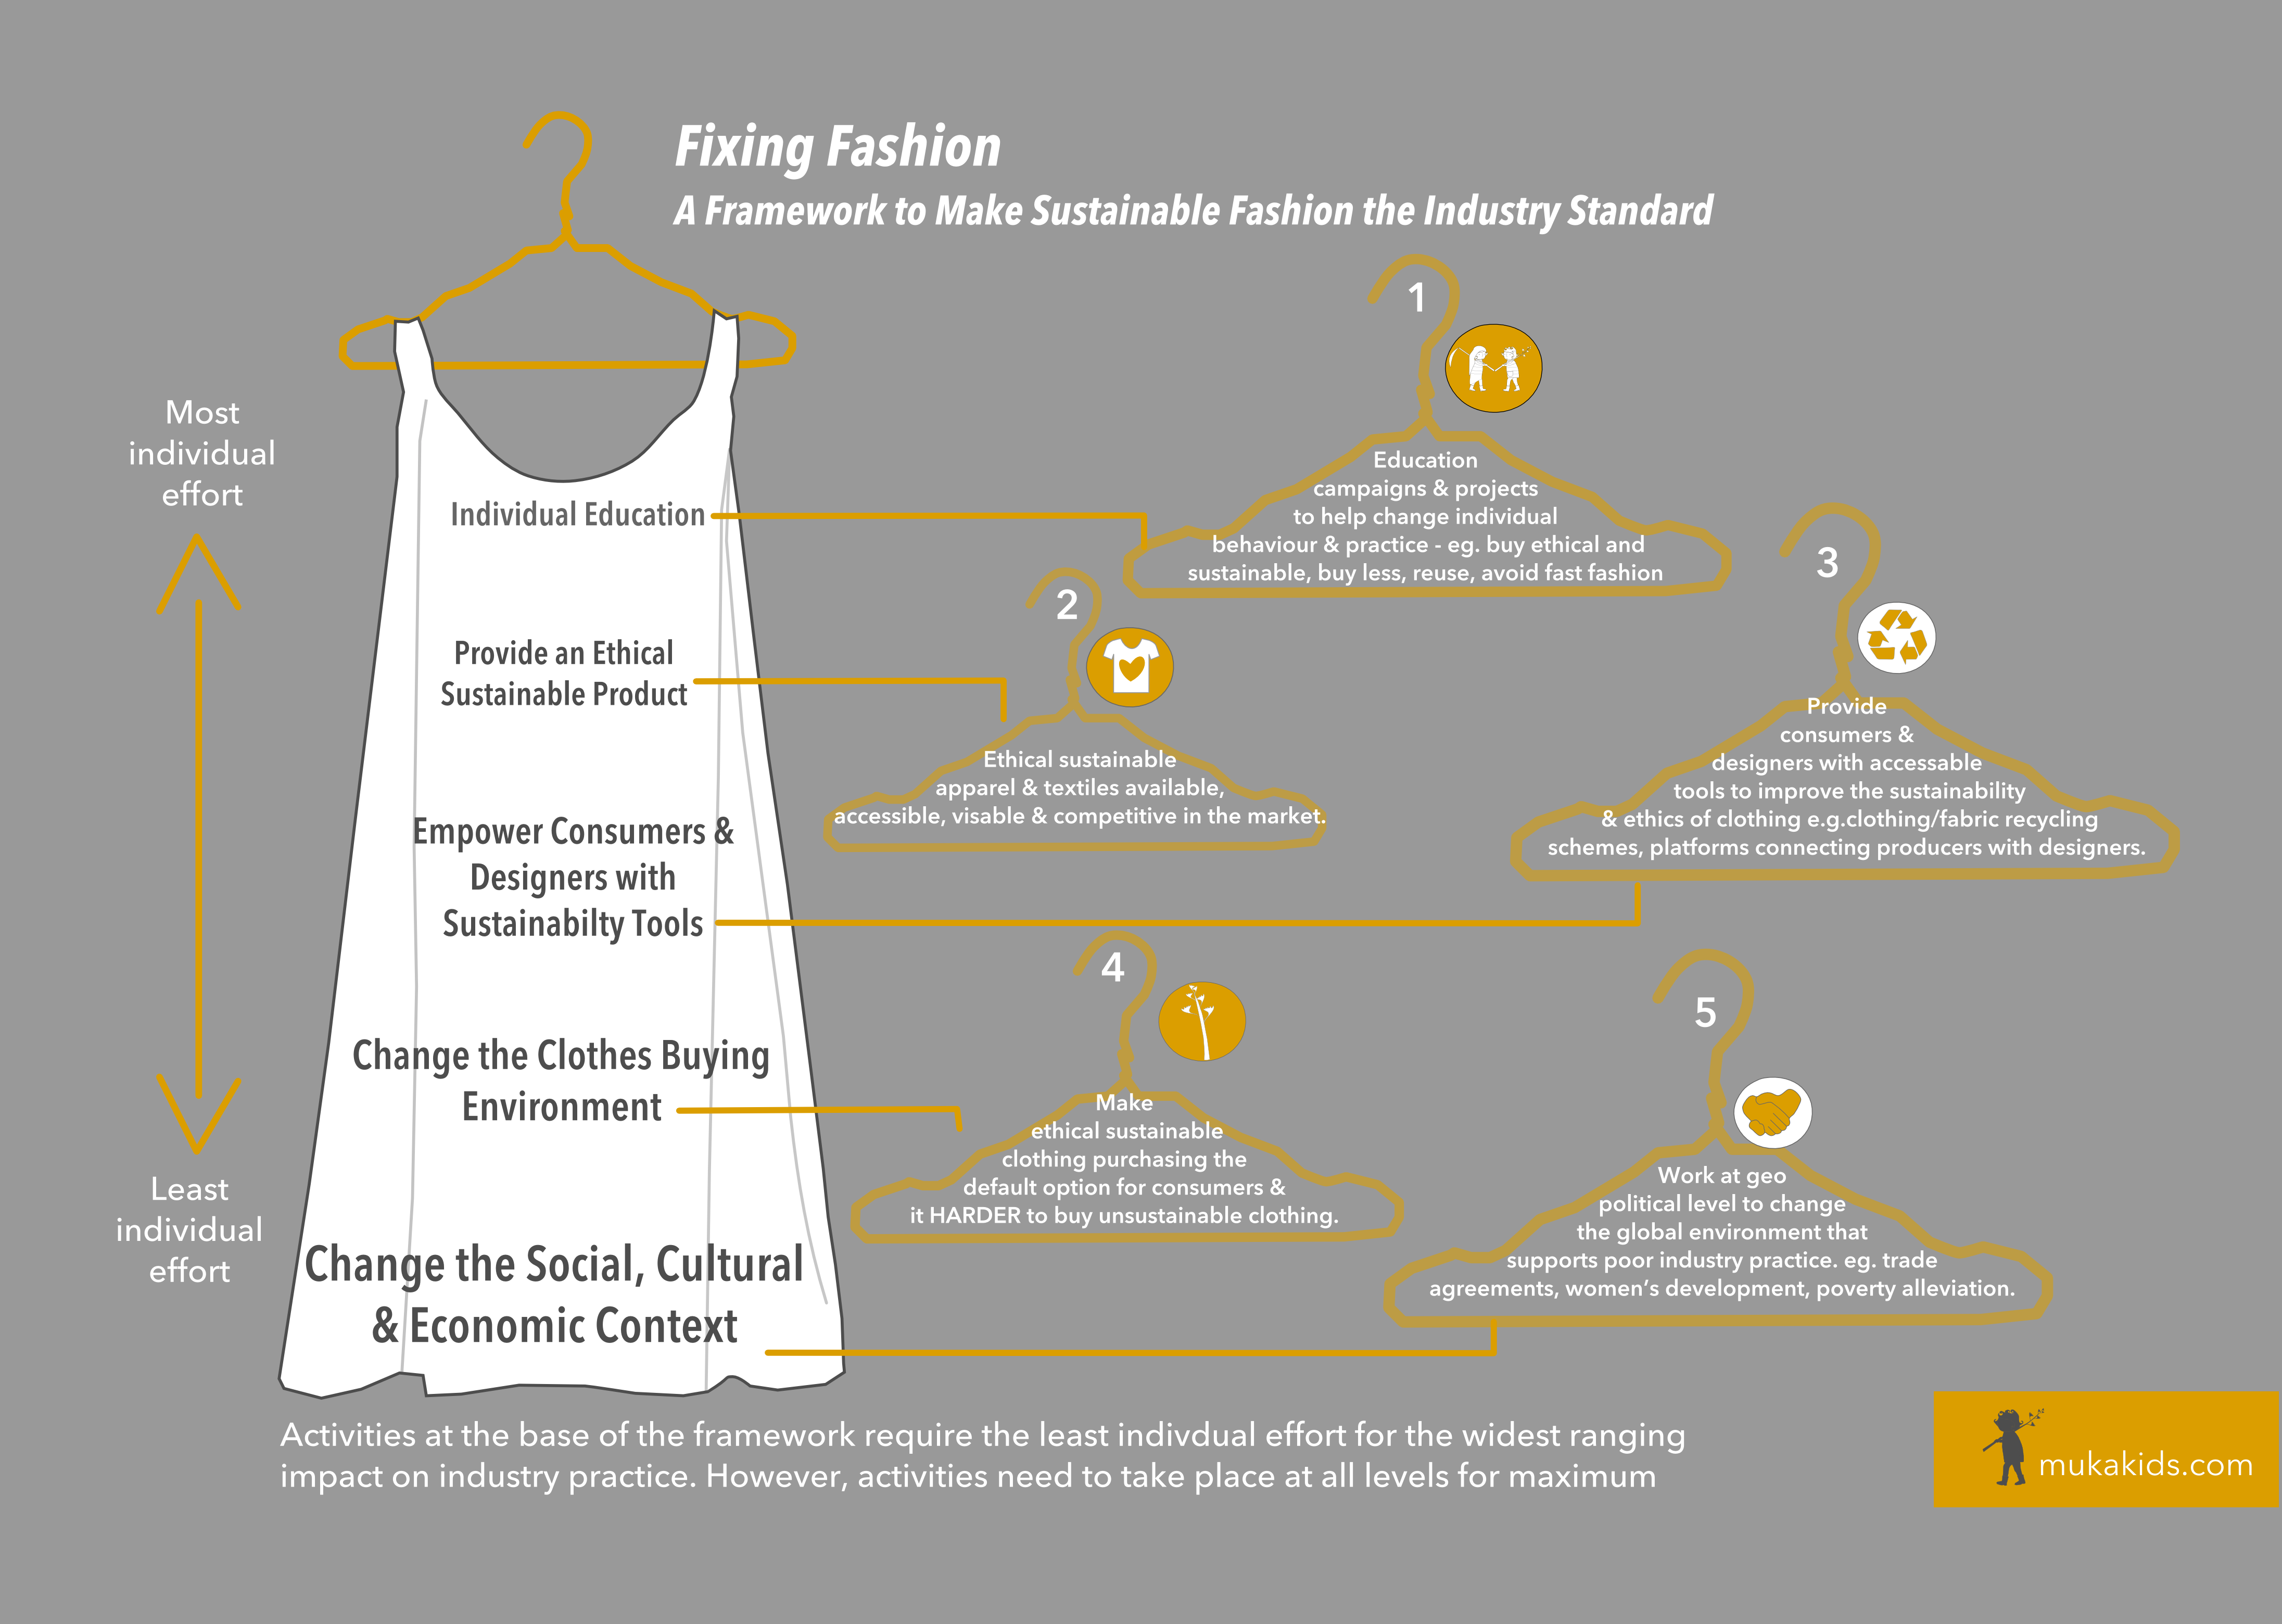
446. Sustainable Value Innovation (Orsato 2009)

(note, no chance of positive benefit for environment)
447. Not that. (avoiding #epicfail) (Lloyd-Pool 2013)

448. Pillars as boundaries (Gardner 1991)
Three of the important boundaries that will shape future agricultural policy emphasizing the few possibilities that may exist that meet universal approval.
Although many production systems may pass the rigors of environmental protection, economic security, and social acceptability individually, few will satisfy all the facets necessary for a successful and sustainable agriculture.

449. Edward Barbier’s Venn diagram (1989) The Concept of Sustainable Economic
Development
One basic analytical approach is to view this process as an interaction among three systems: the biological (and other resource) system (BS), the economic system (ES), and the social system (SS).
Original caption:
Sustainable economic development maximises the goals across
the biological and resource system (BS), the economic system (ES), and the social system (SS), as illustrated by the shaded area. In contrast, conventional development approaches maximize only ES goals, and Marxist economies maximizes only ES and SS goals.
Unlike the literal pillars diagram or the three legged stool,
Barbier’s Venn shows that the three pillars are interlinked, interrelated, and inseparable.
Hence, none of these systems can be sacrificed if sustainability is to be maintained.


451. Turtle (Mino Bimaadziwin Partnership)

452. “Western model” (Kealiikanakaoleohaililani and Giardina 2016) (unfortunately no comparable model given for indigenous sustainability science).
Western, global-scale sustainability is a function of three systems operating at the individual, societal, and global scales, as well as their linkages and solutions to complex problems

453. Menominee Nation Sustainable Development Institute’s Model (via Dockry 2016)
Six dimensions of sustainable development in the College of Menominee Nation Sustainable Development Institute’s Model. Menominee Autochthony (their profound sense of place and tie to the land) would occupy the center of the model and represent the Menominee cultural value that has allowed them to balance the tensions among the six model dimensions. Other communities using the model can identify their own cultural values that would allow them to balance the tensions among model elements

Illustration of tensions among dimensions in the College of Menominee Nation Sustainable Development Institute’s Model. Tensions are represented anywhere the model dimension’s borders touch. An unlimited number of tensions can be illustrated by placing dimensions adjacent to each other.

454. Participatory map from Girringun workshop (Robinson et al. 2016)
Example of participatory map created from a sub-group discussion with
Girringun workshop participants. Each branch reflects a core value that trees
provide the Girringun community (e.g. culture), tree roots reflect the knowledge
partnerships that help sustain these values (e.g. partnerships with scientists), clouds reflect attributes that enable these knowledge partnerships to be successful (e.g. social capital) and rocks on the ground represent attributes that present challenges facing these knowledge partnerships (e.g. one-way knowledge exchange)

455. Sacred Purpose (Rinah Rachel Galper, in Gallery of graphic representations of North American Jewish life by Kenissa Network members)
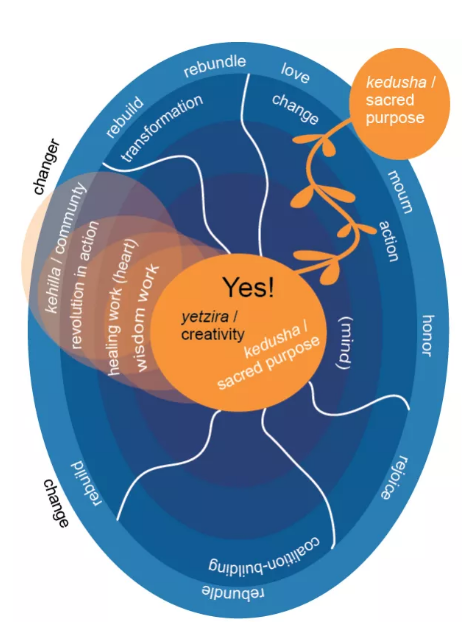
456. Just Transition (Movement Generation Justice & Ecology Project)
Shifting to managing home in concert with the principles of living systems requires aligning three core strategies: building the new, changing the rules, and moving the resources from an extractive to a regenerative economy. All of this must be done in a way that stops the bad and changes the story. Working with the Our Power Campaign, Movement Generation crafted figure 3-4 to illustrate a strategy framework to shift from an extractive economy to regenerative economies. The just transition strategy framework gives a way to understand the underlying threads of the current extractive economy and the envisioned threads weaving regenerative economies together.

457. Mangorewa Kaharoa Te Taumata Trust
![]()
458. Wheel with a hint of a system “Catalyzing A Global Sustainable Economy” (Capital Missions Company and Tipping Point Network)

460. Coviability of Social and Ecological Systems (Barriere et al. 2019)

461. 3Hs of biocultural ethic (Rozzi 2015)
The “3Hs” of the biocultural ethic coupled with the three core components identified for Earth Stewardship: habitat/ Earth , habit/ stewardship , and co-inhabitants/ stewards

462. Triad of human interest (Chisholm 2015)

Ecological praxis: A change of heart and mind reflected in action.
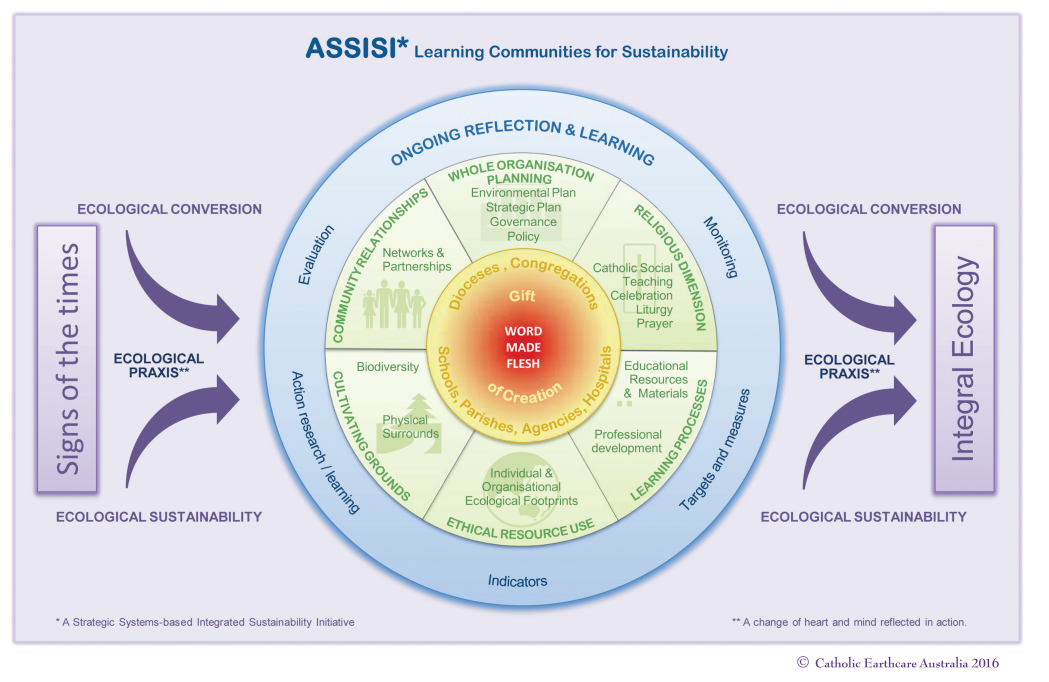
464. Integrated assessment (Lamb 2006)

465. Framework for engineers (Lamb 2006 after Fenner 2006)
Incorporating sustainable development into this traditional framework requires
a move into problem boundaries not normally considered by civil engineers. This move has been considered by Fenner et al with the development of a framework based upon values, processes and constraints that form a questioning approach within an eight point framework.

466. Politics of Wellbeing (“Wellebing as a Compass”. Joshua Malkin, via).

467. Moral compass in High-Climate Change World (Grasso and Tàbara 2019)

468. Moral compass in time, space and recipients of moral concern (Grasso and Tàbara 2019 after Tàbara 2017)
Situating the moral compass in an extended cognitive and normative system of reference to guide the development of transformative solutions and sustainable governance arrangements in HECC worlds

469. Is it a bird? Is it a plane. Yes, it’s a bird. Sustainable Tourism in Picton and the Marlborough Sounds (e-Ko Tours)

470. Sustainable growth through a reinvented sampo yoshi approach (Itochi Corporation, Japan).

471. Conceptual understanding of the construction companies with the spectrum of sustainability concepts (Wilkinson 2012)

472. Sustainability oriented service innovation (Calabrese 2018)

473. S 3-Sustainability as Service Science Model (Wolfson 2012)
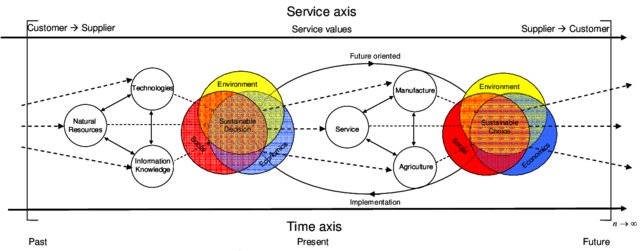
474. Sustainability as a component of resilience (Marchese 2018)
The more sustainable system loses less critical functionality, and recovers quicker in response to economic, environmental, and social disturbances.

475. Common concepts connecting sustainable development and global change to
urban infrastructure resilience (Shaker et al. 2019).

476. Summary of Club of Rome in tetrahedron (Anthony Judge 2018)
Mapping of Come On issues onto 3-tetrahedra compound
(12 vertices=”unsustainable trends”; 18 edges=”strategies”)

477. Leadership (Shriberg and MacDonald 2013)
Figure 1 shows the evolution of leadership theory over time, as well as the recent emergence of environmental leadership. The concept of sustainability embodies a different, more integrative approach to leadership, visually represented as the bridge between environmental and traditional leadership theory. Given the “wicked” nature of sustainability-related problems and solutions, leadership for sustainability is more than the application of traditional leadership theory and environmental leadership to sustainability. Therefore, institutions of higher education have a novel and difficult task to prepare students to become sustainability leaders.

478. Taking the tree’s perspective: “Branching through sustainable supply chain management theories: the tree perspective” (Ahmed et al. 2016)

479. Overlapping wiggles (Manila Water)

480. Circles, plates and pointy cones (Sustainable Urban Planning, George Washington University)
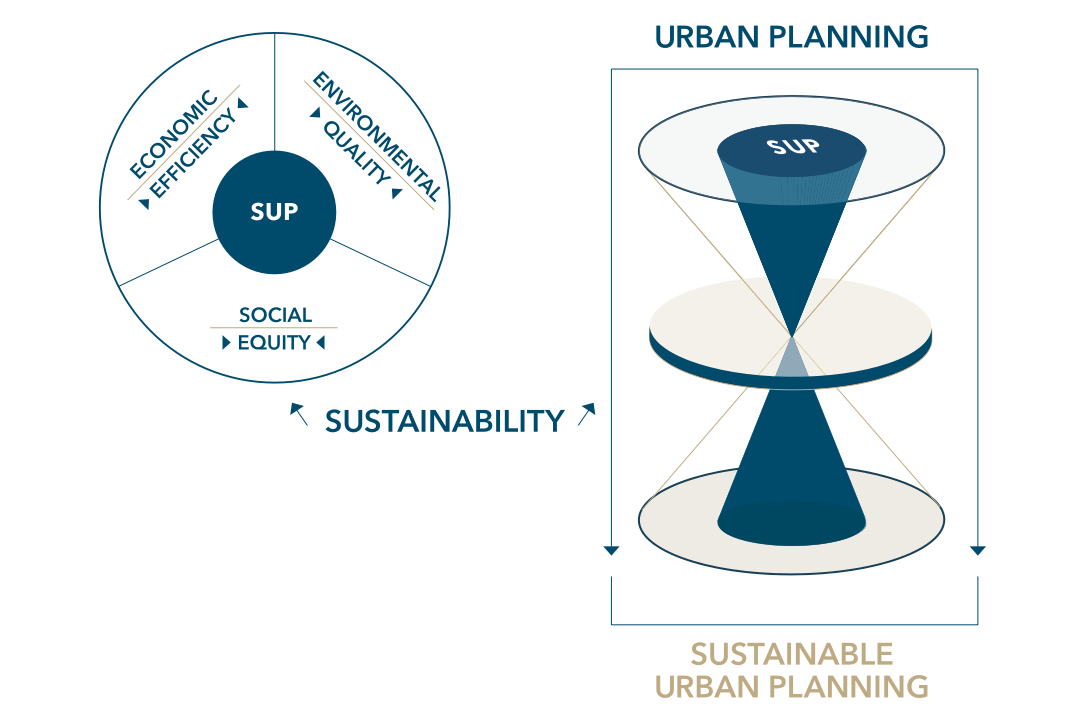
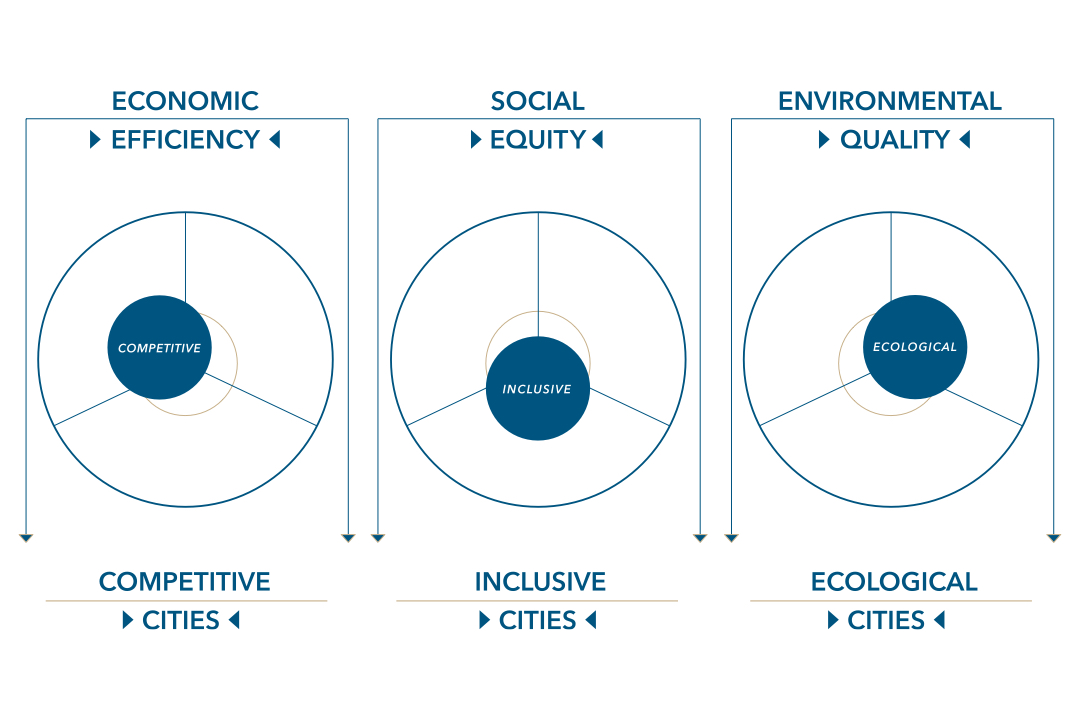
481. How long? (Colocousis et al. 2015)
Social, economic, and ecological dimensions of sustainability as they relate to temporal sustainability. Distance from center indicates the rough likelihood that issues related to each will bear directly on the temporal endurance of socioecological systems

482. Transparency (Tasdemir and Gazo 2018)
True sustainability could only be achieved through full transparency, which requires ultimate collaboration of stakeholders throughout a supply chain. Although focusing solely on intra-organizational (within the walls) sustainability has potential to generate favorable outcomes, in the long-term, sustainable improvement will start to stagnate and inefficiencies will reoccur due to a lack of collaboration and transparency
Ultimate objective should be achieving global level inter-sectoral sustainability through highest possible transparency and collaboration

483. Balancing matrifocal and patrifocal (Lietaer 2019)
All over the world we live by patrifocal (“have”) values and neglect the matrifocal (“give”) side of balance, as we can see in our dealings with education, the elderly, people in need of care and with each other.
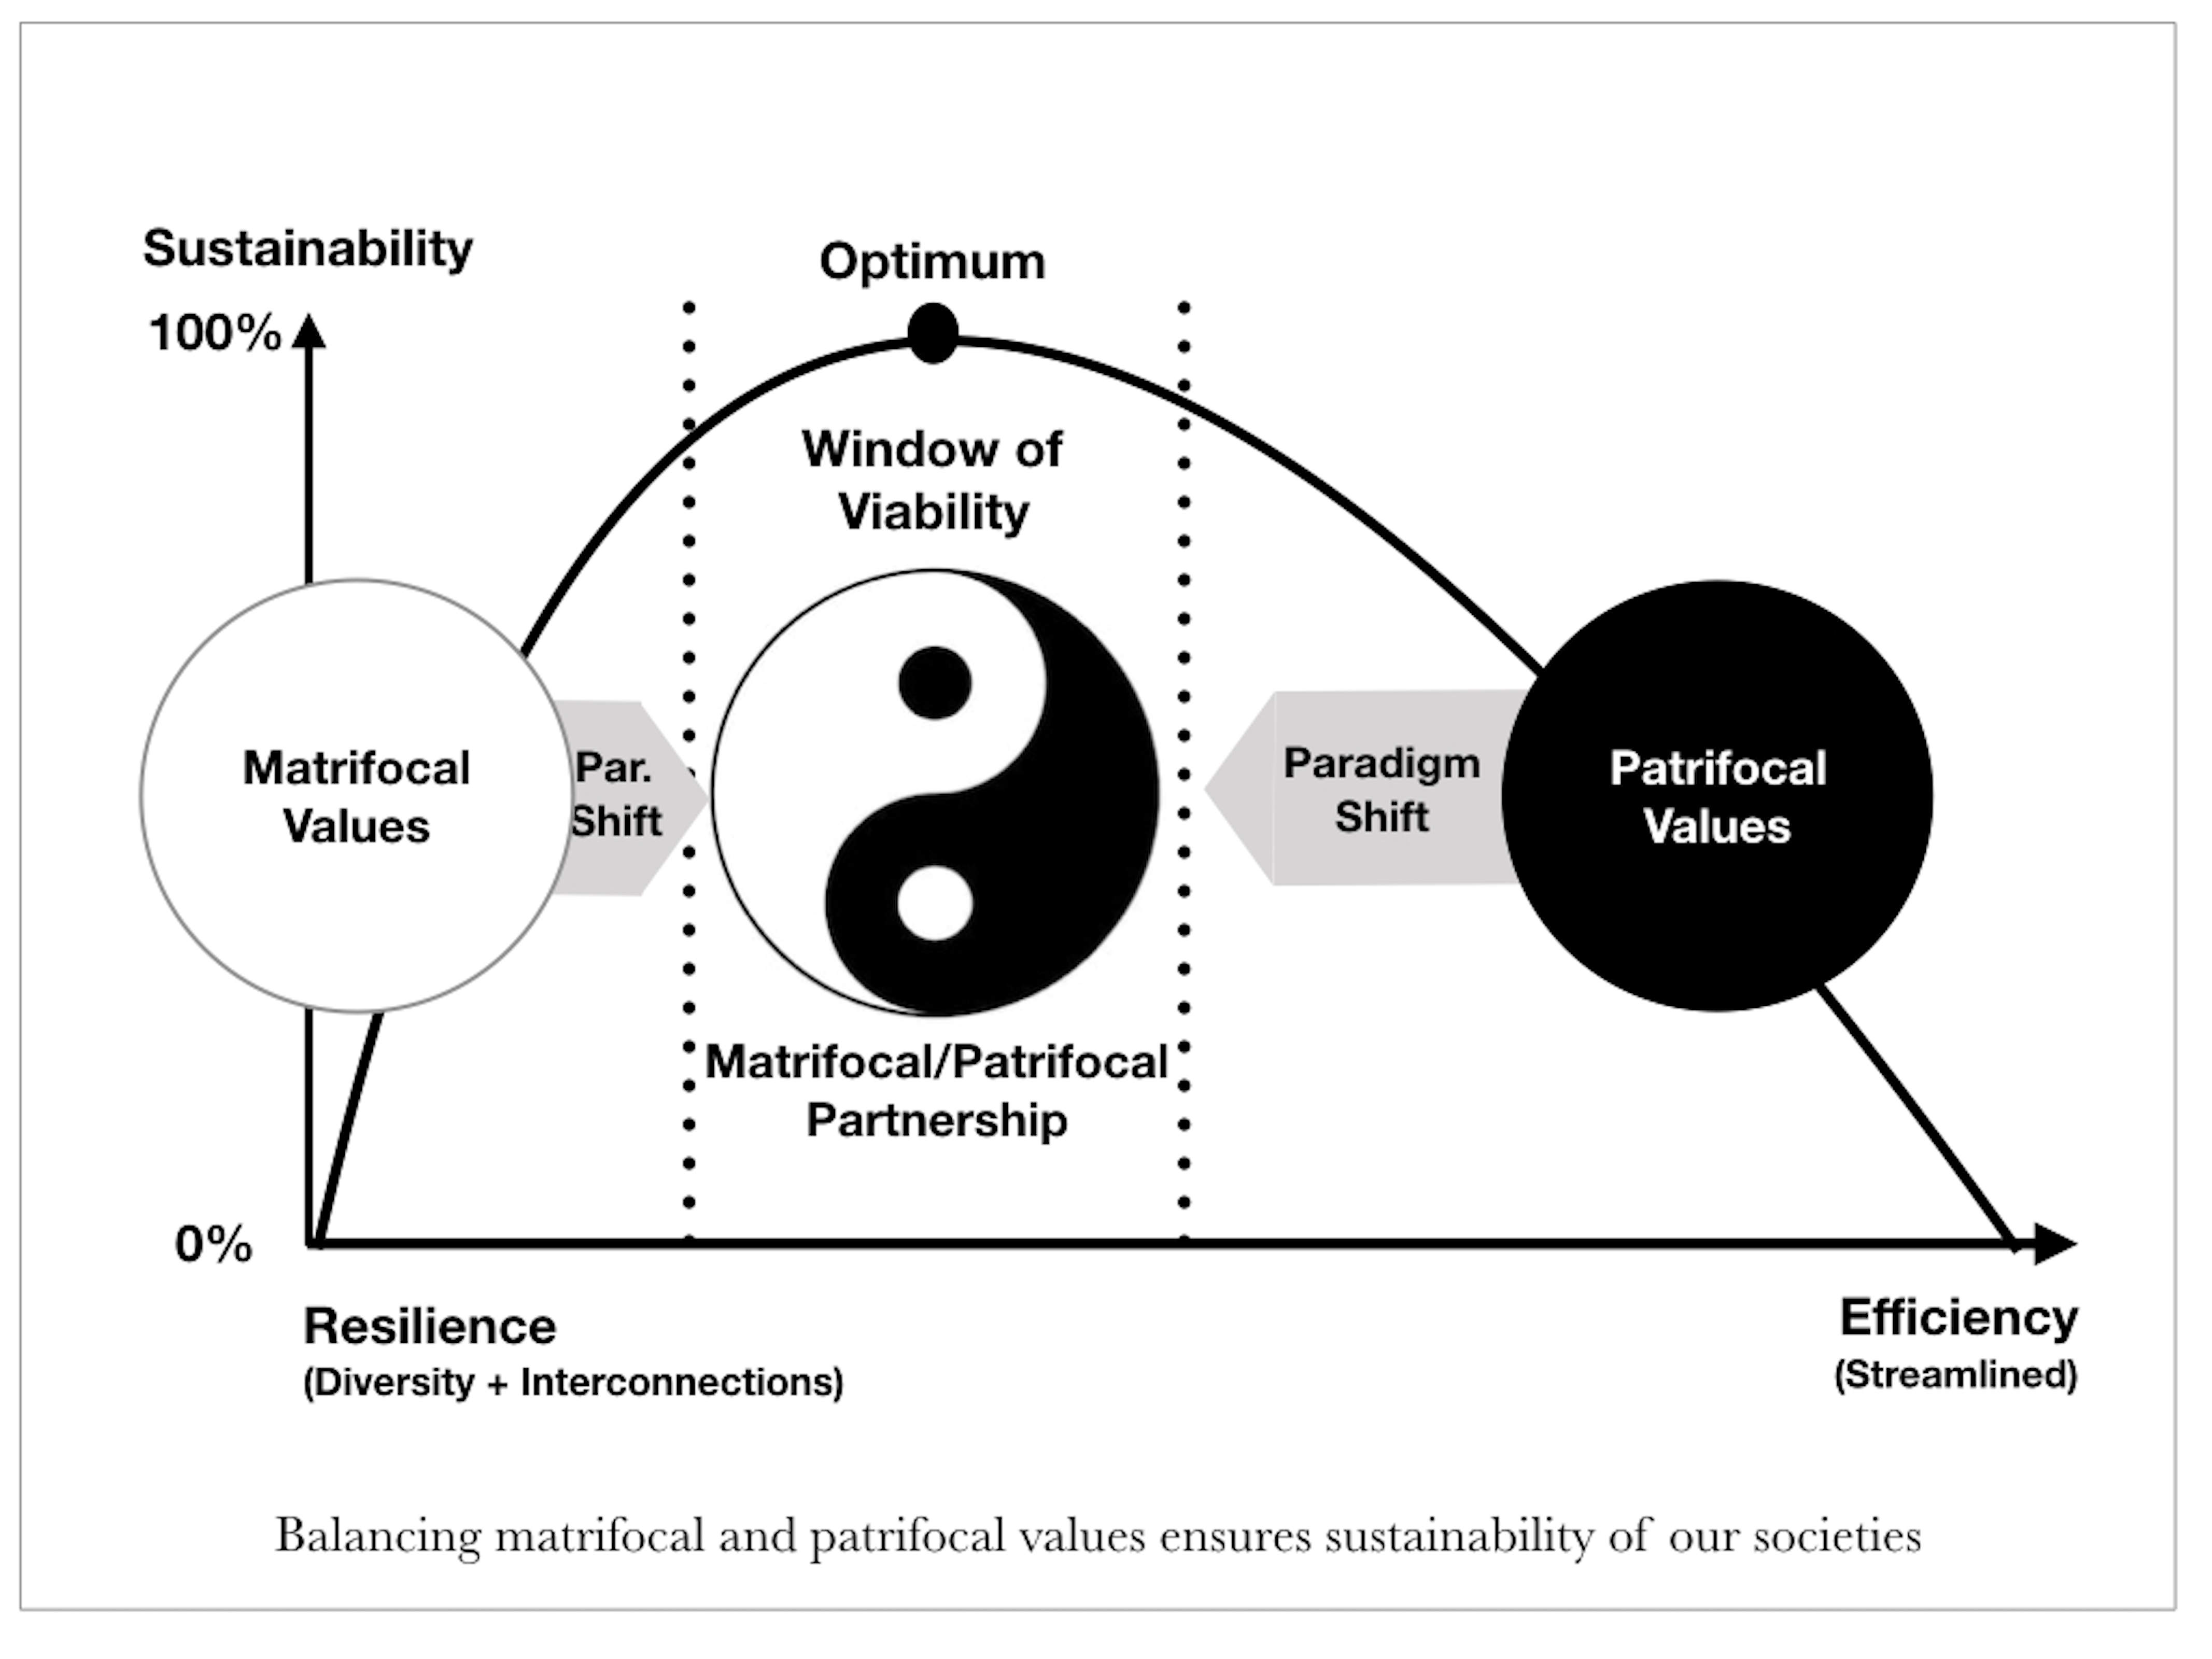
484. Future of business is though a funnel (Aditya Birla Group)
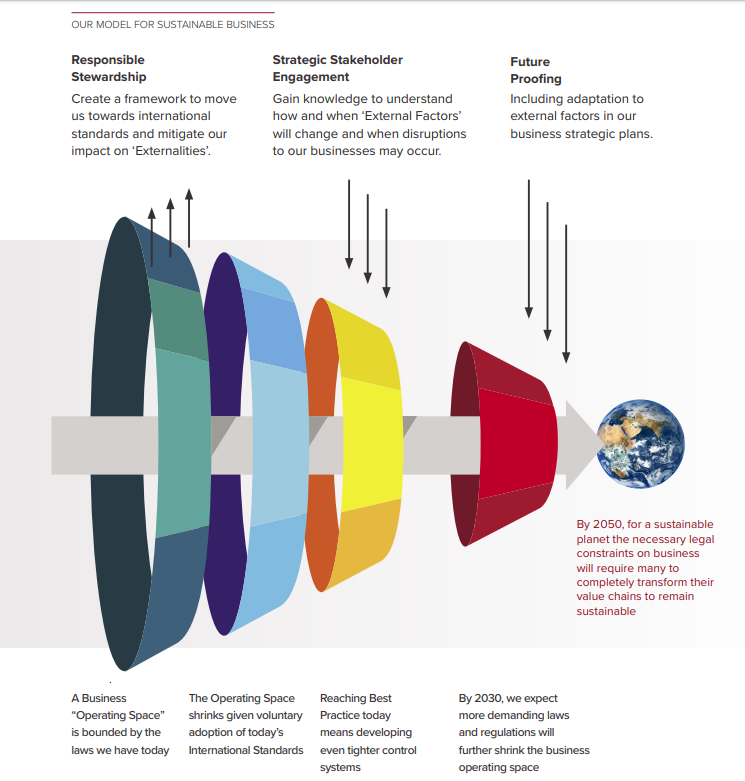
485. Sustainable Livelihoods Framework (Gonsalves and Mohan 2011)

486. Voronoi pattern (Kumar)
Sustainability is an impact network. Today people are alert with resource depletion and energy usage, as they are conscious of their survival, individually and socially. So, when society becomes sustainable the individual will, and vice versa.
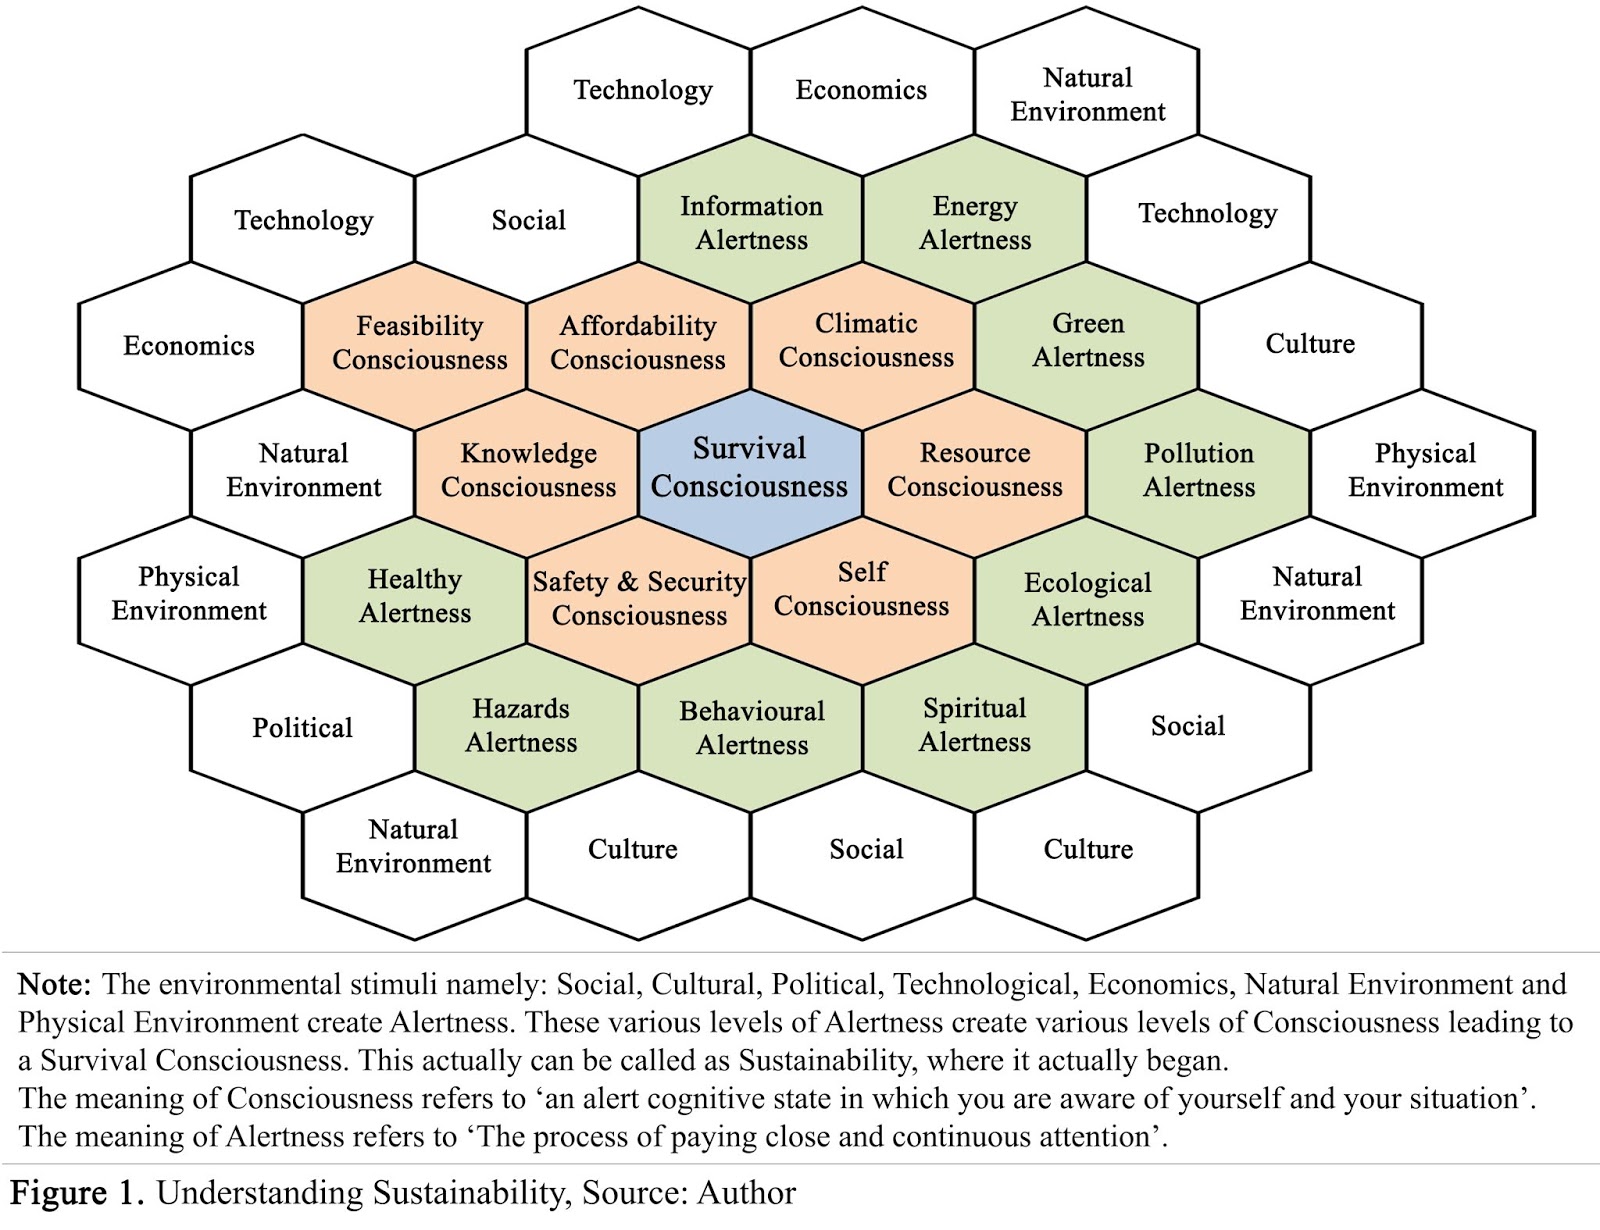
487. Summary of Club of Rome in Borromean rings (Anthony Judge 2018)
The variant is adapted from the logo of the International Mathematical Union. The reasoning behind this choice of logo could be seen as a challenge to any global strategic presentation for humanity. How could the dimensions of the new report be represented succinctly as a challenge — if not a puzzle inviting a collective response?

488. 12 aims of sustainable tourism (UNEP/WTO 2005)

489. Pillars cubed (Envision, UKassel)

490. Sustainable -[ Development (Lele 1991)
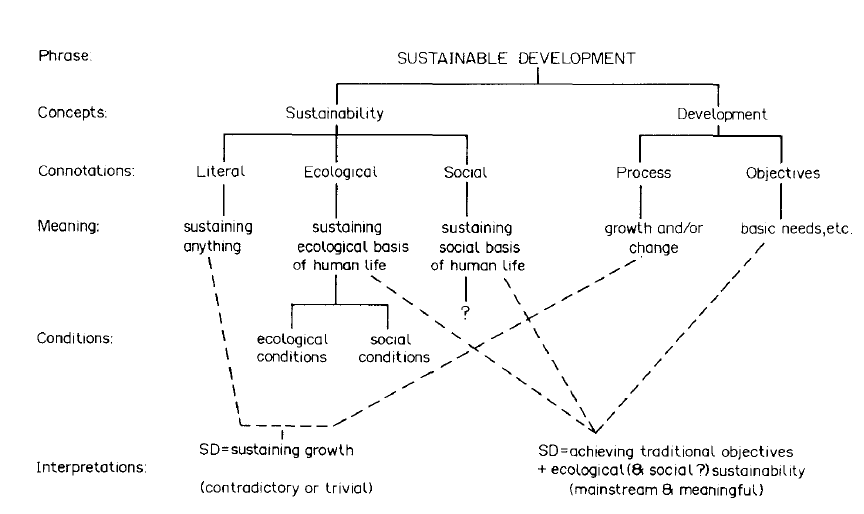
491. Venn pillars (or game controller?) (Dirk Pons, text from Saving Iceland)
To give you some idea as to the factors that need balancing while attempting to achieve economic and environmental sustainability, I have included below a model entitled, ‘The Three Pillars of Sustainability.’ At the top of the pillars’, the conflict of values we are discussing here become abruptly apparent.

492. Positive environments (Corral-Verdugo and Frías-Armenta 2016)
This new representation includes, besides the set of reciprocal relations among the elements of the model, a component of temporal sustainability denoted by the unidirectional influence of factors during the initial time point on the positive environment at a subsequent time. Therefore, this final model broadens the description of the series of events and interrelations produced in a positive environment and extends it to various points in time. Double arrows indicate the reciprocal interactions between factors (identified as circles). According to this representation, a PE, at initial time point ‘‘a’’ is able to promote, both, human well-being and the practice of sustainable (i.e., pro-social and pro-environmental) behaviors while, in reciprocity, human well-being and sustainable behaviors contribute to the integrity of a PE. Sustainable behaviors also affect and are instigated by a conserved environment and the experience of well-being. The one-sided arrows departing from sustainable behavior, human well-being, and environmental conservation, pointing to a positive environment in a subsequent time ‘‘b,’’ indicate the flow of time and the maintenance of the PE.

493. Green pedagogy (University College for Environmental and Agrarian Pedagogy)

494. Pareto’s the best? (Mattson 2019)
The sustainability space, defined by the three pillars of sustainable design; economic, environmental, and social sustainability. The shape within the space, represents the set of feasible design alternatives, and the region shaded darkly represents the optimal tradeoff surface, or more formally the Pareto frontier. We seek Pareto solutions because they represent the best that can be feasibly achieved.

495. Ecosocialist shell (Quincy Saul 2018)

496. Rocket of dynamic sustainability (Bostrom 2014)
Instead of thinking about sustainability as is commonly known, as this static concept that has a stable state that we should try to approximate, where we use up no more resources than are regenerated by the natural environment, we need, I think, to think about sustainability in dynamical terms, where instead of reaching a state, we try to enter and stay on a trajectory that is indefinitely sustainable in the sense that we can contain it to travel on that trajectory indefinitely and it leads in a good direction.
An analogy here would be if you have a rocket. One stable state for a rocket is on the launch pad: it can stand there for a long time. Another stable state is if it’s up in space, it can continue to travel for an even longer time, perhaps, if it doesn’t rust and stuff. But in mid-air, you have this unstable system. I think that’s where humanity is now: we’re in mid-air. The static sustainability concept suggests that we should reduce our fuel consumption to the minimum that just enables us to hover there. Thus, maybe prolong the duration in which we could stay in our current situation, but what we perhaps instead should do is maximize the fuel consumption so that we have enough thrust to reach escape velocity.
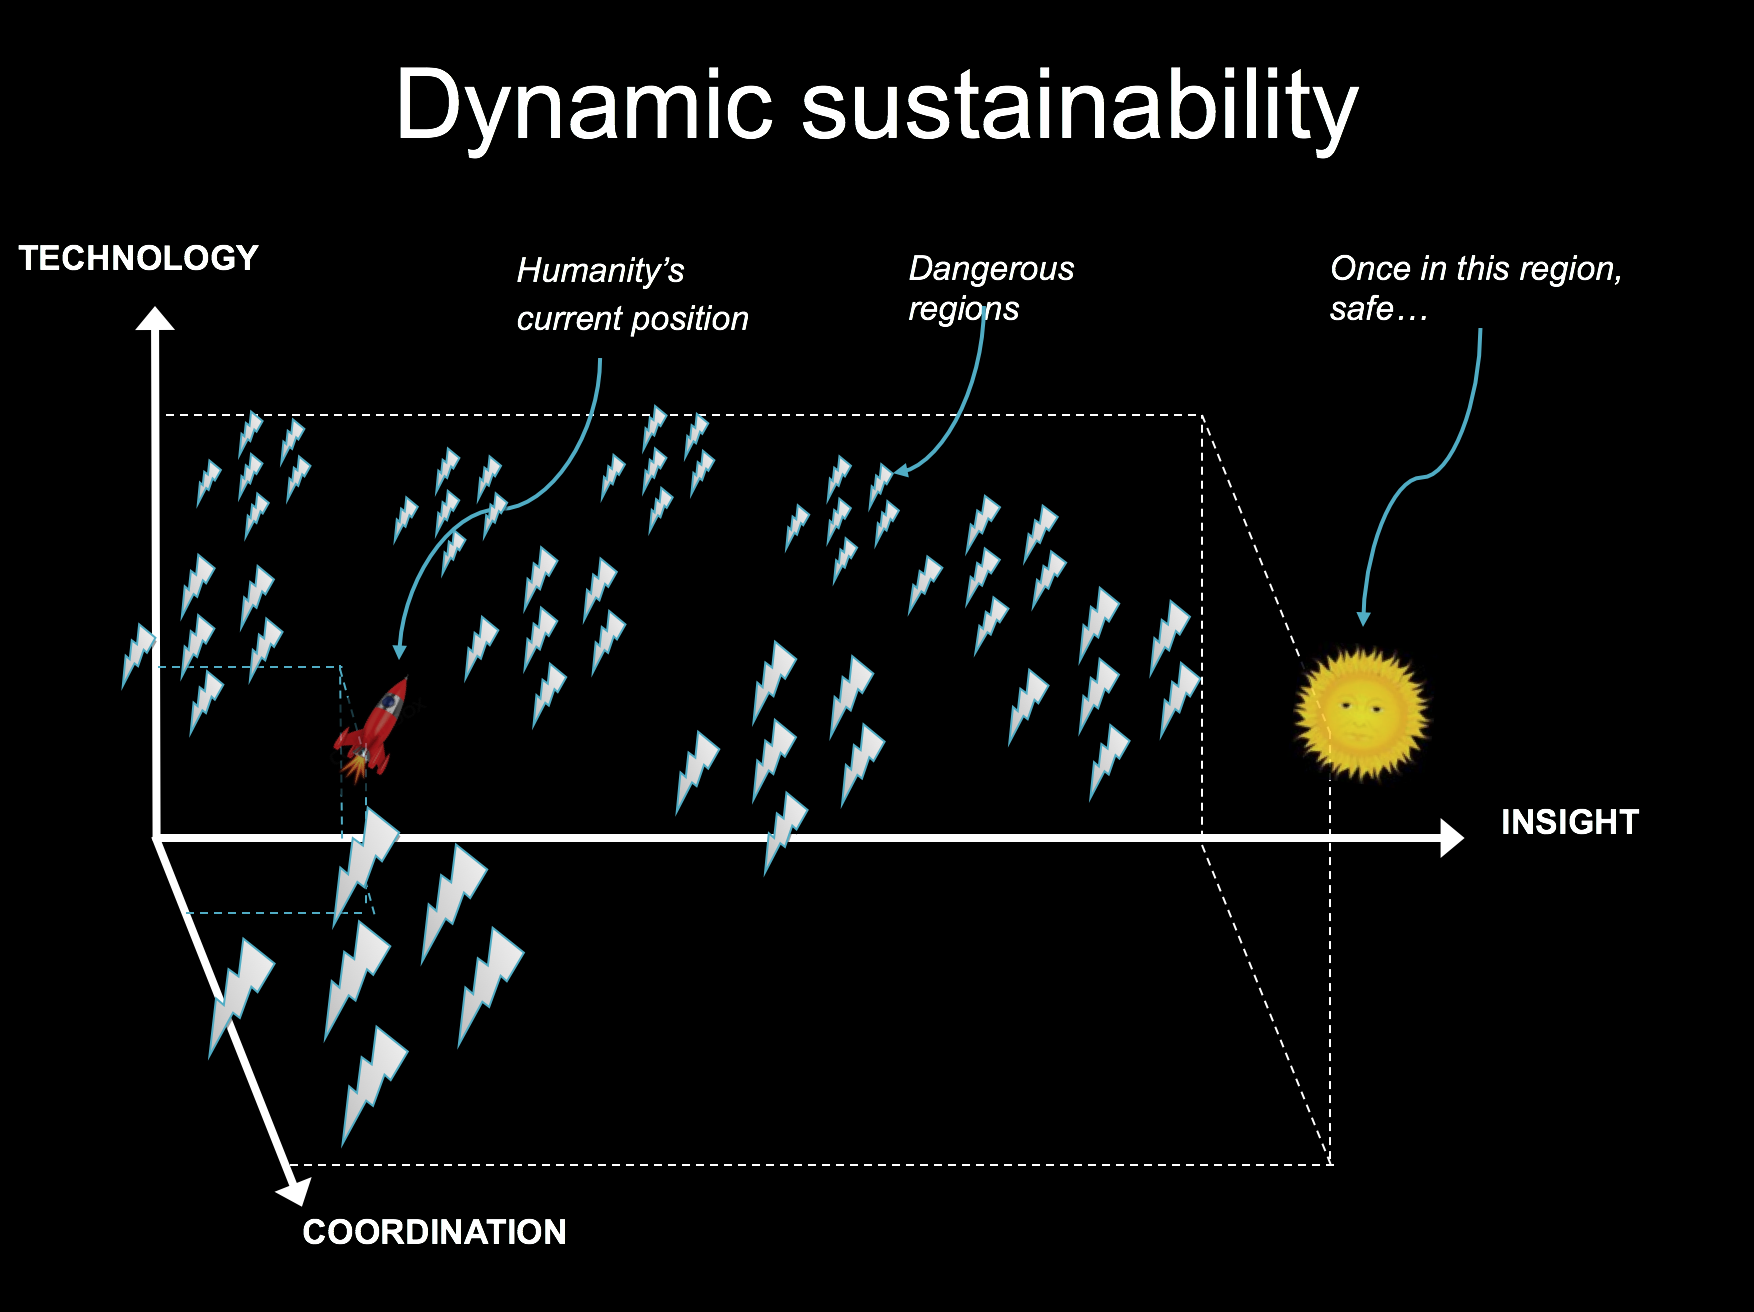
497. Framework for ecojustice education (Bentley 2010)
I offer a concept map in Figure 1 of this proposed framework for ecojustice education. The graphic illustrates the foundations of epistemology on the one corner of the triangle
and of our situated ecosystem context on the other, both focused on the apex, the teaching-action component, which is the outcome of a cultural-ecological analysis process.I have labeled the bottom left corner of the graphic “The Sacred Unknowable” because Martusewicz, Lupinacci, and Schnakenberg emphasize such a space in their argument that scientific knowledge will be incomplete. This corner could just has well have been labeled, “The Nature of Science” (NOS). The NOS, properly understood, includes the proposition that scientific knowledge is ultimately limited.

498. Cake-based systems model (Halcrow via Pearce et al. 2012)
This turns sustainability from a static concept into one that involves evolution and adaptation. The importance of time and scale is that it describes the dynamic nature of urbanism. Change is constant in urban areas and the impact can be interpreted very differently if viewed across different time-scales and different physical areas of influence. Bureau Urbanisme
499. I know an old elephant who swallowed a tuna. (Webster 2018)
There is a well-known folk tale about six blind men who go to see an elephant. Each man touches a different part of the animal, so each believes the elephant to be a different type of creature. Rather than pooling their knowledge to create a complete picture, they argue, and, as John Godfrey Saxe puts it, “Though each was partially in the right…all were in the wrong.” This fable is now a cliché because humans so often get embroiled in ideological disputes, arguing not over facts per se, but over interpretations of facts as shaped by their own values, preferences, and prior beliefs. Science is supposed to settle disputes over the elephant, but for complex socioecological systems like fisheries, we are asking the blind men to describe a whole zoo—or perhaps an aquarium—with its human visitors and caretakers as well, a difficult task even for those who are willing to cross ideological or disciplinary divides.
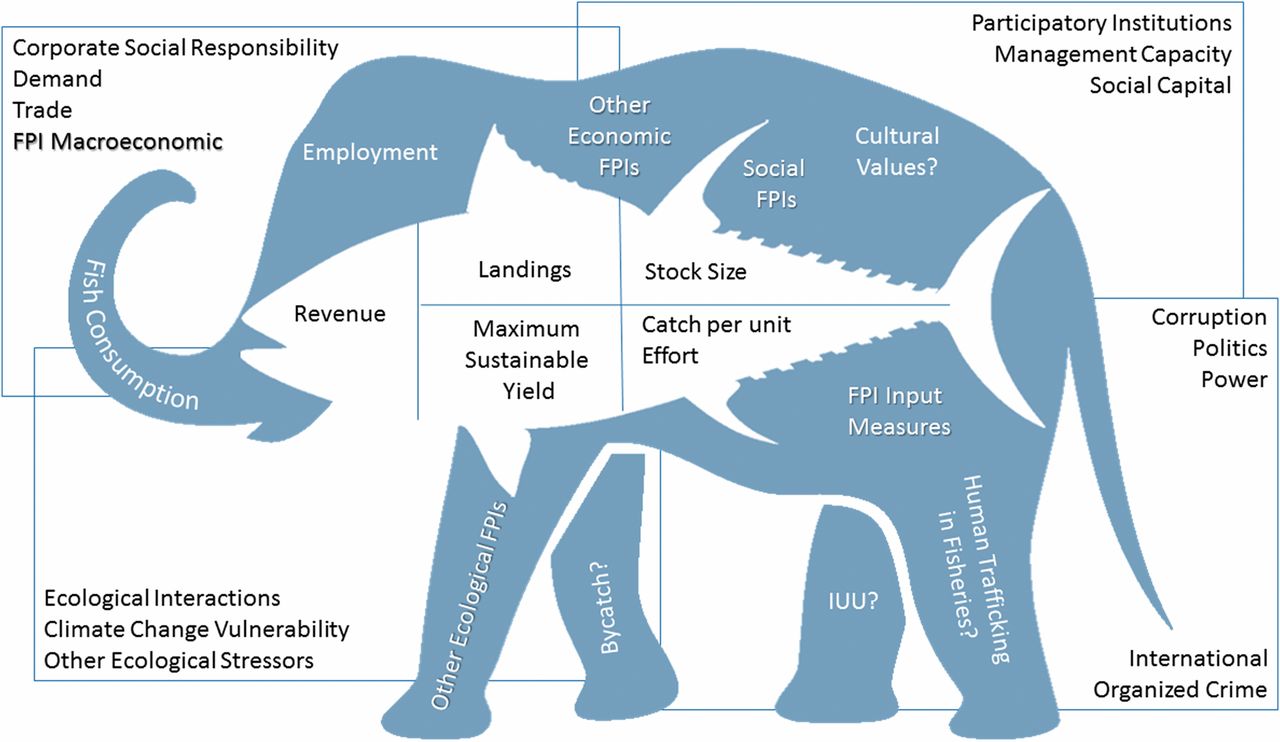
500. We may have just seen the tip of the iceberg (Murray 2019)

501. Back to the future (Pitcher 2005)
Diagram illustrating the ‘Back-to-the-Future’ concept covering the restoration of past ecosystems. Triangles at left represent a series of ecosystem models, constructed at appropriate past times, where vertex angle is inversely related and height directly related to biodiversity and internal connectance. Time lines of some representative species in the models are indicated, where size of the boxes represent relative abundance and solid circles represent local extinctions. Sources of information for constructing and tuning the ecosystem models are illustrated by symbols for historical documents (paper sheet symbol), data archives (tall data table symbol), archaeological data (trowel), the traditional environmental knowledge of indigenous Peoples (open balloons) and local environmental knowledge (solid balloons). Alternative future ecosystems, restored ‘Lost Valleys’, taken as alternative policy goals, are drawn to the right.

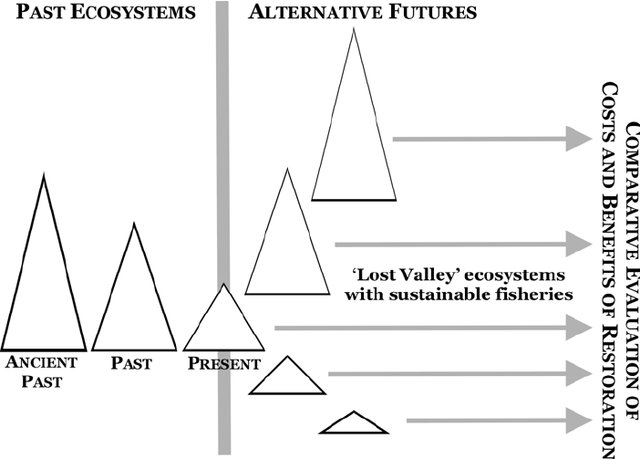
502. Environmentally oriented anti-consumption (EOA García-de-Frutos 2018)
Each pentagon can be subdivided into squares and triangles: above the curved line, squares denote areas of concern approached from an anti-consumption perspective;
under the curved line, triangles represent areas of concern approached from a consumption perspective.A more strict delimitation of EOA includes only those behaviors that imply the reduction, avoidance, or rejection of consumption for environmental considerations (depicted by the green box located in the upper part of the environmental area of concern in Fig. 1).

503. Sustainability (narrowly defined as efficiency) and resilience (Elmqvist et al. 2019)
The relationship between sustainability (narrowly defined as increased efficiency) and general resilience. a–c, The main drivers/outcomes of different combinations of resilience and sustainability thinking. Examples from the energy sector could be: large-scale carbon-capture technology (a), individual distributed solar technology connected in large regional grids (b) and no-grid individual household renewable energy sources (c).

504. Interlinkages between sustainability, resilience and transformations (Elmqvist et al. 2019)
The notion of ‘directed transformations’ ((i) in Fig. 2) represents proactive actions that are dependent on some degree of system resilience to buffer effects of external disturbances, experimentation, mistakes and errors, that is, capacity to deal with uncertainties. It could also be represented by urban challenges where strong path-dependencies and investments in infrastructure to fulfl one function have created a lock-in situation lasting decades to centuries. Transformations in such cases represent how inventions of new functions of existing infrastructure are made and implemented to meet new demands (compare with urban tinkering approaches). Transformations typically involve changes in features like power relations, resource flows, meaning and values, roles and routines—and the interactions between them. A key to achieving sustainability is that these transformations also involve a fundamental shift in human environmental interactions and feedbacks. Such transformations include not only changes in landscape but also changes in the use and function of abandoned infrastructures, creating new urban economies and new urban flows of people and services.
‘Abrupt transformation’ ((ii) in Fig. 2) is much more fundamental and involves maintaining a function (for example, transport and mobility) but shifting structures (for example, from a ground street-based transport system to a cable-car or
air-based system). These more fundamental changes are often influenced by and could themselves influence drivers and connections at local, regional and global scales. Social innovation is demonstrated to play an important role in abrupt
transformations by showing alternative uses and configurations or reconfigurations of structures for maintaining a function or service in a system.

505. Transformative Sustainability Learning Framework (Palma 2014, via Palma 2019)

506. Underground map (via @TheUNTimes @zelfstudie)
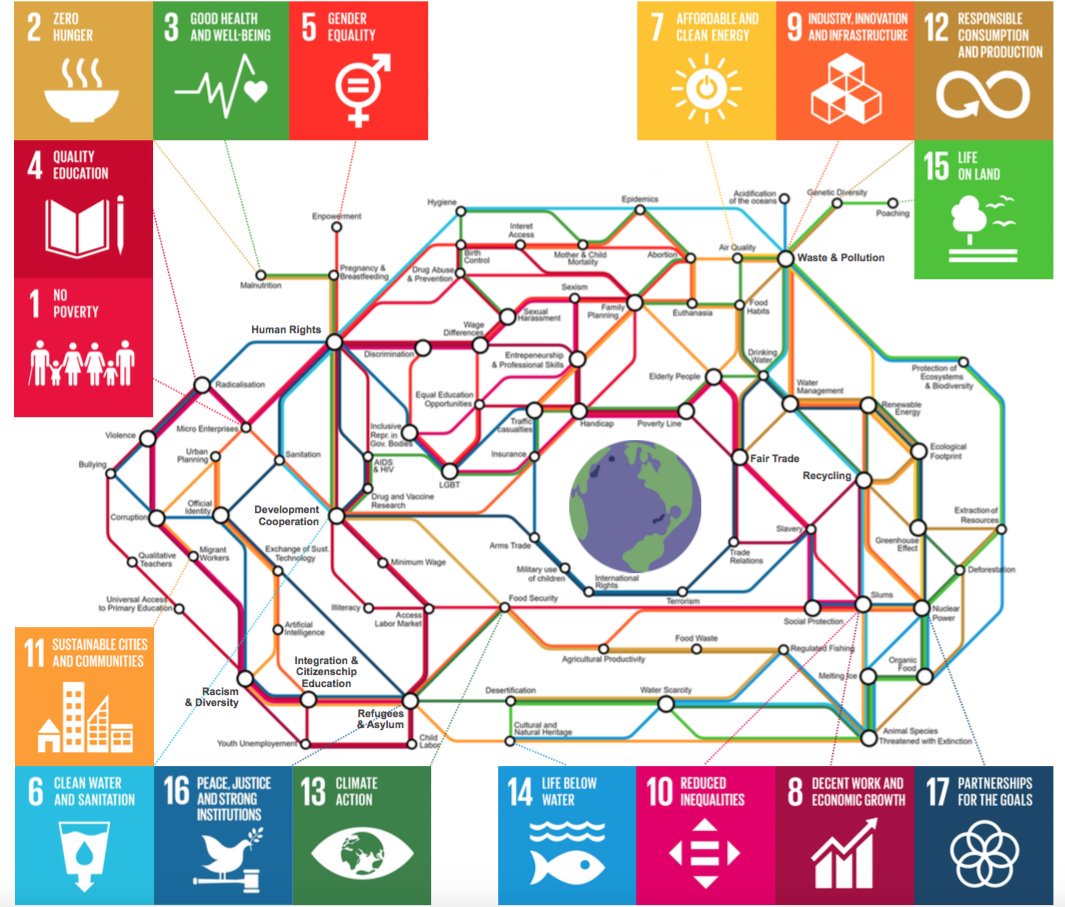
507. Human dimensions (of mountain development) (Flint 2016)

508. Integrated paradigms (Flint 2016)
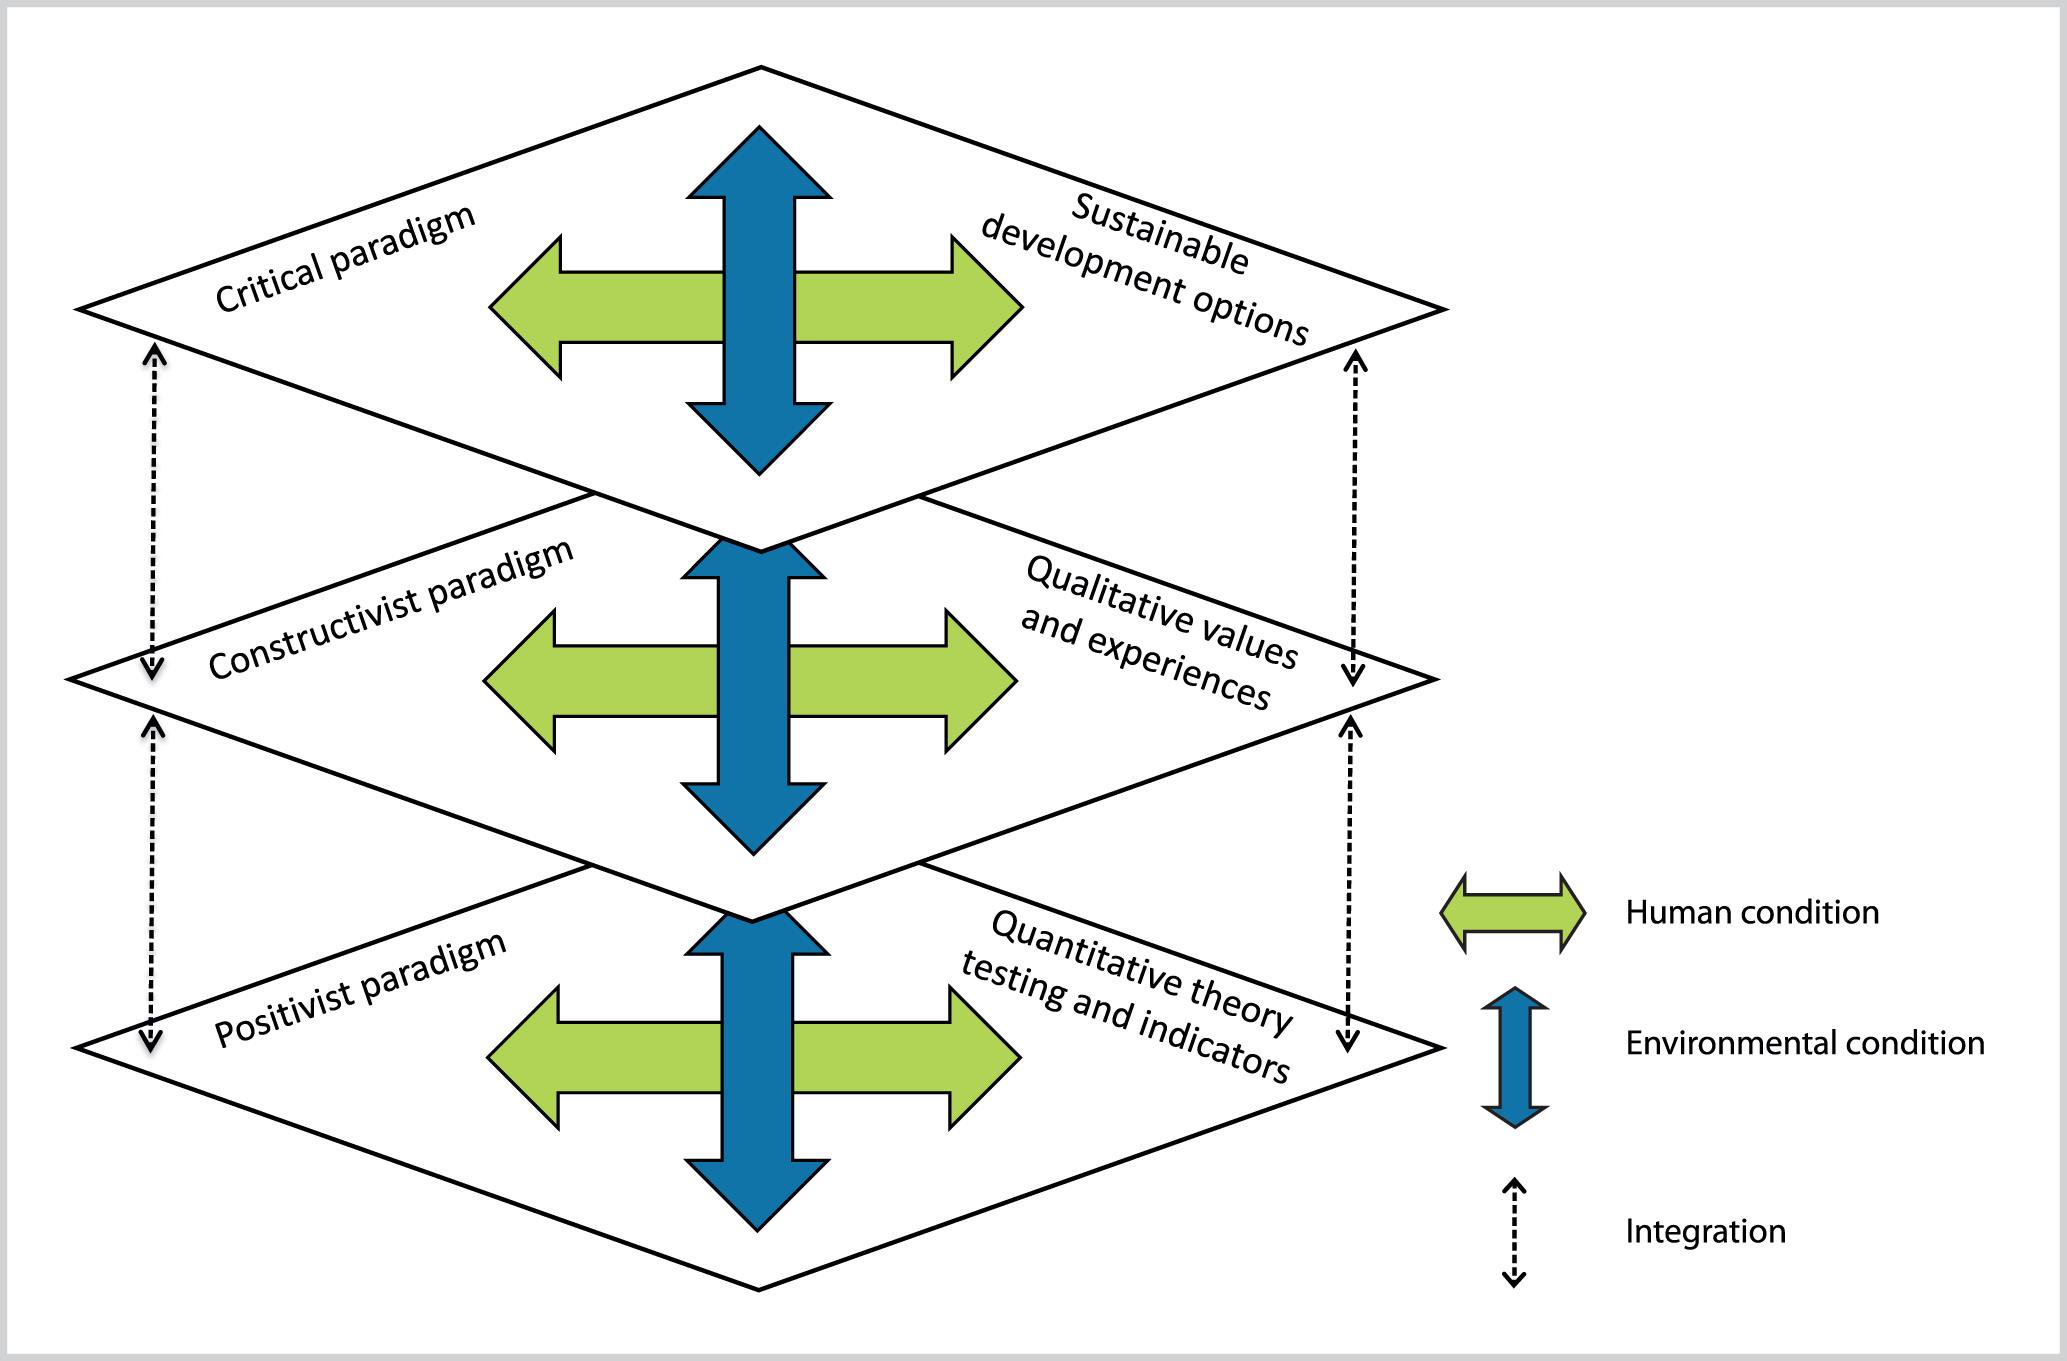
509. Different worldviews result in different P ranking (Boonen 2012)
One way to analyze different worldviews is by dividing them by focusing either on their ontological status (reductionism versus holism) or on the epistemological status (subjective versus objective). Combining these two gives us four different worldviews: personal-egocentric (subjective-reductionist), culturalsocial (subjective-holistic), ecological (objective-holistic) and technical (objective-reductionist). For each of those four worldviews, a 3P-ranking can be made.

510. Multi-level, multi-system of sustainability management (Starik and Kanashiro 2013)
Uncovering and Integrating the Nearly Obvious
A multi-level, multi-system perspective of a proto-theory of sustainability management. Note. Systems of individuals, organizations, and societies are comprised of and are embedded in ecosystems. Such systems include humans and nonhumans (i.e., plants, animals, microbial organisms, and all forms of life). Feedback loops between and within systems have a focus on human long-term social, economic, and environmental needs. Policies prescribe integrated solutions to urgently address environmental and socioeconomic challenges.
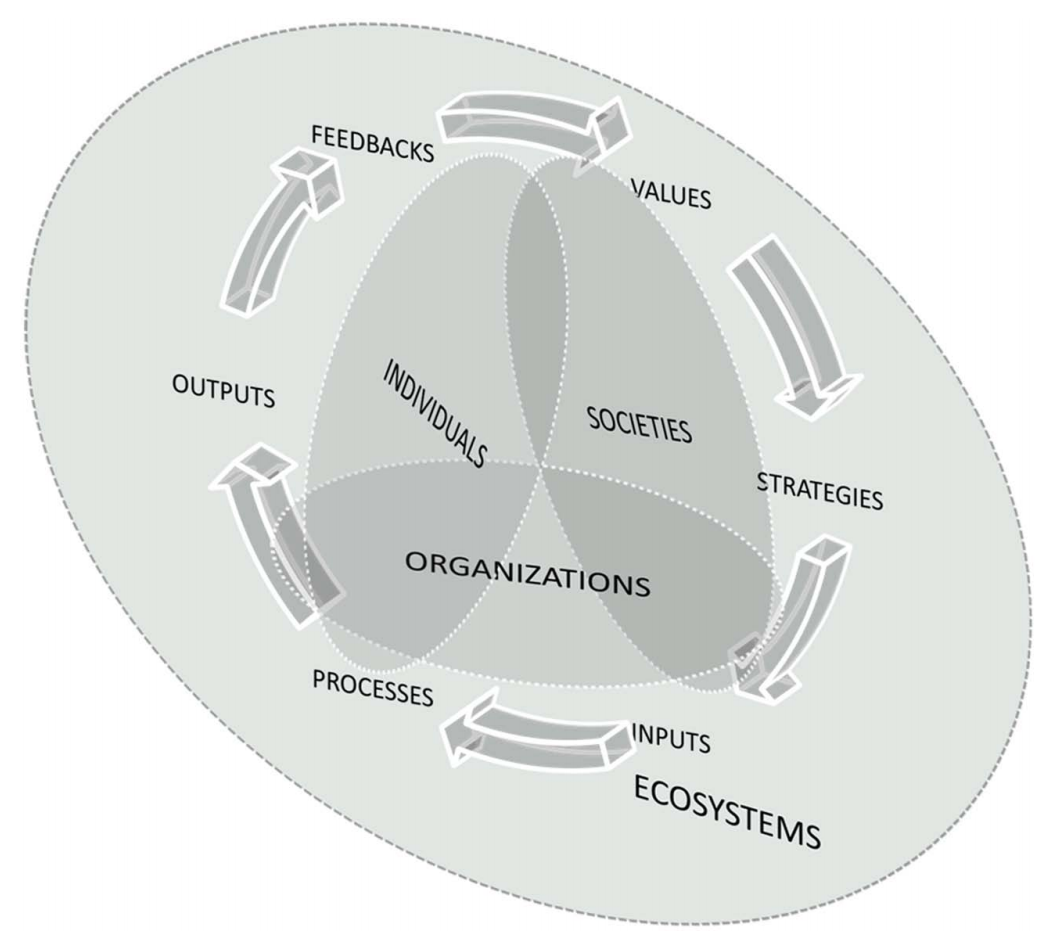
511. Eight-theme framework of sustainability science (Fang 2018)
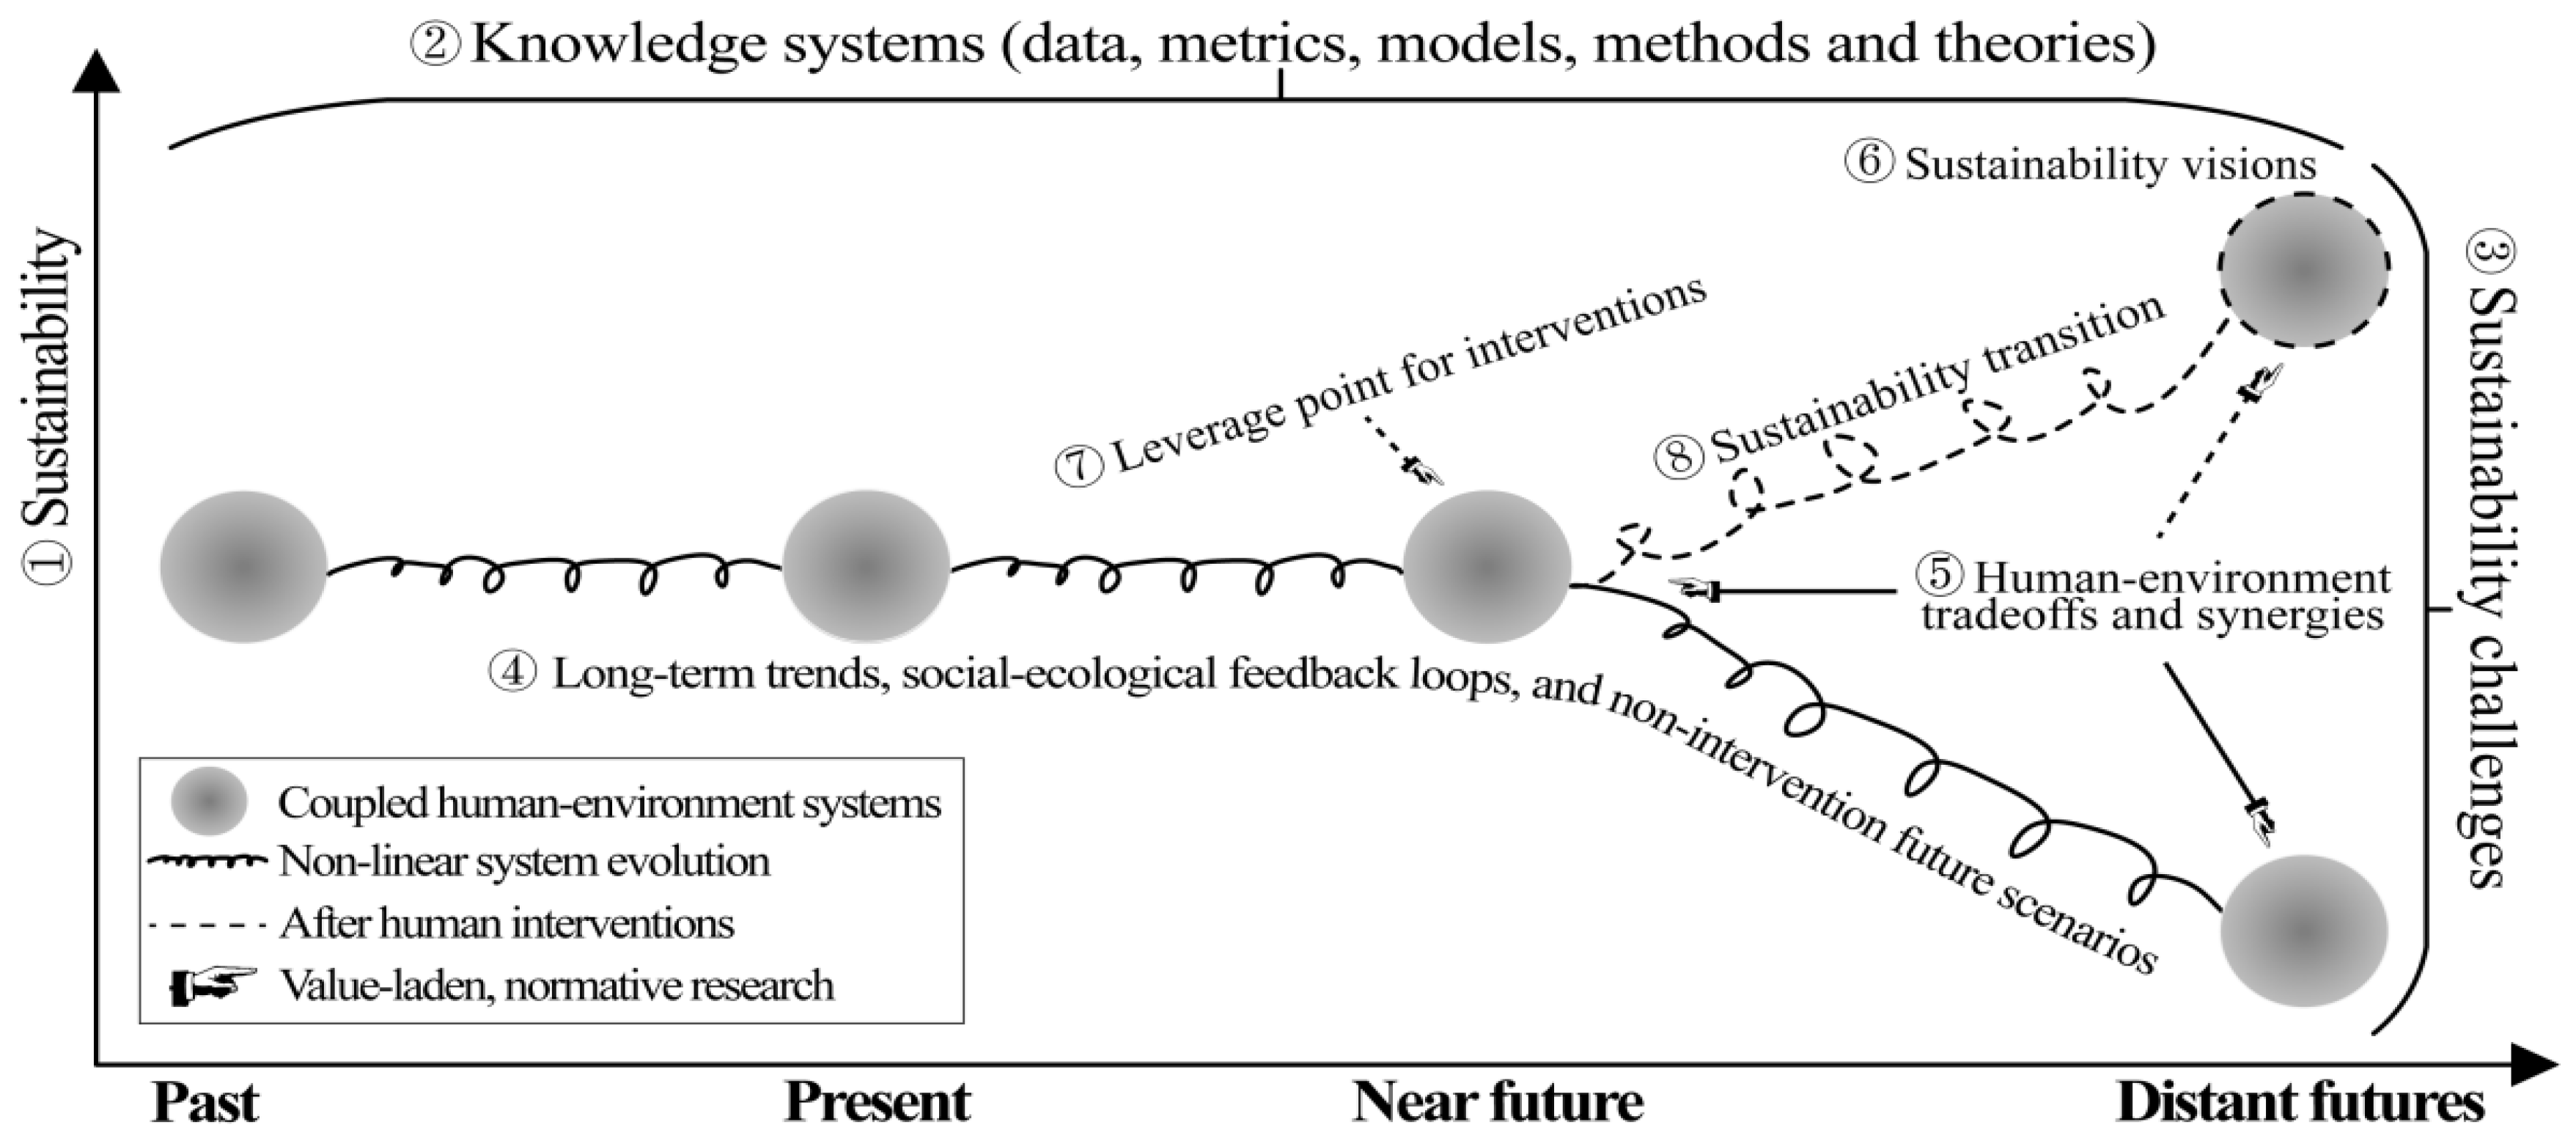
512. Interface between paradigms (Sala 2013)
Conceptual framework for sustainability science as interface between scientific and social paradigm for handling sustainable development challenges characterised by complex relationship between nature and humankind are. The scheme has to be considered on a multi temporal and spatial scales.
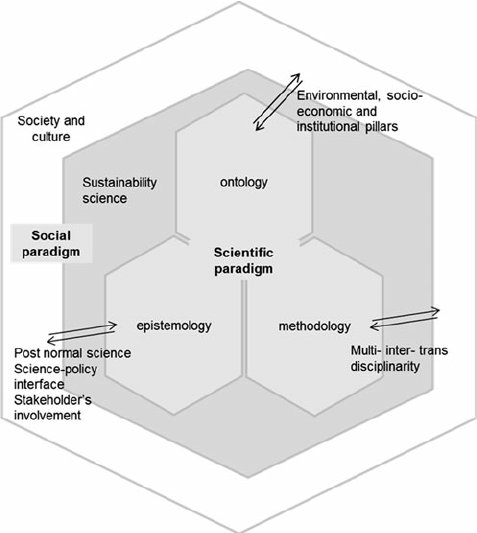
513. Rocket Catalyst (Global Nutrient Report 2017)
(Small numbers SDGS, large numbers part of a larger infographic)
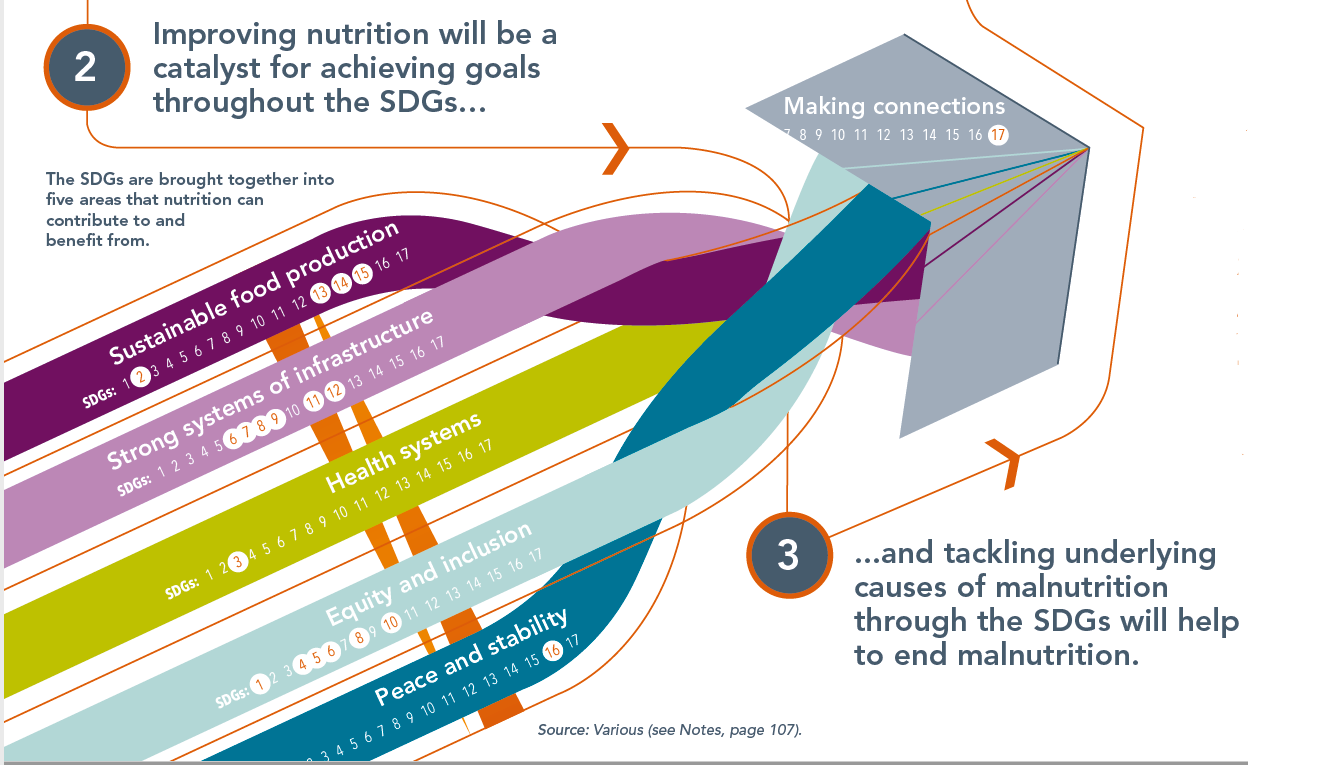
514. The world problematique – the scope of unsustainability (Tibbs 1999)

515. Pathways to sustainable future worlds (Tibbs 1999)

516. Scenario family tree: the outcomes of unsustainability (Tibbs 1999)

517. No regerts (Butler 2016)

518. Escaping the tunnel is Very Bad! (Glaser 2004)

519. Nexus thinking (Entura)

520. Heavy metal (Angeler 2016)
Schematic showing links between distinct, apparently unrelated knowledge domains. Shown are: (1) The links between heavy metal music and complex adaptive systems theory to describe the emergence of a socio-musicological system (light blue ellipse). (2) The potential of heavy metal music as an educational tool to increase awareness of environmental sustainability challenges (purple ellipse). (3) The links between complex adaptive systems and environmental sustainability that mediate social-ecological system dynamics (dark blue ellipse). (4) An emerging broader, unified picture of social-cultural-environmental dynamics (green circle). Arrow directions and thickness represent reciprocal versus unidirectional information potential between domains and interpretational objectivity versus subjectivity, respectively (see “Background” section)
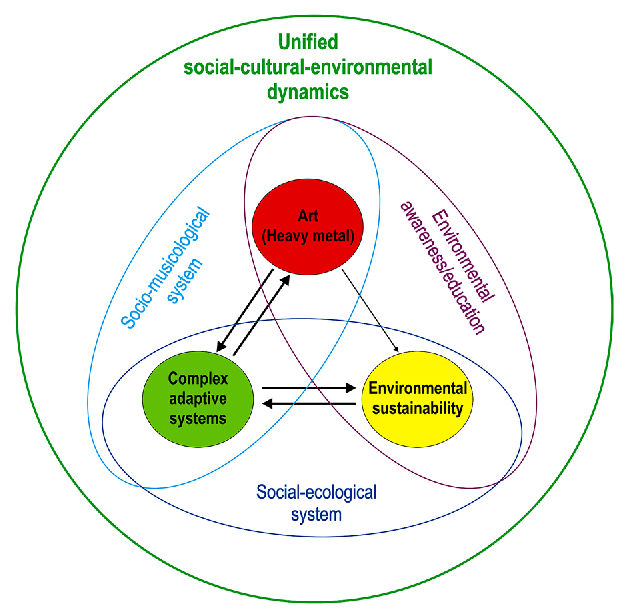
521. Dynamics of system (Schwaninger 2015)
Ecological integrity furthers the health of a social system, which then enhances
economic prosperity. A thriving economy – as the evidence shows – can become
disruptive to the environment (therefore the negative sign on the arrow). That is what we have had in the industrialized world at least since Second World War, and
increasingly also in the emerging economies. The dynamics of this system are
summarized in the negative signum denoting a balancing loop: this appears to be a
self-regulating system, in which damages are eventually compensated.
Yet, the situation is more complex: a healthy environment enhances economic
prosperity. Accordingly, injuries to the environment result in dysfunctionalities of the economy. This makes another self-regulating loop, which is supposed to be a good omen. But the appearance deceives: there are delays in the system (marked by the crossbars in Figure 1). Due to these retardations it is likely that the economy thrives even more, until at some point the environment strikes back, unexpectedly and forcefully.
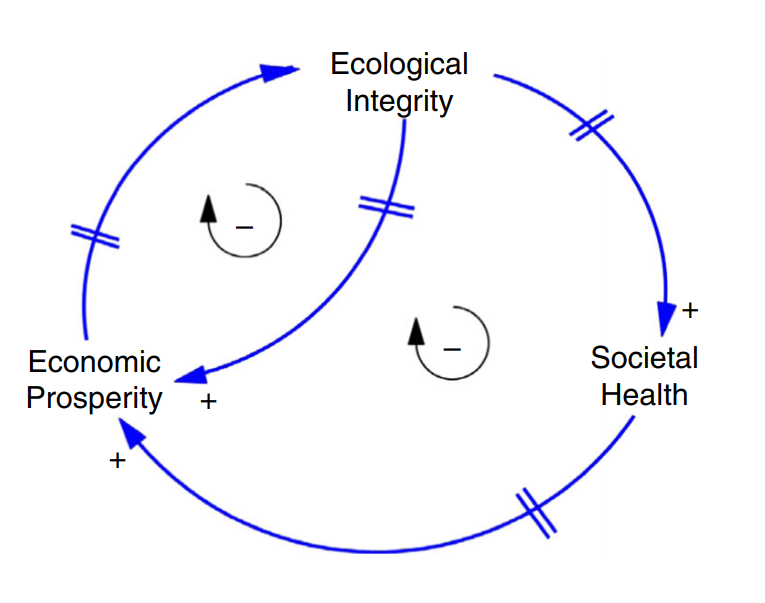
522. Recognition primary in justice related norms (Dawson et al. 2018)
A common source of contention for local communities regarding environmental management, particularly cultural minorities and Indigenous Peoples, is lack of recognition of their worldviews, identities, values, place attachments and practices in policy design and decision-making processes
As a well-functioning, inclusive and just policy process, global climate and forest governance would incorporate the diverse justice-related norms of remote local communities and any marginalised or vulnerable groups among them [33,34]. Justice-related norms represent shared understandings or commonly-held standards of how things should be and how things should be done [26]. Those norms can be diverse, complex and dynamic and are not simply diffused upwards or downwards between policymakers and local communities. Rather, for the justice-related norms to effectively travel from local level to national or even international levels, they must be acknowledged, mobilised and (re)presented in dynamic policy debates [29]. This brings to the fore the role of intermediaries (or justice brokers), comprising state, private sector and civil society actors and institutions who operate across levels to mobilise local struggles for justice and to represent local issues and perspectives in different forums, comprising both formal and informal interactions and decision-making negotiations at various levels to ensure local norms effectively inform policies
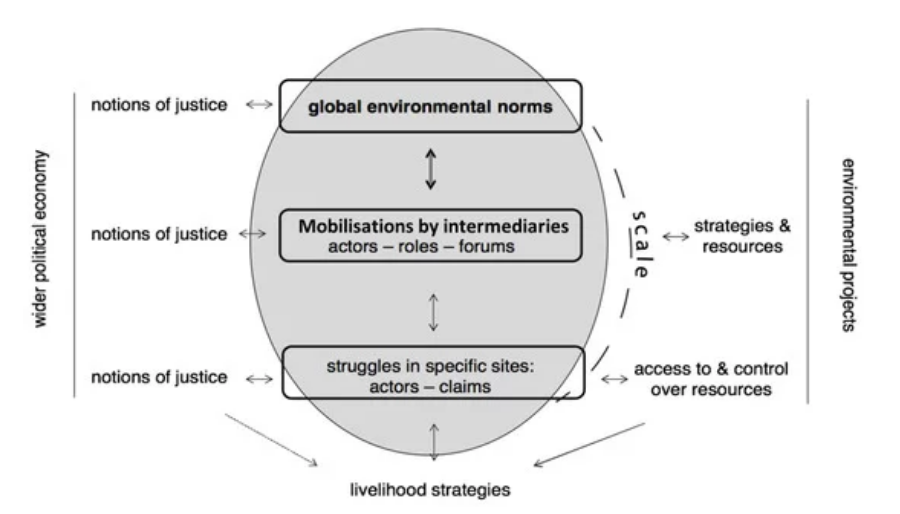
523. Spheres of life (Mella 2015)

524. “Neo-sustainability” (ie strong) with relationships (Bishops College)

525. Self-organising fractal sustainability (Peralta 2015)
I. Principle of manufacturing organization fractal:
II. Principle of organization derived from the variety or fractalicity required:
III. Principle of fractalization of sustainable product’s life cycle: This principle develops the co-evolution between the fractal organization and the environment or ecosystem, to achieve a sustainable behaviour in the machining process. It proposes the integration of the social, economic and environmental perspective in the fractals of manufacturing in whole life cycle from the perspective of the variety required (minimum complexity). This
principle will enable the goal orientation of the fractal system: in this case, the objective is the sustainability. An organization that controls a Fractal Manufacturing Process with sustainable approach will be oriented to the sustainable results.
IV. Principle of fractal levels of sustainable manufacturing: This principle sets the level of fractalicity. All fractal of manufacturing will be structured in different fractal levels with the goal of moving and to achieve sustainable development in a similar way, like a natural fractal object does.

Processes at a micro-level

526. SDG pentagonal rotunda (Anthony Judge)
(See also discussion on representing oppositional drives)

527. SDGs with scales and policies (Lehmann et al. 2017)
Selected SDGs (Annex 1) at various scales and under numerous global changes, with some existing integrative approaches to address them (Annex 2).
In order to avoid redundancy and dissonance, the new SDG framework should be linked to existing environmental policies. For instance, SDGs 14 and 15, which are about promoting the sustainable use of water and land ecosystems and halt biodiversity loss, should be in-line with the Aichi targets for 2020 defined by the Convention on Biological Diversity [3].

528. Way of life (L. Mann et al. 2007)
Category 5-Sustainable Design is a Way of Life (+ve is used to denote posotive)

529. Changing focus (in hydrology) (Zalewski 2015)
Evolution of the human approach towards the use of natural resources, starting from the belief of unlimited potential of nature to the recent awareness of the necessity for regulating ecological processes for the enhancement of the ecosystem carrying capacity

530. Paradigm shift (Zalewski 2015)
Expected direction of a shift in environmental science paradigm from the currently prevailing structure-oriented paradigm (conservation and restoration actions, focused on the assessment of the effect of various human activities on biota) to process-oriented approach (regulation of ecosystem processes, i.e., circulation of water and nutrients, and energy flow) to create a background for harmonization of societal needs with ecosystem potential, and ultimately the sustainable development; the arrows represent the expected shift in the paradigm at three levels, as follows: (1) scientific, (2) operational/practical, (3) political, and the expected results.

531. Integrative Science (Zalewski 2015)

532. Elements of a sustainable lifestyle (Skeele, Beyond Suburbia 2011)

533. Spearheads (Sitra, Finnish Government 2017)
When the environment is seen as the basis for comprehensive well-being, we can live a better life at the same time as environmental hazards decline (1, see picture). In order to keep development within the ecological limits of the planet or to reverse changes that have already exceeded planetary boundaries, environmental hazards must be reduced independently from potential economic growth (2, see picture). In order to make this happen, we need an energy and natural resources reform that is socially fair. In addition, the dependence of well-being on economic growth must also be reduced (3, see picture). This is why we need to renew ways of achieving equality and inclusion, so that they can be used as building blocks for a sustainable society in the future.
Realising the three levels of decoupling described above requires a rethinking of our approach to the economy, where the economy is seen as a means of producing sustainable well-being instead of an intrinsic goal. However, none of the objectives
described here can be realised unless we take responsibility at all levels, from the individual to the global community.

534. Goal-Oriented Engineering for Sustainability. (Mussbacher and Nuttall 2014)

535. Sustainability Assessment Based on Slope at Capacity. (Mussbacher and Nuttall 2014)

536. Culture as a driver (UNESCAP)

537. Mitigation and enhancement (and mining) (Davidson, WEF 2015)
The report identifies where mining can enhance the positive impacts it has and mitigate the negative impacts across the 17 SDGs (see figure1 below). For example, in addition to focusing on energy efficiency, mining companies can leverage their energy demand to extend power to undersupplied areas through partnerships that enable shared use energy infrastructure, helping to achieve SDG7 (Energy Access and Sustainability).

538. The new Prince (Hermansen 2006)
The model shows how industrial ecology is a construction between what is ecologically possible within the framework of the capacity of the ecosystems (biosphere) and what is socially desirable and acceptable within the framework of a sustainable society. Curve A represents connections between concern, ethical involvement and wishes for a new way of solving problems based on a holistic approach, which gives motivation and justification for implementing new industrial strategies (B). In order to manage this new challenge and to connect the problem solving to real life situation the connection between practical ecology and industrial ecology (C) must be made explicit. Support of new scientific knowledge comes along arrow D. The new ‘Prince’ is the individual, assembly, techno-structure, nations or collective that may place themselves in the central box ‘Industrial ecology’ and run the meandering and negotiation process.
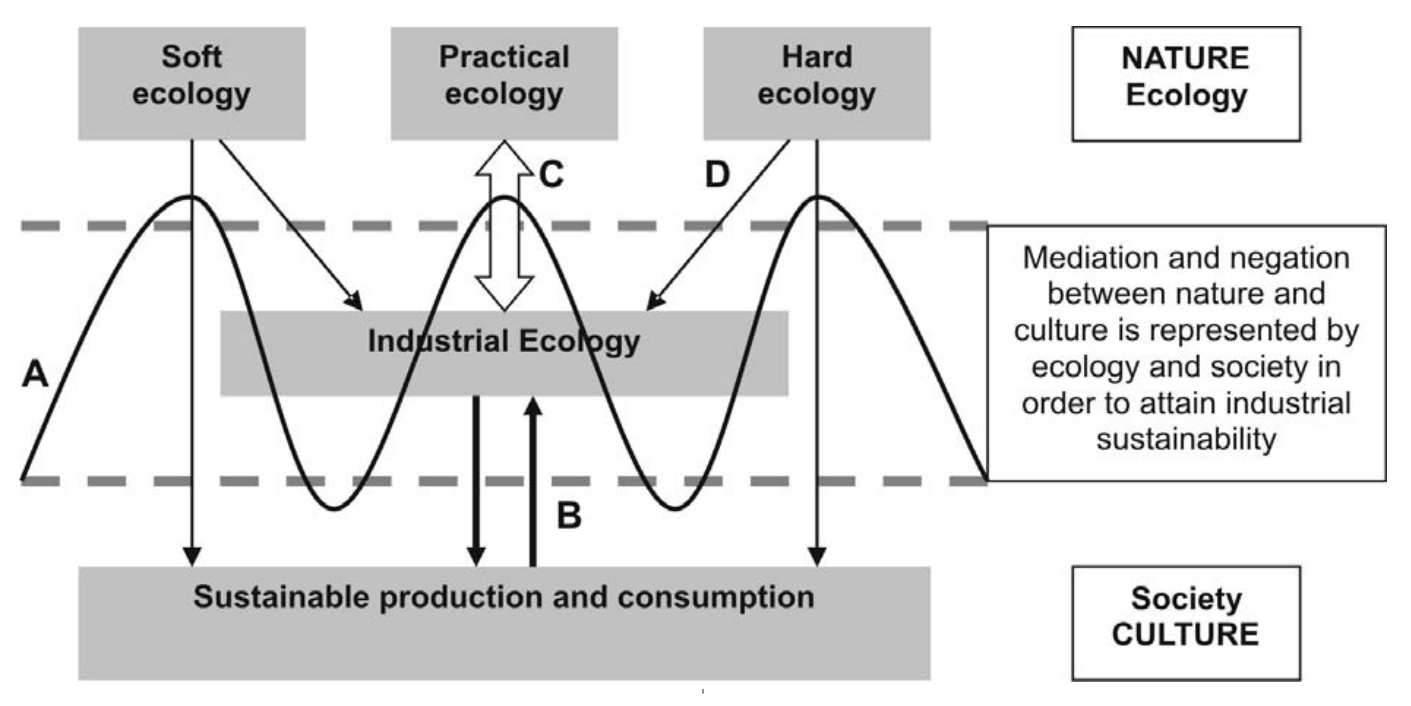
Where the new Prince is the mediator between technical and social.
Figure 1 shows Latour’s diagram of the false duplicity to the left and a more realistic one to the right. His main point is that we have to place ourselves in the new ‘Prince’s’ position and by meandering between the human sphere and non-human sphere.

539. Technology central but won’t “save the day” (Flint 2010)
The symbolism shown here provides a thought process and guide to sustainability analysis in reference to the application of technology as a means to utilize natural resources for socio-economic well-being. Numerous feedback paths suggested by this symbolism are the source of sustainable actions for human improvement.

540. Integral Accounting (Dellner 2019)

541. Fengshui (Boris Ceranic, Zm Zhong 2007)
The natural landscape located at the edge of a FengShui settlement is believed to be full of living Qi that is beneficial to local inhabitants. Through the connection and merge between mountains, water and forest, the living Qi supplies vital energy for the existence and promotion of a whole village both under the ground and on the surface of land. The flow of river, the accumulation of water (such as lake and pond) and the exuberance of FengShui forest all indicate the quality and condition of the living Qi. With the mountain to mountain, water to water and forest to forest, concealed local energy links with the national energy (Dragon Qi of royal family), interactive and complementary to each other, which enables local settlement to receive continuous living Qi from the heart of the nation. Therefore, keeping the environmental quality of local settlement and fully respecting the inherent pattern of surrounding landscape is not only a necessary approach to provide constant protection of Qi and ensure prosperity of the whole nation, but also a necessary condition to maintain the long existence of the whole community

542. Sustainable Chinese Landscape Architecture (Uwajeh and Ezennia 2018)

543. Ecological distribution conflicts (Schiedel 2018)
Schematic overview and key questions to understand interactions between socio-etabolic configurations, ecological distribution conflicts, environmental justice movements, and sustainability transitions.

544. Net positive development (Birkeland 2008)

545. Community economic development (Ndaguba & Hanyane 2018)

546. Eco-swaraj: Towards a Radical Ecological Democracy (Kothari 2018)
One such framework that has emerged from grassroots experience in India, with significant global resonance, is eco-swaraj. The term swaraj, simplistically translated as self-rule, stems from ancient Indian notions and practices of people being involved in decision-making in local assemblies. It became popular during India’s Independence struggle against the British colonial power, but it is important to realize that it means much more than simply “national independence.” In many of M.K. Gandhi’s writings,6 in particular Hind Swaraj, he noted that swaraj encompassed individual to community to human autonomy and freedom, integrally linking to the ethics of responsibility towards others (including the rest of nature), and to the spiritual deepening necessary for self-restrained and ethically just behavior.

547. Corazóstenibilidad: Sustainability from the heart (Roots and Routes)

548. Territories of peace (Chaves 2018)

549. 5-S Synergies for Creating Integrated Value Framework (Visser 2017)
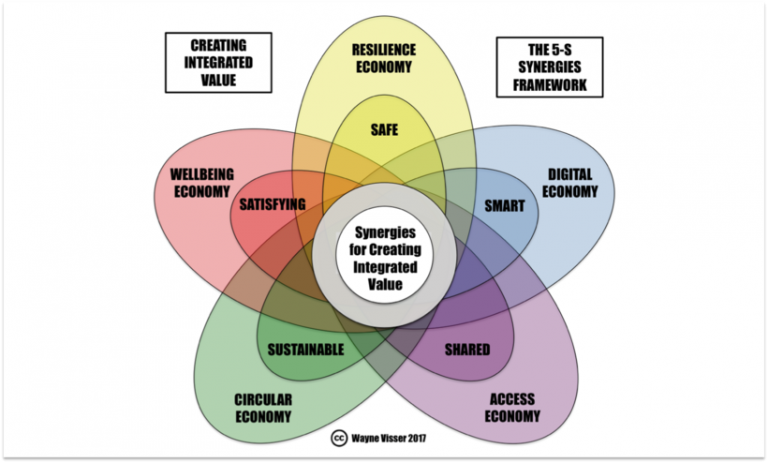
550. World lines. Alternative futures (under strong responses) (Raskin 2008)

551. Andean cosmos (Rist, in van Wijk 2010)

552. Re:imagining change (Smart CSO Re:imagining Activism)
If we want to change the system, trying to convince the incumbent system players (Regimes) to fundamentally change is often futile
For systems change, we need to work at multiple levels at the
same time (Culture, Regimes and Niches).Activists, organisations and campaigns need to learn how to
shift societal values and framesPioneers are building the new system. They require our support
Instead of playing the game of politics, we need to use windows
of opportunity in the old system to advance system change.We need to learn how to create positive feedback loops between
the three levels

553. Vilcanota conceptual framework (Apgar 2009)
The Chakana cross figure used in the Vilcanota conceptual framework is sacred to the Quechua peoples and provided an appropriate pattern to illustrate how order in the world is shaped by collective processes based on the principle of reciprocity (Ayni) that runs across the Kaypacha, Hananpacha and Ukupacha scales. The scales represent both time and space and allow the past and future to come together in understanding. Ecosystems and their interactions with humans are understood through the four dimensions of the cross; the cyclical nature of all processes (Pachakuti), an interconnected system of nature and people (Pachamama), collective social processes (Ayllu), and learning through love (Munay) and work (Llankay) achieving higher state of knowledge about the system (Yachay)

554. Socio–Ecosystemic Sustainability (Morandín-Ahuerma 2019)
Graphic representation of the socio–ecosystem sustainability dimensions. Culture is framed by the biosphere, in which three dimensions converge: Conceptual, active, and material, in which the space–time phenomenology is presented.


555. Buen vivir (txt Walsh 2017)
In its most general sense, buen vivir denotes, organizes, and constructs a system of knowledge and living based on the communion of humans and nature and on the spatial-temporal-harmonious totality of existence. That is, on the necessary interrelation of beings, knowledges, logics,
and rationalities of thought, action, existence,
and living.
556. Thinkers beyond Capitalism (Blaqswans)

cf Capitalist

557. Trinity of Latin American Good Living (Hidalgo-Capitán and Cubillo-Guevara 2017)
Good Living can be defined as a way of living in harmony with oneself (identity), with society (equity) and with nature (sustainability) (Hidalgo-Capitán and Cubillo-Guevara, 2015).
…from a ‘de-constructivist’ perspective (Derrida, 1967), we contend that there are at least three ways of understanding Good Living —one ‘indigenist’ and ‘pachamamist’ (which prioritises identity as an objective), one which is socialist and statist (which prioritises equity) and another which is ‘ecologist’ and ‘post-developmentalist’ (which prioritises sustainability)

558. Intellectual Wellsprings of Latin American Good Living. (Hidalgo-Capitán and Cubillo-Guevara 2017)

559. Access mechanisms and power to give “sustainability effect”. (Neimark 2019)


560. Synergistic pathways (IPCC 1.5 draft)
A conceptual illustration of climate-resilient development pathways, rooted in the core social dimensions 13 of human development, poverty eradication, and reducing inequalities and guided by the SDGs, while 14 climate resilience being shaped by the highest synergies and least trade-offs that emerge from adaptation 15 and mitigation pathways.

561. Triple wins (IPCC 1.5 draft)
Conceptual model of triple-wins and triple-losses. Presence of high enabling conditions affords synergies 12 between adaptation (A), mitigation (M) and sustainable development (SD) objectives, producing triple win outcomes. Increasing constrains produce fragmented responses to A, M and SD, increasing the 14 likelihood of undesirable trade-offs and triple-loss outcomes.

562. Thwinking inside a glass box (Thwink.org)

563. Brain. (Friends of the Earth Europe 2018)
No suggestion that the concepts map to these areas of the brain.

564. SDG colours on a Theodorus Spiral. Why? (Kimball 2015)
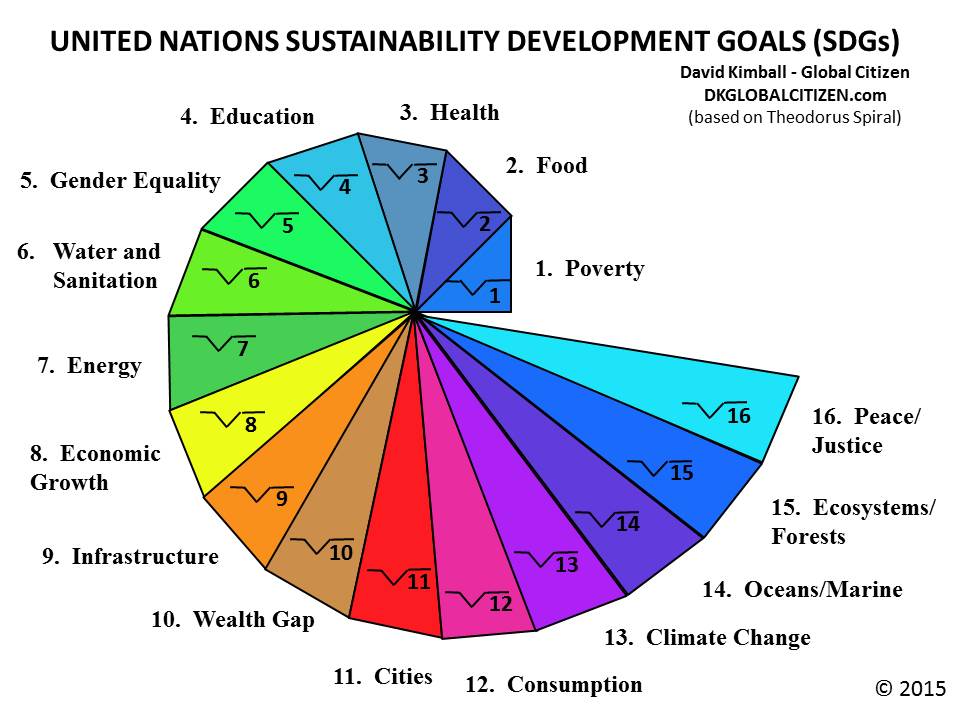
565. Sachs appeal (Sachs 2015 via Snauwaert)
The achievement of a peaceful, just society that is socially inclusive and environmentally sustainable, is contingent upon a citizenry that possesses the capacities of complex analytic and normative thinking. Our citizenry should be afforded educational opportunities that provide them with the intellectual and moral capacities as well as the empowering political efficacy to shape the development of sustainable just peace as a matter of right.

566. Equity through distributive justice in a sustainable development (Ashu Tufa 2015)
Equity through distributive justice in a sustainable development. The burdens and benefits are identified for membrane based processes applied for water and energy production. Intragenerational agreement is considered as a base line for the burden–balance to present and future generation in the process of sustainable development.

567. Regrettables (Shrimpton 2017)
The global food system is currently making enormous contributions to global warming and consequent ocean acidification, as well as biodiversity loss and the obesity and diabetes epidemics, to name just a few of its socially regrettable effects.

568. Conceptual Reserve Cube (Sykes 2014)
The movement from a conventional McKelvey Box (1972) to the sustainable development related ‘conceptual reserve’ cube. The former only considers geological and economic criteria, with the top left representing the most economically viable and geologically certain portion. The latter also considers sustainable development criteria through the idea of ‘accessibility’. The forward, top-left portion of the reserve cube therefore represents the most geologically certain, economically viable and easily accessible portion (source: Sykes and Trench (2014b) based on Cook and Sheath (1997), Otto and Cordes (2000) and UNECE (2013)).

579. Lots of cogs (istock)

580. Integrated Urban Planning Design and Sustainable Design Principles (Soyinka and Siu 2018)
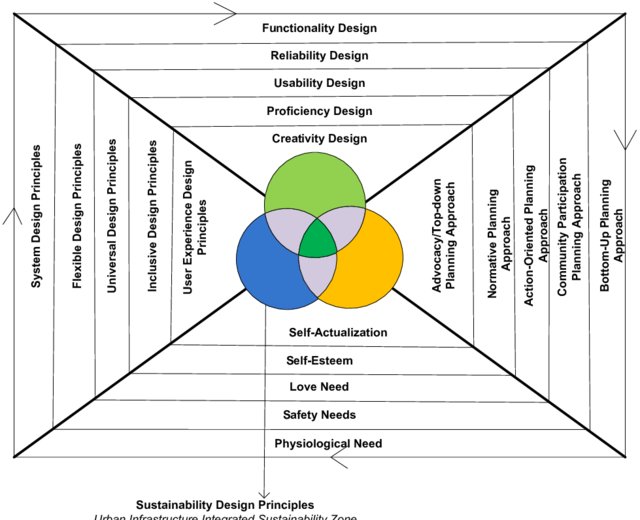
581. Pole vaulting sustainability (Quantis)
(Ok, not really a diagram)

582. Design for Sustainability (Ceschin and Gaziulusoy 2016)

583. Weak and strong with capability maturity (Roome 2004. Toyota mapped by Basavaraj 2018)


584. Sustainable happiness and we’lqatum (O’Brien 2007)
our work is housed within the three pillars of sustainability (economic, environmental and social) and will draw from both the Mi’kmaq concept of we’lqatum and sustainable happiness. The eyes in the diagram represent the Two-Eyed Seeing approach we will use. Mi’kmawey Debert and Science Wtisi are collaborators on this project. Mi’kmawey Debert is a community and land-based project to develop an interpretation centre and exhibits at the oldest directly dated archaeological site in Canada and the organization (led by the Confederacy of Mainland Mi’kmaq) is interested in using sustainable happiness in its cultural interpretation centre. Science Witisi aims to use Two-Eyed Seeing to acquaint Aboriginal and non-Aboriginal students with the lessons that can be learned from the land.

585. Efficient frontier (Imperial College Engineering)

586. Sustainability Diamond (Kammerl 2017)
However, these three dimensions are not enough for a differentiated assessment of sustainability of products. Therefore the dimensions will be extended at the level of criteria. Related to the application assessment of sustainability of products in each case at the intersection of two dimensions another criterion is introduced. Result is a
six-membered scheme with the criteria (I) ecological compatibility, (II) risk and use
effects, (III) social compatibility, (IV) national economic benefit and usability,
(V) economic profitability and (VI) resources and lifetime. The concept of the
sustainability diamond intends to open the level of criteria for a weighting by actors,
i.e. product engineer, product designer or manager.

587. Pathways to realise research (John 2019)
Pathways (rep. by arrows) to realize sustainability research principles (dotted triangle) through the areas of how, where, and what (edges) within the field of
urban metabolism research (circle).

588. Emergence of Sustainability (Scarano 2019)
Schematic representation of the emergence of sustainability. The integration and convergence of distinct modules related to science, policy and moral values, resulted in the emergence of sustainability. These original modules are to some extent experiencing submergence. Sustainability, however, requires further convergence of modules—including principles, values and practices belonging to different worldviews (e.g. African Ubuntu, Andean Buen Vivir and Asian Swaraj, alongside with SDG—Sustainable Development Goals, and degrowth)—for becoming a new ‘normal’. This new state of things is a new utopia, open in format and definition. The main principle of Lovelock’s Gaia hypothesis, of the biosphere in the planet interacting as an indivisible whole, is an example of the need of individually and collectively developing a new mindset to achieve sustainability goals.

589. Trilemma framework (Glover 2016)
We did not want to make a prior assumption that such a trade-off must exist among the three development goals of reducing inequalities, accelerating sustainability and building more inclusive and secure societies, yet we wanted a structure that would draw out tensions, conflicts and trade-offs between these goals, if they existed. Indeed, a key part of our purpose was to test the complacent assumption that sustainable development strategies must be mutually compatible and harmonious.
Figure 3 illustrates the trilemma framework we used and highlights some of its key characteristics. The shaded triangle illustrates the basic interaction among the goals of equality, sustainability, and security/inclusion. Each corner of the triangle is in a direct relationship with the other two corners. A given situation or scenario might be interpreted as being situated somewhere within the shaded zone but, as emphasised by Shell in their treatment of the trilemma triangle, potentially closer to one or two of the poles than the other(s).

590. Grounded sustainable cartography (Thomas 2016)
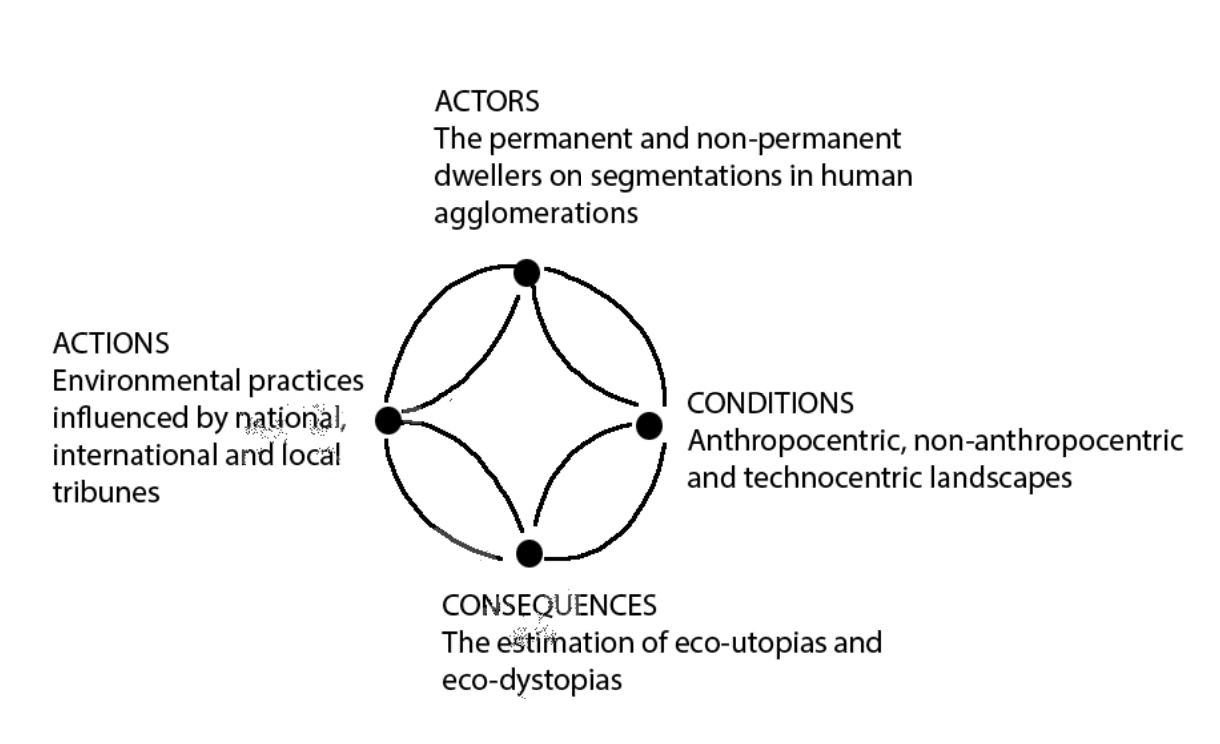
591. In the space between utopia, escapism and heterotopia (Hong 2016)
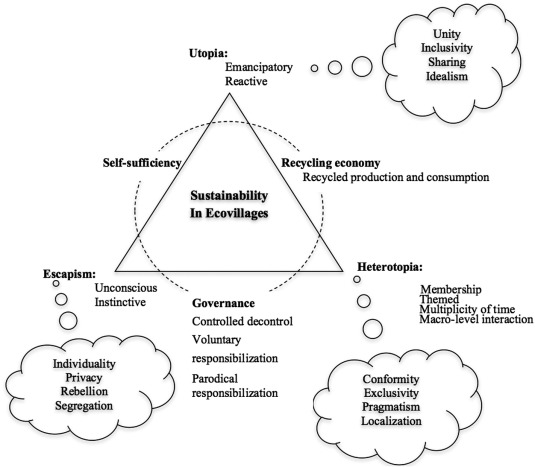
592. Spirally utopia (Sentíes and Rojo 2000 after Toledo 1997, in Heald 2012)

593. Story Map (Nadeena Dixo, ISCA)


594. Game affordances (Fabricatore and López 2014)

595. Cultures of Repair (Schultz 2017)
Four key threads…discussed below as concealment; newness; techne; and care. In relation to the third research question there presents a gap in knowledge for a visualisation, to read in conjunction with these threads, therefore the ‘Cultures of Repair Relational Map’ (Fig. 1) has been designed. The aim of the map is to assist designers comprehension of the gathering of modernity/coloniality and its arrival in futures (Fig. 1. part A) in order to be in a position to amplify sustainable activities in repair cultures through decolonial design.

596. Plan, Do, Check, Act. (Expressworks)
(though I’m not sure what the difference is between “do” and “act”)

597. Savoir-être and a immaterial/measurable yin/yan (Wiseholding)

598. Sustainable Peace (Celiku 2017)
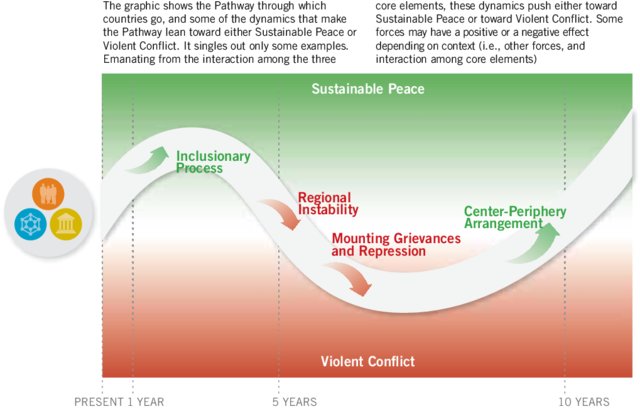
599. Pendulum (Kamphuis)

600. Seeds of a good anthropocene (Bennett et al. 2016)
(1) Initiatives, alone or in combination, that improve social, ecological, or economic dynamics within a particular setting arise and grow and (2) begin to have transformative impacts beyond initial localities and sectors as they spread. (3) Seeds may be replicated or otherwise influence existing values. (4) Importantly, the emergent attributes of those seeds, or interactions between seeds, influence the development of further innovations, spawning next-generation seeds that may have different characteristics than those of the original seed.

This collection includes a flurry of diagrams bringing regenerative aspects of sustainability to the fore. As usual, wading through the ever-persistent pillars models, now usually disguised as things such as “sustainable business innovation”. Is it just me, or is the management literature 20 years behind sustainability science?
Updating the collection of images describing sustainability.
601. Axiological ramp (Bolis 2014)
Decision perspective dimension: represents a continuum of scope to be considered in decision making processes, starting from individual and functionalist drivers and evolving to axiological drivers. In this dimension, it was considered that decisions can be made based on the goals and constraints of the individual, family, organization/community, state, continent or global society. At one extreme (individual and functionalistic drivers), the decision perspective is concerned with objective, rational, short term, restricted and problem-oriented issues. At the other extreme (axiological drivers), this perspective considers more subjective, emotional, long term, value-based, systemic and intergenerational aspects before reaching a decision. This latter decision perspective promotes initiatives that are based on social values, ethics, cooperation, equity and equality. In this dimension, the main question is: are positive and negative impacts for society considered in decision making-processes?
One of the dynamics that contributes to sustainable development is the positive relationship between the decision perspective and natural resources concerns. This can be considered reasonable, since axiological drivers for decision making mean that decisions are not based on the short term individual impact of resource
exploitation. Instead, this perspective ensures that future generations are also able to satisfy their needs using the natural resources available in their time.

602. Risk assessment (RA) framework focusing on the risk-resilience-sustainability nexus (Sajjad and Chan 2019)

603. Green ocean (Markopoulos 2020)
The oceans transition process through the transformation canals.
The Green fuel required for an organization to reach Green Oceans through the turquoise canal is an everlasting resource that exists in every organization regardless its size, market or expertise. It is the knowledge of the employees which resides with an organization at no cost, enough to lead a green transformation. However the challenge is on the effective way of collecting, analyzing and utilizing such knowledge. Knowledge democratization is an approach to this challenge. No one knows where an idea can come from or what solutions can derive from the organization’s human resources by treating employees as capital assets and not as white- or blue-collar workers.

604. Southern environmentality dispositif. (Musindo 2022)
While decoloniality allows for the integration of cultural perspectives regarding the environment and further aids the emphasis on curriculum as a discursive process, Ubuntu/Ukama emphasises non-hierarchical power relations in human-nonhuman interactions and resource use. Discourse, power, knowledge, and subjectivity from a decolonial perspective allow for a critique of Western dominance to envisage a non-hierarchical form of power, a coexistence of knowledge and knowing subjectivity for re-existence. These concepts engender the ‘transformative vision of an alternative society’. Decoloniality then opens spaces for Ubuntu/Ukama. While decoloniality through the concepts of power, knowledge and being contains potentialities and possibilities for creating another world, it is when it is interpellated with Ubuntu/Ukama that decoloniality becomes a sound basis for re-imagining power, knowledge and being that promotes sustainability. Nature-culture binaries inherent in the curriculum are opposed by Ubuntu/Ukama.

605. Relationship with resilience (in nature-based toursim destinations) (Espiner 2017)

606. Pillars as a business model canvas (Pardalis 2022)
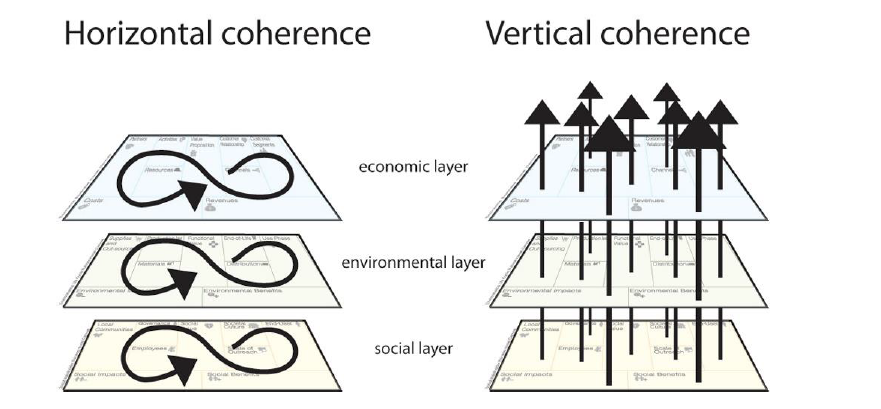

607. Sustainable place shaping (Horlings 2020 after Roep).
- Re-appreciation. People attach meanings and values to place and reflect on the relations which they are part of. Re-appreciation is the starting point of awareness of place identity, which can result in a ‘proud of place’ and a joint mobilization around new storylines and agendas for the future (Grenni et al. 2019).
- Re-grounding. A re-grounding of practices in place-specific assets and resources, can potentially make them more sustainable. Practices of sustainable place-shaping are influenced by wider communities, cultural notions, values, natural assets, technology and historical patterns, illustrating existing variations in institutional and cultural contexts.
- Re-positioning. The re-positioning towards the established institutions, or dominant regime such as government and public policies, business and markets and the innovation system evolves by creating experimental spaces or niches. Re-positioning includes a critical perspective on how our economic system is organized and what might be sustainable alternatives that shape places can enhance the quality of life in places.

608. Transformative social innovation (Mehmood 2020)
Sustainable re-learning, re-experiencing, and re-generation processes to reshape places in a transformative way.

609. Regenerative decision making (Craft 2021)

610. Collective vision of potential (Craft 2021)


611. Sustainability Paradigms (Gibbons 2020)
Different sustainability paradigms have developed through time, each including and transcending the previous. Conventional and contemporary sustainability are based on a mechanistic worldview and are largely anthropocentrically focused. Contemporary sustainability advances conventional sustainability by including concepts such as justice, complex adaptive systems, and transdisciplinarity. Regenerative sustainability, the next wave of sustainability, is based on a holistic worldview and aims for thriving whole living systems. It integrates inner and outer realms of sustainability and focuses on shifting deep leverage points in systems for transformational change across scales.
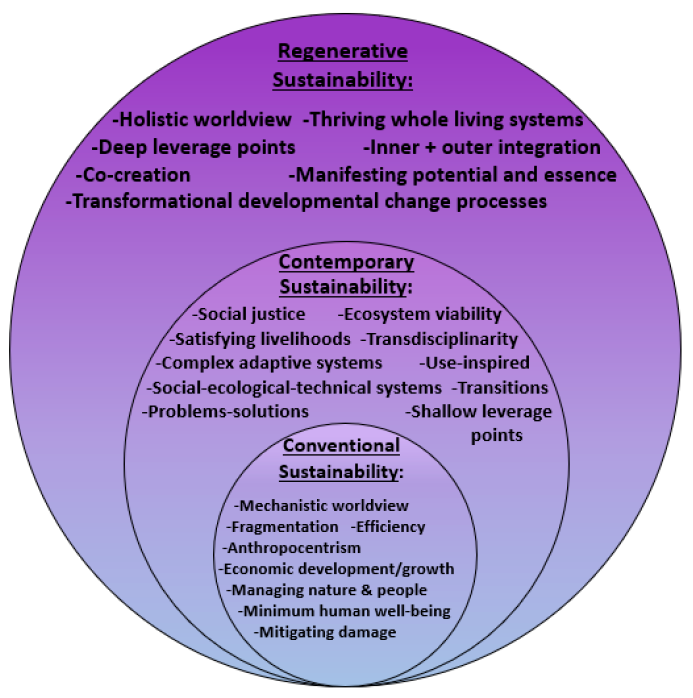
612. Flower (pretty and regenerative ) (Gibbons 2020)

613. Meadows’ leverage points with multiple actors and learning (Chan et al. 2019)

614.Leverage points and sites of action (Chan et al. 2019)

615. Causal Chain of Levers (Chan et al. 2019)
[1–8 refer to leverage points, and A–E refer to levers]. First, (i) a new incentive programme [A] provides a means for individuals and organizations to express their latent values of environmental responsibility [3] by paying for diverse resource users and land/water stewards to conserve and restore ecosystems, mitigating unintended negative environmental impacts associated with supply chains. These co-payments thus provide incentives that enable additional value-oriented action. (ii) Both the consumer/organizational action and the new conservation/restoration trigger [7] innovation in practice and appropriate technology. The consumer/organizational action of committing to pay for mitigation of their impacts might have the effect of [2] reducing consumption. (iii) Both the innovation and the reduction in consumption rein in [6] negative environmental externalities. Because many negative externalities have disproportionate impact on vulnerable populations, this could [4] reduce some inequalities. (iv) As a socially conspicuous way for people to enact latent values of responsibility, the practice becomes normal and helps shift (1) visions of a good life away from conspicuous consumption. This further [2] reduces consumption and enhances [8] education about social–ecological problems, systems and solutions. (v) The value-enabled action may then facilitate changes in [E] laws and policies, and their enforcement, with four effects: [3] consolidating value-based action; [B–D] shifting management and
governance systems to be integrated, pre-emptive and adaptive; further increasing [8] education and knowledge transmission about nature and sustainable resource use; [5] enhancing broad and appropriate inclusion of Indigenous Peoples and Local Communities in conservation and restoration; and [1] eliminating harmful production–enhancing subsidies/incentives (last two arrows not shown for simplicity). Unlabeled silver arrows depict a small subset of additional synergies by which one leverage point might facilitate others

616. Pillars on a triangle – so as zero-sum competing forces. With weak-strong sustainability arrow and zone for luxury fashion (Csaba 2018)

617. Relational approaches (Foggin – thinking like a mountain 2021)
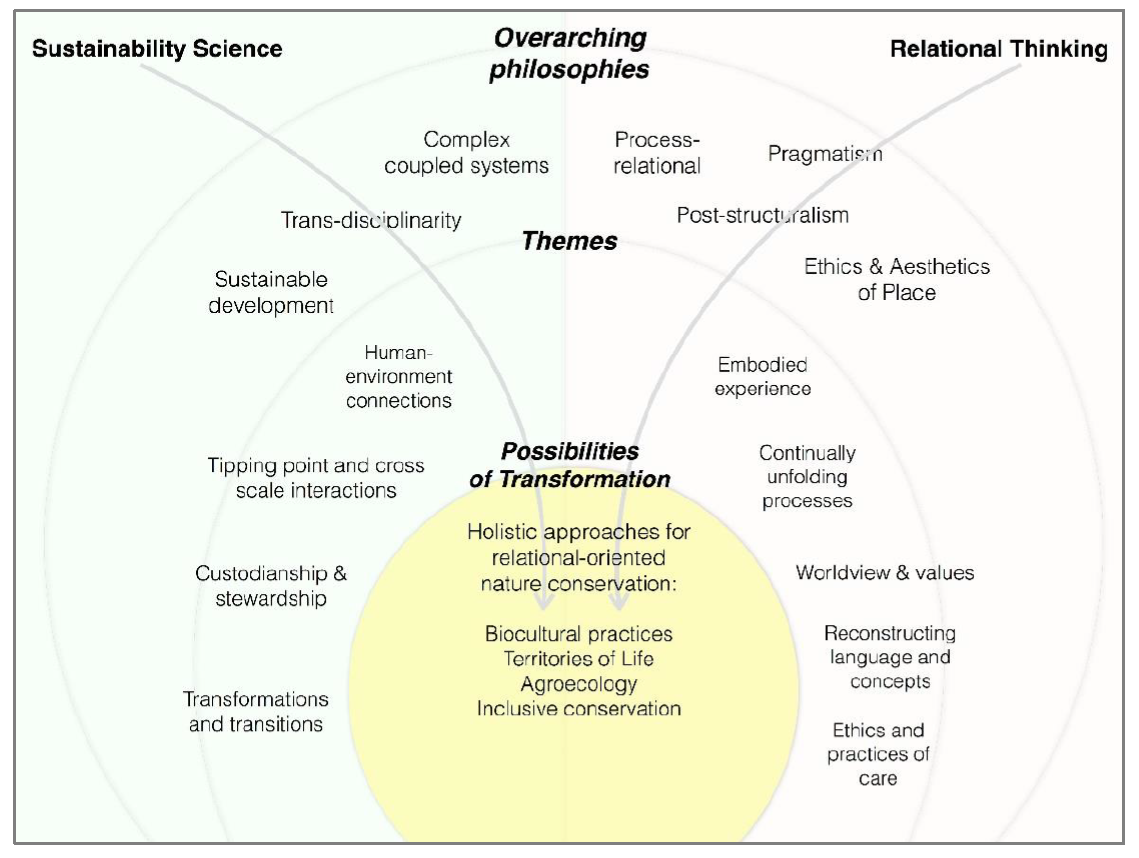
618. Scoping canvas (plus bonus capabilities and transformation) (Wigboldus 2020)


619. Sustainability as transformation but still framed by past (Priebe 2020, leading to Marald and Priebe‘s metamorphosis).

620. Connecting inner and outer leverage points (Woiwode 2021)

621. Socio-ecological transformation, but challenges of wickedness (Sediri 2022)


622. Marketing sustainability pyramid (Lim 2022)
The proposed model is not at odds with existing approaches to sustainability, but rather aims to provide a clearer focus on how to approach sustainability dimensions in a way that moves the larger society toward greater sustainability,
The core tenet of the sustainability pyramid is that sustainability dimensions at the bottom of the pyramid should be addressed first before addressing higher-level sustainability dimensions. The economic
dimension is at the bottom of the pyramid because the root of sustainability-related problems is unsustainable consumption, which is caused by consumers. For the large majority of consumers, economic value is the main consideration in their purchase and consumption of goods and services. Without being convinced of economic value, mainstream consumers are unlikely to consider the social and environmental value that sustainable products and practices entail.
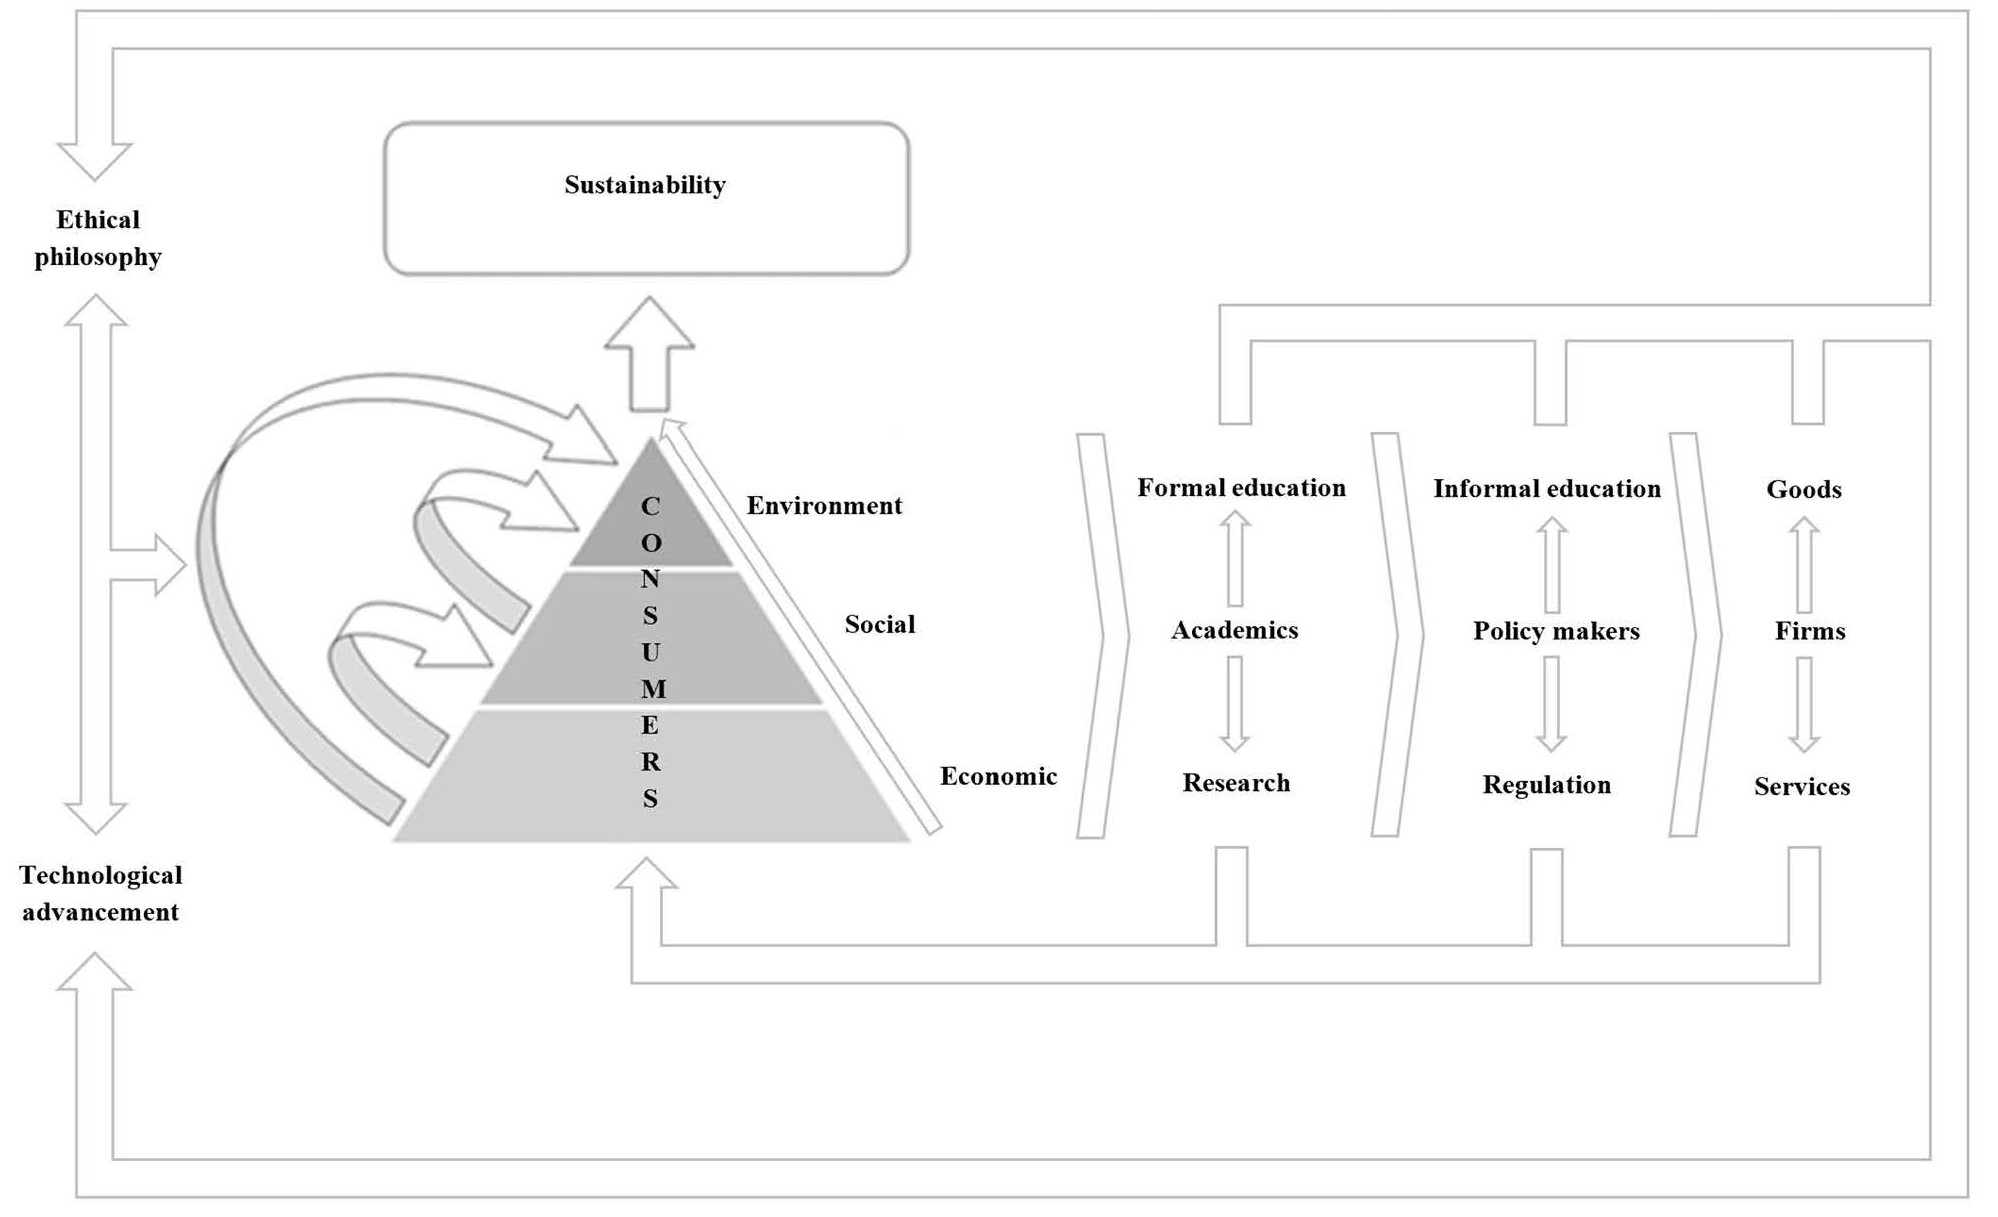
623. Mindfulness and inquiry. (Wamsler 2016)

624. Nature Futures Framework (Duran et al 2023).
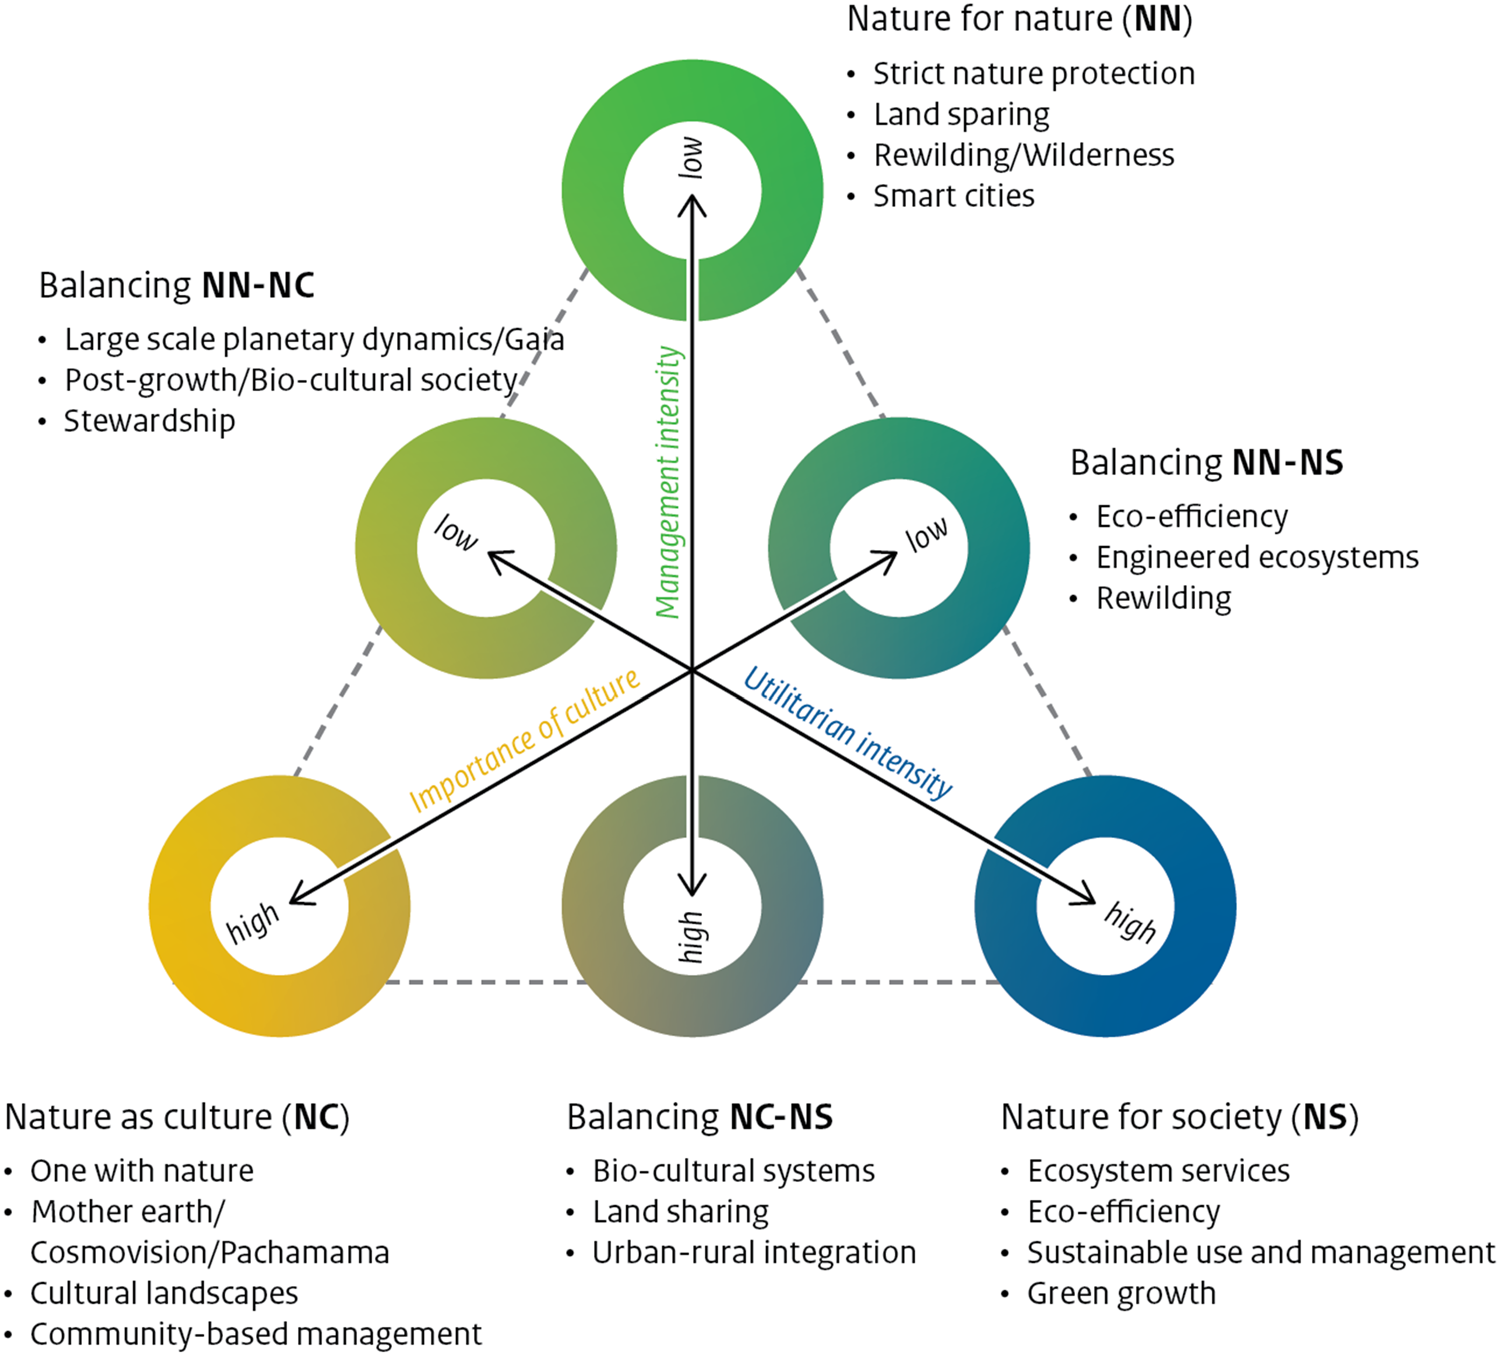

625. SDGs as music theory (Veland 2021)


626. Three time horizons to regenerative and equitable future (Fazey et al 2020)

627. Seven interrelated cycles (Calisto Friant 2023)
OK, not really sustainability, but allows them to say:
Addressing a problem related to
“Any of the seven cycles thus necessitates a broad understanding of the interactions and interrelations between all cycles”
“All in all, the core value of representing these seven cycles resides in helping us understand what circularity” and “circular” flows can be about in relation to sustainability and human and planetary well-being. They help expand the imagination regarding what is and what isn’t included as a “loop”, “cycle”, circle”, or “flow” when we talk of a “circular” economy and society.”

628. Performative degrowth (Brossmann 2019)
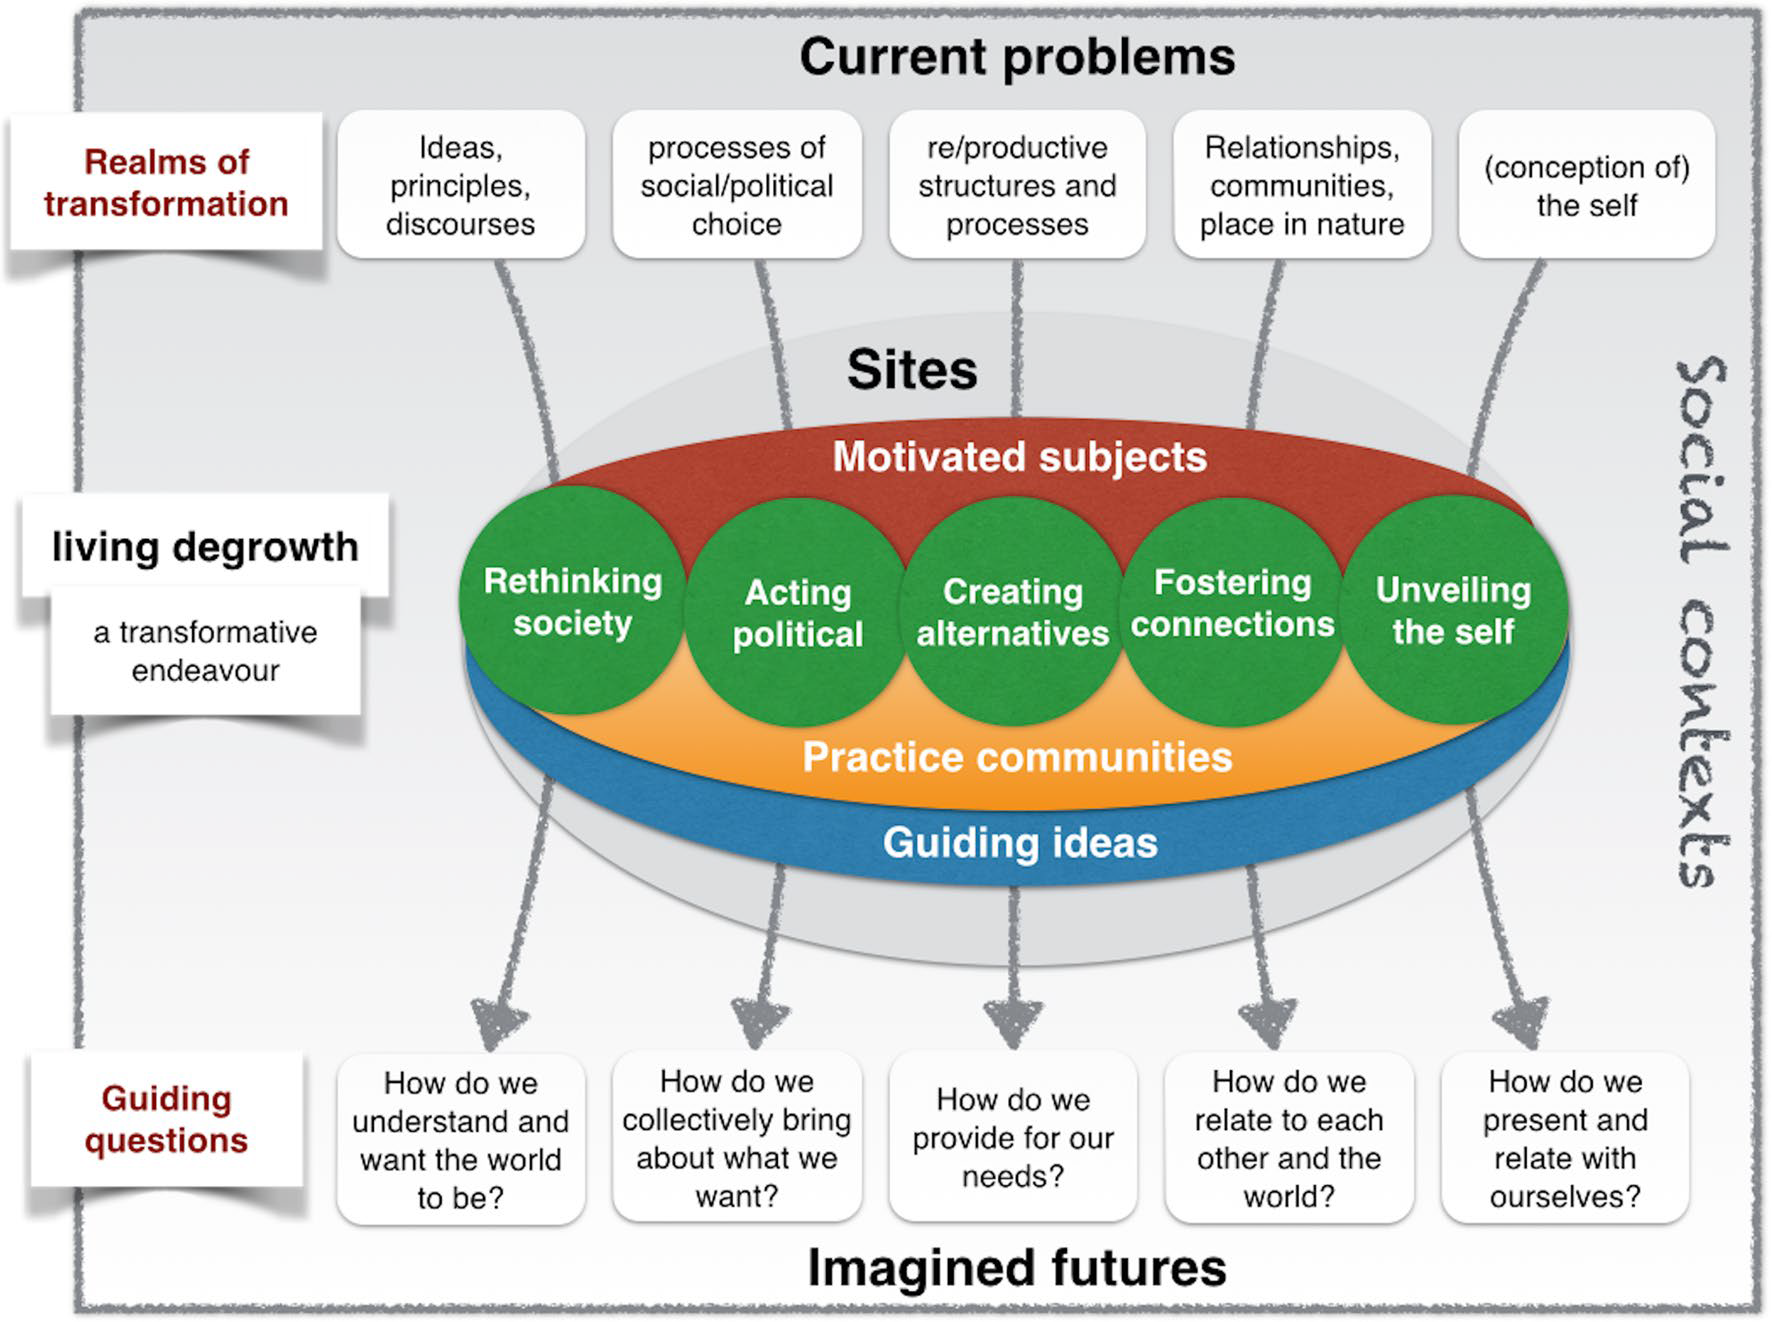
629. Virtuous Spiral (Turnbull 2021)
Sustainability spiral model; a conceptual diagram in which the people-policy sub-cycle empowers local stewardship and improves the effectiveness of institutional stewardship, which combine to drive ecological outcomes in the main social–ecological virtuous cycle. Ecological outcomes result in improved ecosystem services and values, which motivate further stewardship; b spiral model representing multiple iterations of the virtuous cycle over time, progressing towards sustainability goals

631. Life Framework of Values (O’Connor 2019)
ES ecosystem services, NCP nature’s contributions to people
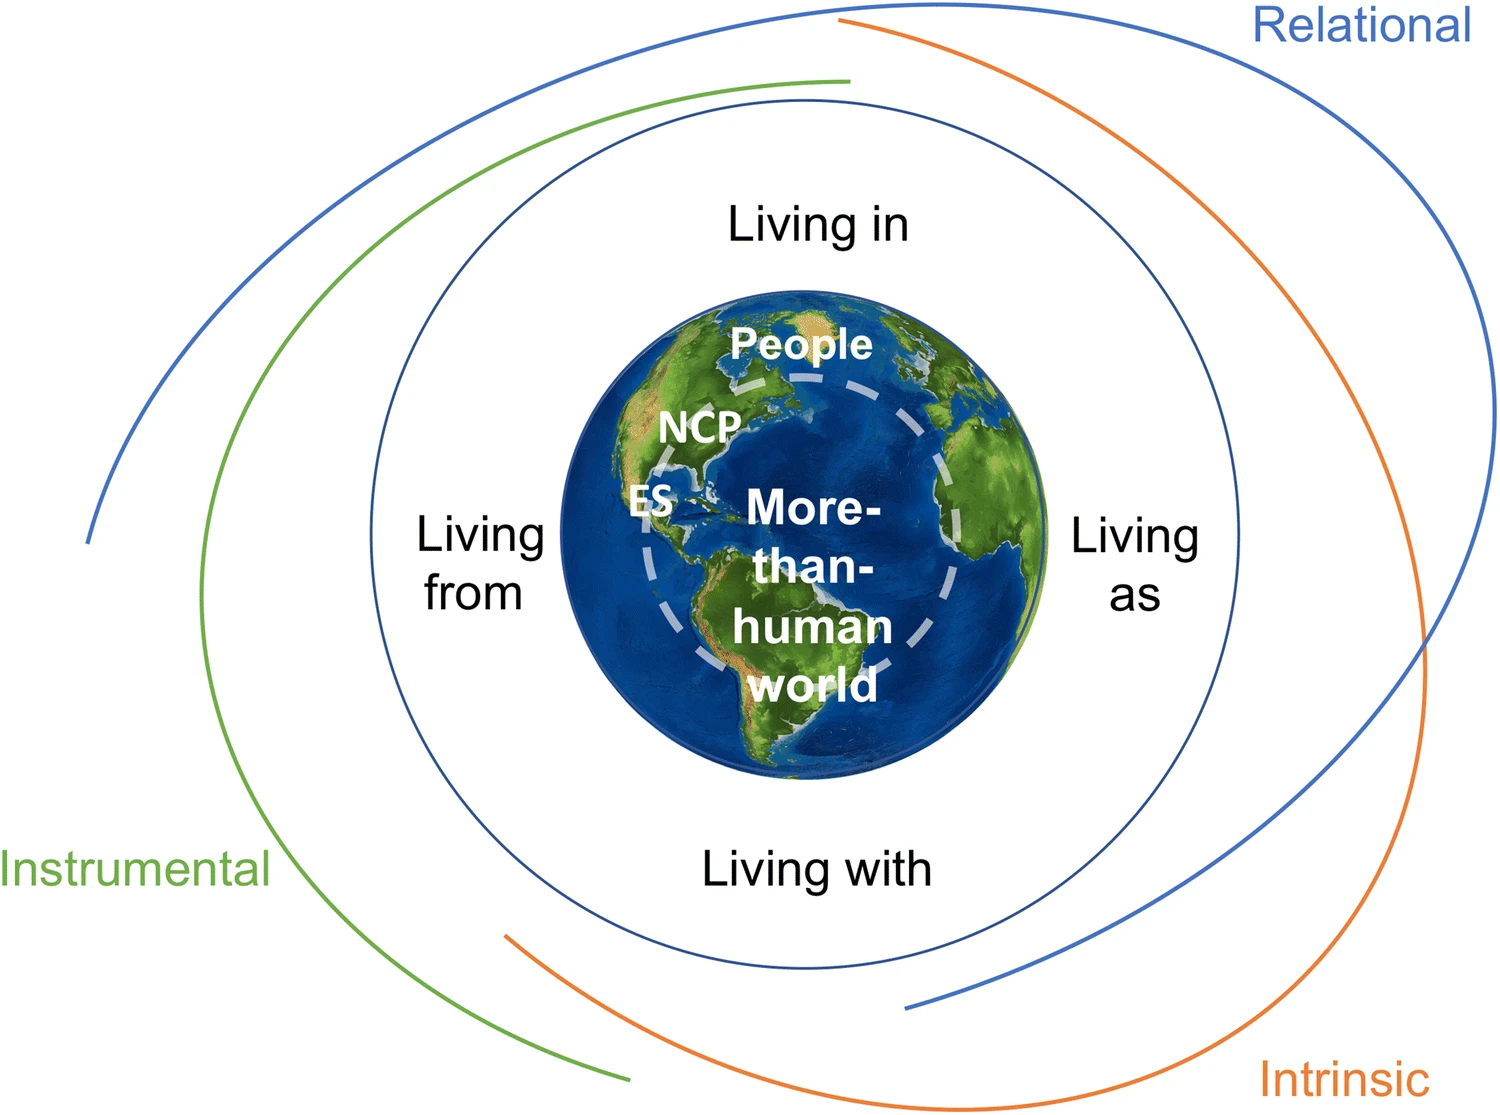
632. Inside-out pathways (Gray 2021)
Cross-cultural learning as an individual deep leverage point to activate three inside-out pathways towards sustainability transformations
(triangles are Nguyen and Bosch’s Five-level iceberg model including inner-worlds)
Theoretical model of cross-cultural learning as an individual deep leverage point to activate three inside-out pathways towards sustainability transformations

633. Expanding egg. Leverage points and biomimicry (Davelaar 2021)

634. Tanglegram of discourses. (Walsh 2021).

635. Sustainable Livelihoods Model (Natarajan 2022)
(has a non-overlapping pillars model at the core).

636. Still Sustainable Livelihoods Framework, now a web of relationships (Chaya 2022)

637. End-goal of environmental peace-building (Dresse 2019)

638. Sustainable Business Model (Lozano 2018)
At its core is a two-pillar model – with no mention of society.

639. Regenerative mindset framework – more than human ethic of care (Seymour 2023)

640. Images of Nature (Heeren-Hauser 2020)

641. Invisible (bio)economies: a framework to assess the ‘blind spots’ of dominant bioeconomy models (Pungas 2023 adapted from the Bielefeld Subsistence approach and Coloniality–
Capitalism–Patriarchy Nexus Mies et al. 1988)

642. Snakes on a plane. (de Vries 2021)
Which ‘confinement’ area allows systems to follow sinusoidal-like patterns? We start with the integration of the time dimension in the previously presented ‘doughnut’ and ‘radar’. This yields a novel cylinder configuration with three zones (Fig. 1), the order, melting, and chaos zones. The melting zone is a hollow cylindrical tube centered around a ‘highly ordered (rigid) zone’. This inner cylinder represents e.g.
the non-vital planet earth that is not able to respond to primary needs. A third, outer, cylinder represents a ‘highly chaotic zone’, e.g. the over-exploited or over-heated planet earth where excessive behavior leads to extreme and irreversible inequalities. Consequently, the melting zone can also be called a safe operating space in socialecological systems (Anderies et al., 2019; Rockström et al., 2009) or fair and safe
operating space (this publication); the latter refers to the reflections on framings of food as a commodity, commons, and human right (SAPEA, 2020). The cylinder configuration allows defining contrasting outcomes – presented as 3 different scenarios – for bioeconomy systems (‘win-lose’ in game theory; like SDG outcomes).
Besides, the other 6 key elements of systems or game theory (Neumann & Morgenstern, 1944) are presented, namely players, pieces, rules, moves, playing fields, and duration/time (the light blue text boxes). The element ‘players’ include all actors in bioeconomy systems (like producers, NGOs, public institutions, citizens); their overall behavior should follow pathways in the green area to reach a sustainable output.


643. Transition toward societal sufficiency (Troger 2021)
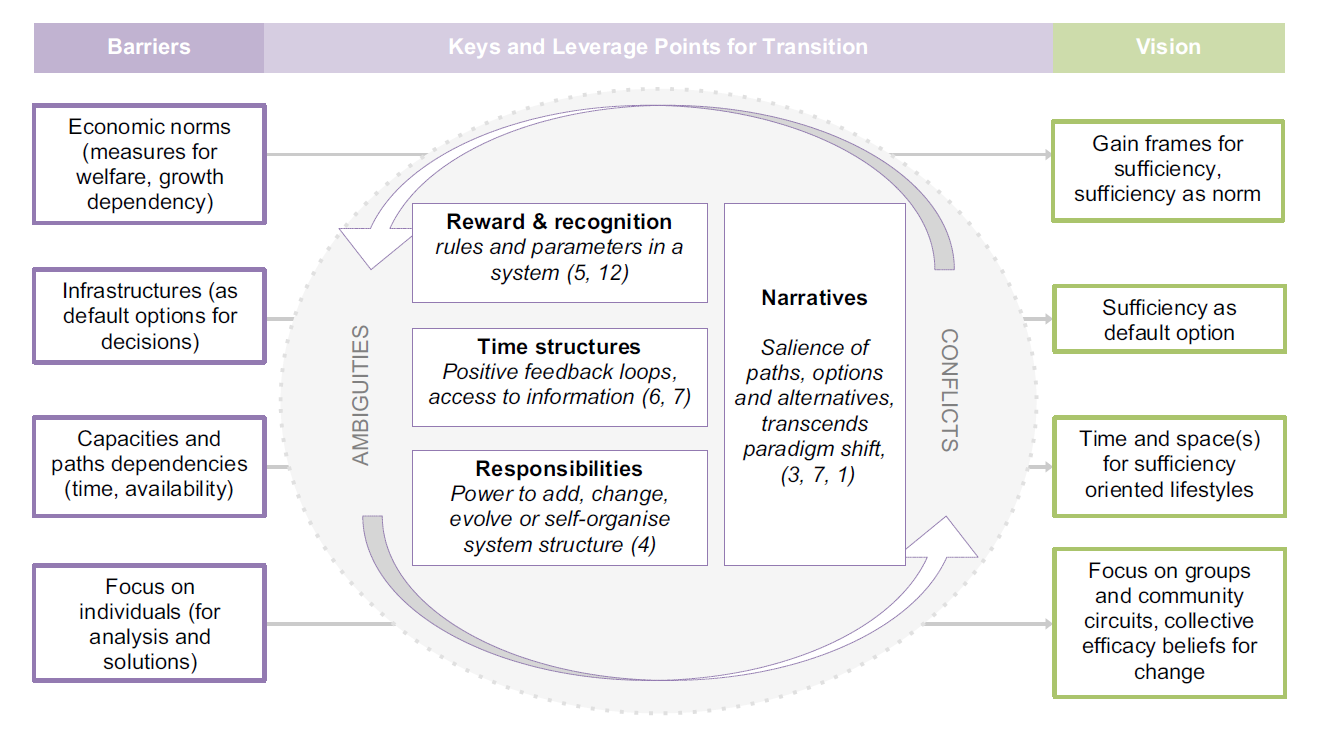
644. Narrative metaphors in business reporting (O’Dochartaigh 2019)

645. Learning for Sustainability Competency Tree (Margarita 2020)
Why a tree?

646. Sustainable well-being society (Hellström for SITRA 2015)

647. Te doughnut Teina Boasa-Dean & Juhi Shareef
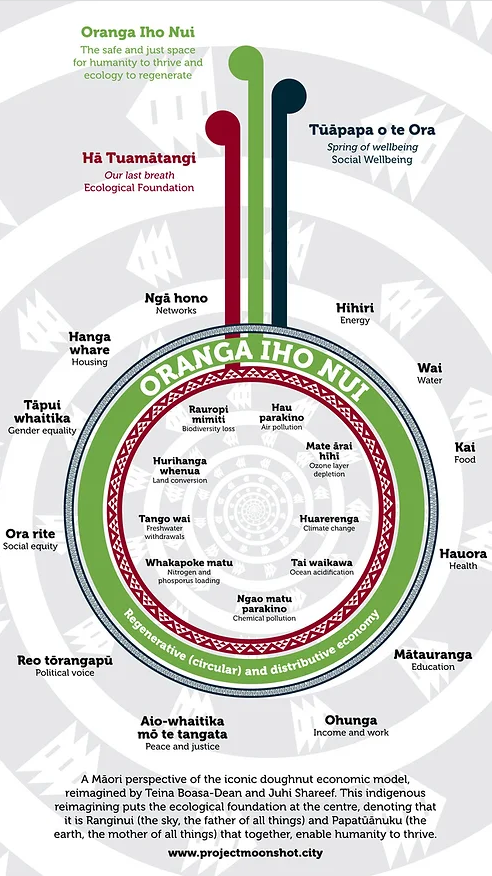
648. Interconnectedness (Lehtonen 2019)
(the straight lines previously described as “problematic dichotomies of modern thinking”)

649. Four Schools of Common Tragedy (Cashore 2023)
Attempting to tighten what they see as loose use of tragedy of commons framing in political science.


650. Prism (Asyraf 2022)

651. Incremental, emancipatory, decommodifying care for feminist degrowth (Dengler 2022)

652. Standardised! (Majerník 2022)

653. Plastic fantastic (D’Amato 2020)
Representation of key characteristics of a sustainability narrative: high degree of conceptual plasticity, quintessential core of archetypical solutions, contextually-tailored implementation

654. Values in transformational sustainability science (Horcea‑Milcu 2019)
OK, strictly it is about a model of sustainability science rather than sustainability itself. But how unnecessarily cute is that?

Adding to the collection of diagrams of sustainability. This time we add dimensions – so a triangle becomes a wedge and a pyramid And spirals and links become a pandemic. We finish with an ontological butterfly.
(19/7/23)
655. PlanetEarth Concept (if the planet is conceived as triangles) (Al-Thour 2016)

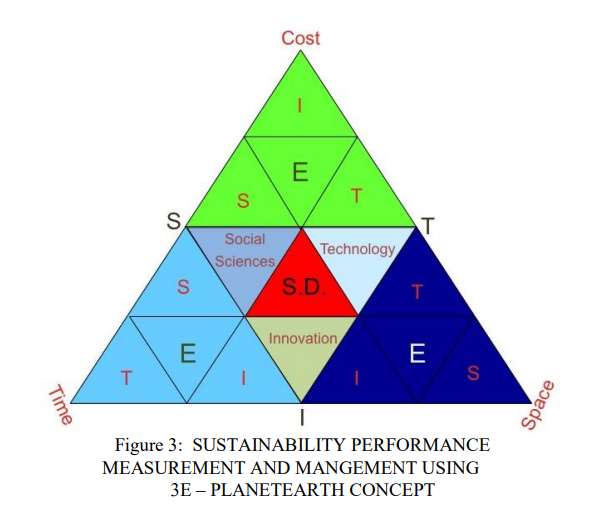
656. Washing machine (Mansell 2019)

657. SDGs on a wellbeing (?) tower (Lucas 2018)

658. Classification wedge (Lukman 2016)

Classification of sustainability oriented terms (updated from Glavi c and Lukman, 2007). CE, circular economy; CP, cleaner production; DE, degradation; EA, environmental accounting; ED, eco-design; EE, environmental engineering; EI, ethical investment; EL, environmental legalisation; EMS, environmental management strategy; ESD, education for SD; ET, environmental technology; FX, factor X; GC, green chemistry; HS, health and safety; IE, industrial ecology; IPPC, integrated pollution prevention and control; LCA, life cycle assessment; M, mutualism; MRU, minimization of resource usage; P, purification; PC, pollution control; PO, policy; PP, ” polluter pays ” principle; PSS, product service system; P2, pollution prevention; RC, responsible care; R, reporting to the stakeholders; RE, recycling; ReE, resource efficiency; RF, remanufacturing; RG, regeneration; RP, repair; RU, reuse; RV, recovery; R2, renewable resources; SCP, sustainable consumption and production; SCM, supply chain management; SD, sustainable development; SmC, smart city; SP, sustainable production; SR, source reduction; SRE, social responsibility; SmS, smart specialization; VEA, voluntary environmental agreement; WM, waste minimization; and ZW, zero waste.
659. Interlinked SDGs (visualisation tool).

660. Synergies and trade-offs (Luanhe Living Lab team 2020)

661. COVID (Zhou 2021)
SDG targets impacts of pandemic in Asia
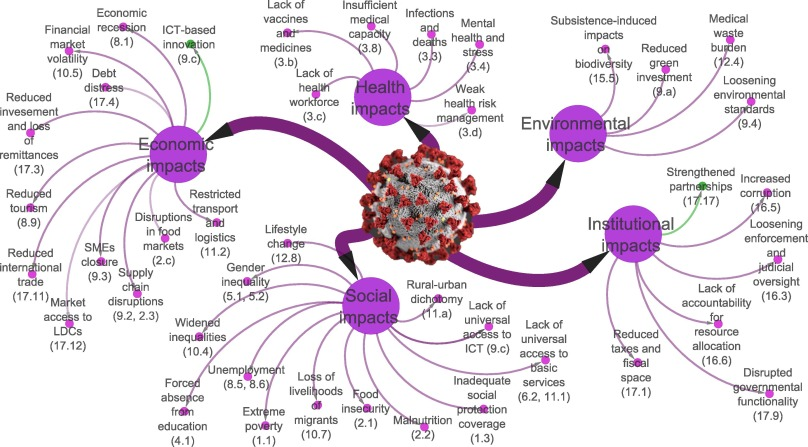
Derived through dashboards

662. Tiny pies filled with trade-offs and synergies (Yang 2020)

In right side of the diagonal, numbers represent the correlation between 2 SDGs and blue circles show significant positive correlations and red circles show negative correlations, both at a P<0.05 level. The left side of the diagonal show the significant trade-offs and synergies between SDGs.
663. Patrimonium (Leus 2018)
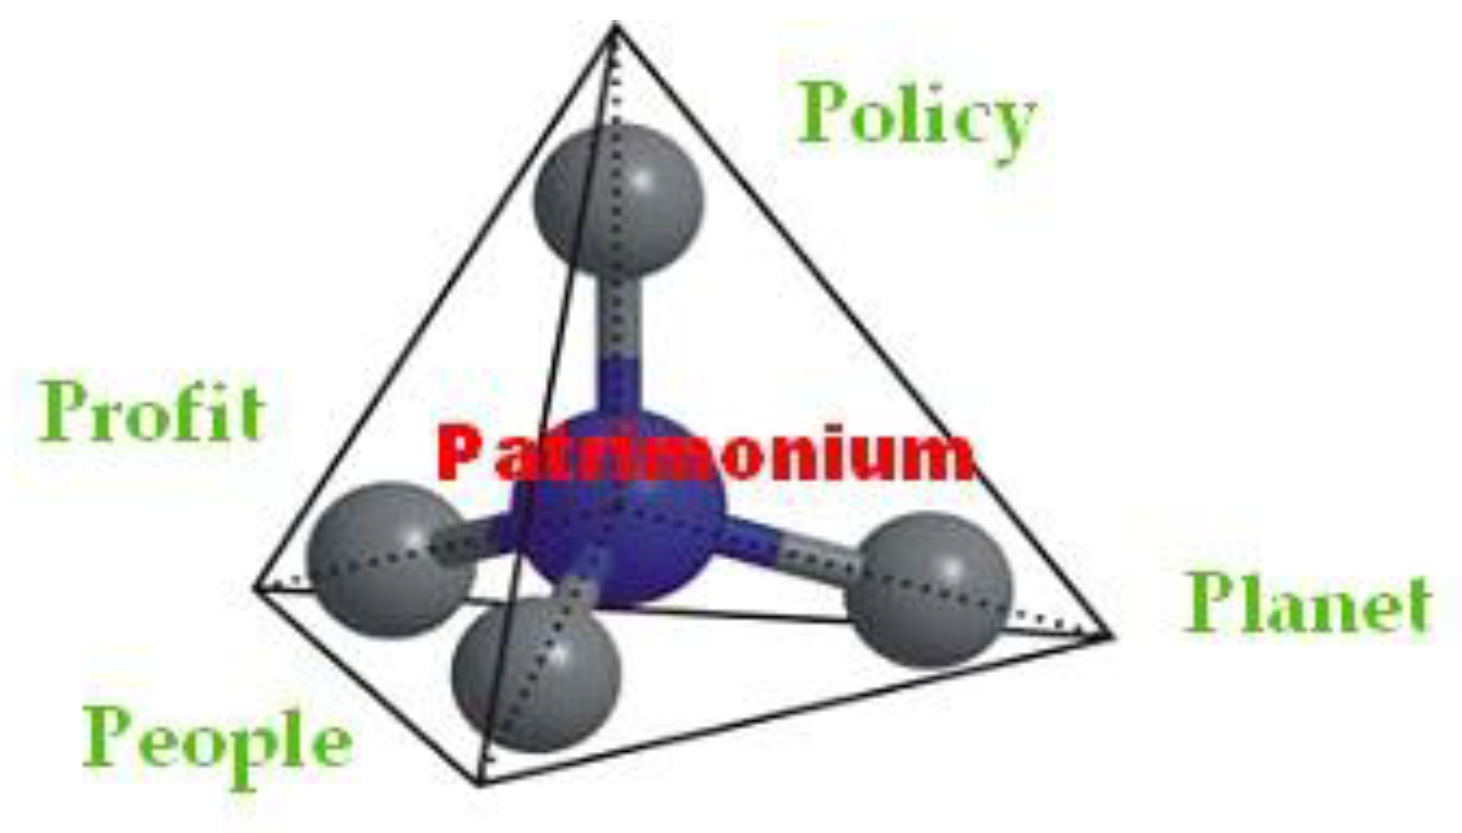
664. Law spheres (Dooyeweerd via Leus 2018)
The modal spheres of Dooyeweerd [10]: When all the law spheres are respected, a good balance and sustainability are received.
Fifteen aspects of temporal reality, or modalities/spheres, or ways of being are distinguished: numerical (quantitative), spatial, kinematic, physical, biotic, psychic (sensitive), analytical (logic), historic (cultural), communicative, social, economic, aesthetic, juridical, ethical, and pistic (faith).
The first three modal spheres (numerical, spatial and kinematic), are the most fundamental and determinative ones. The higher in the ranking, the more the normative character is highlighted. The highest modal spheres (e.g., pistic, ethical, legal), are based more on human value judgments than the lower ones. The spheres refer to each other by anticipations and retrocipations. In this way, one modality is metaphorically described by the idiom of another [9] (p. 109). Heritage, for example, can be described on the basis of economic value, which in turn can be expressed in price (the numerical aspect). Such a “backward” relationship, although it is accompanied by the loss of a certain meaning, is called a retrocipation by Dooyeweerd. Additionally, in the reverse sense heritage is anticipatory, related to the legal, ethical and pistic aspects, for example in the form a protected monument prescribed by law, a site that is accessible to everyone, or a memorial, thus gaining in significance. Dooyeweerd considered this system of modal spheres, anticipation and retrocipation, the “cosmic order of time”.
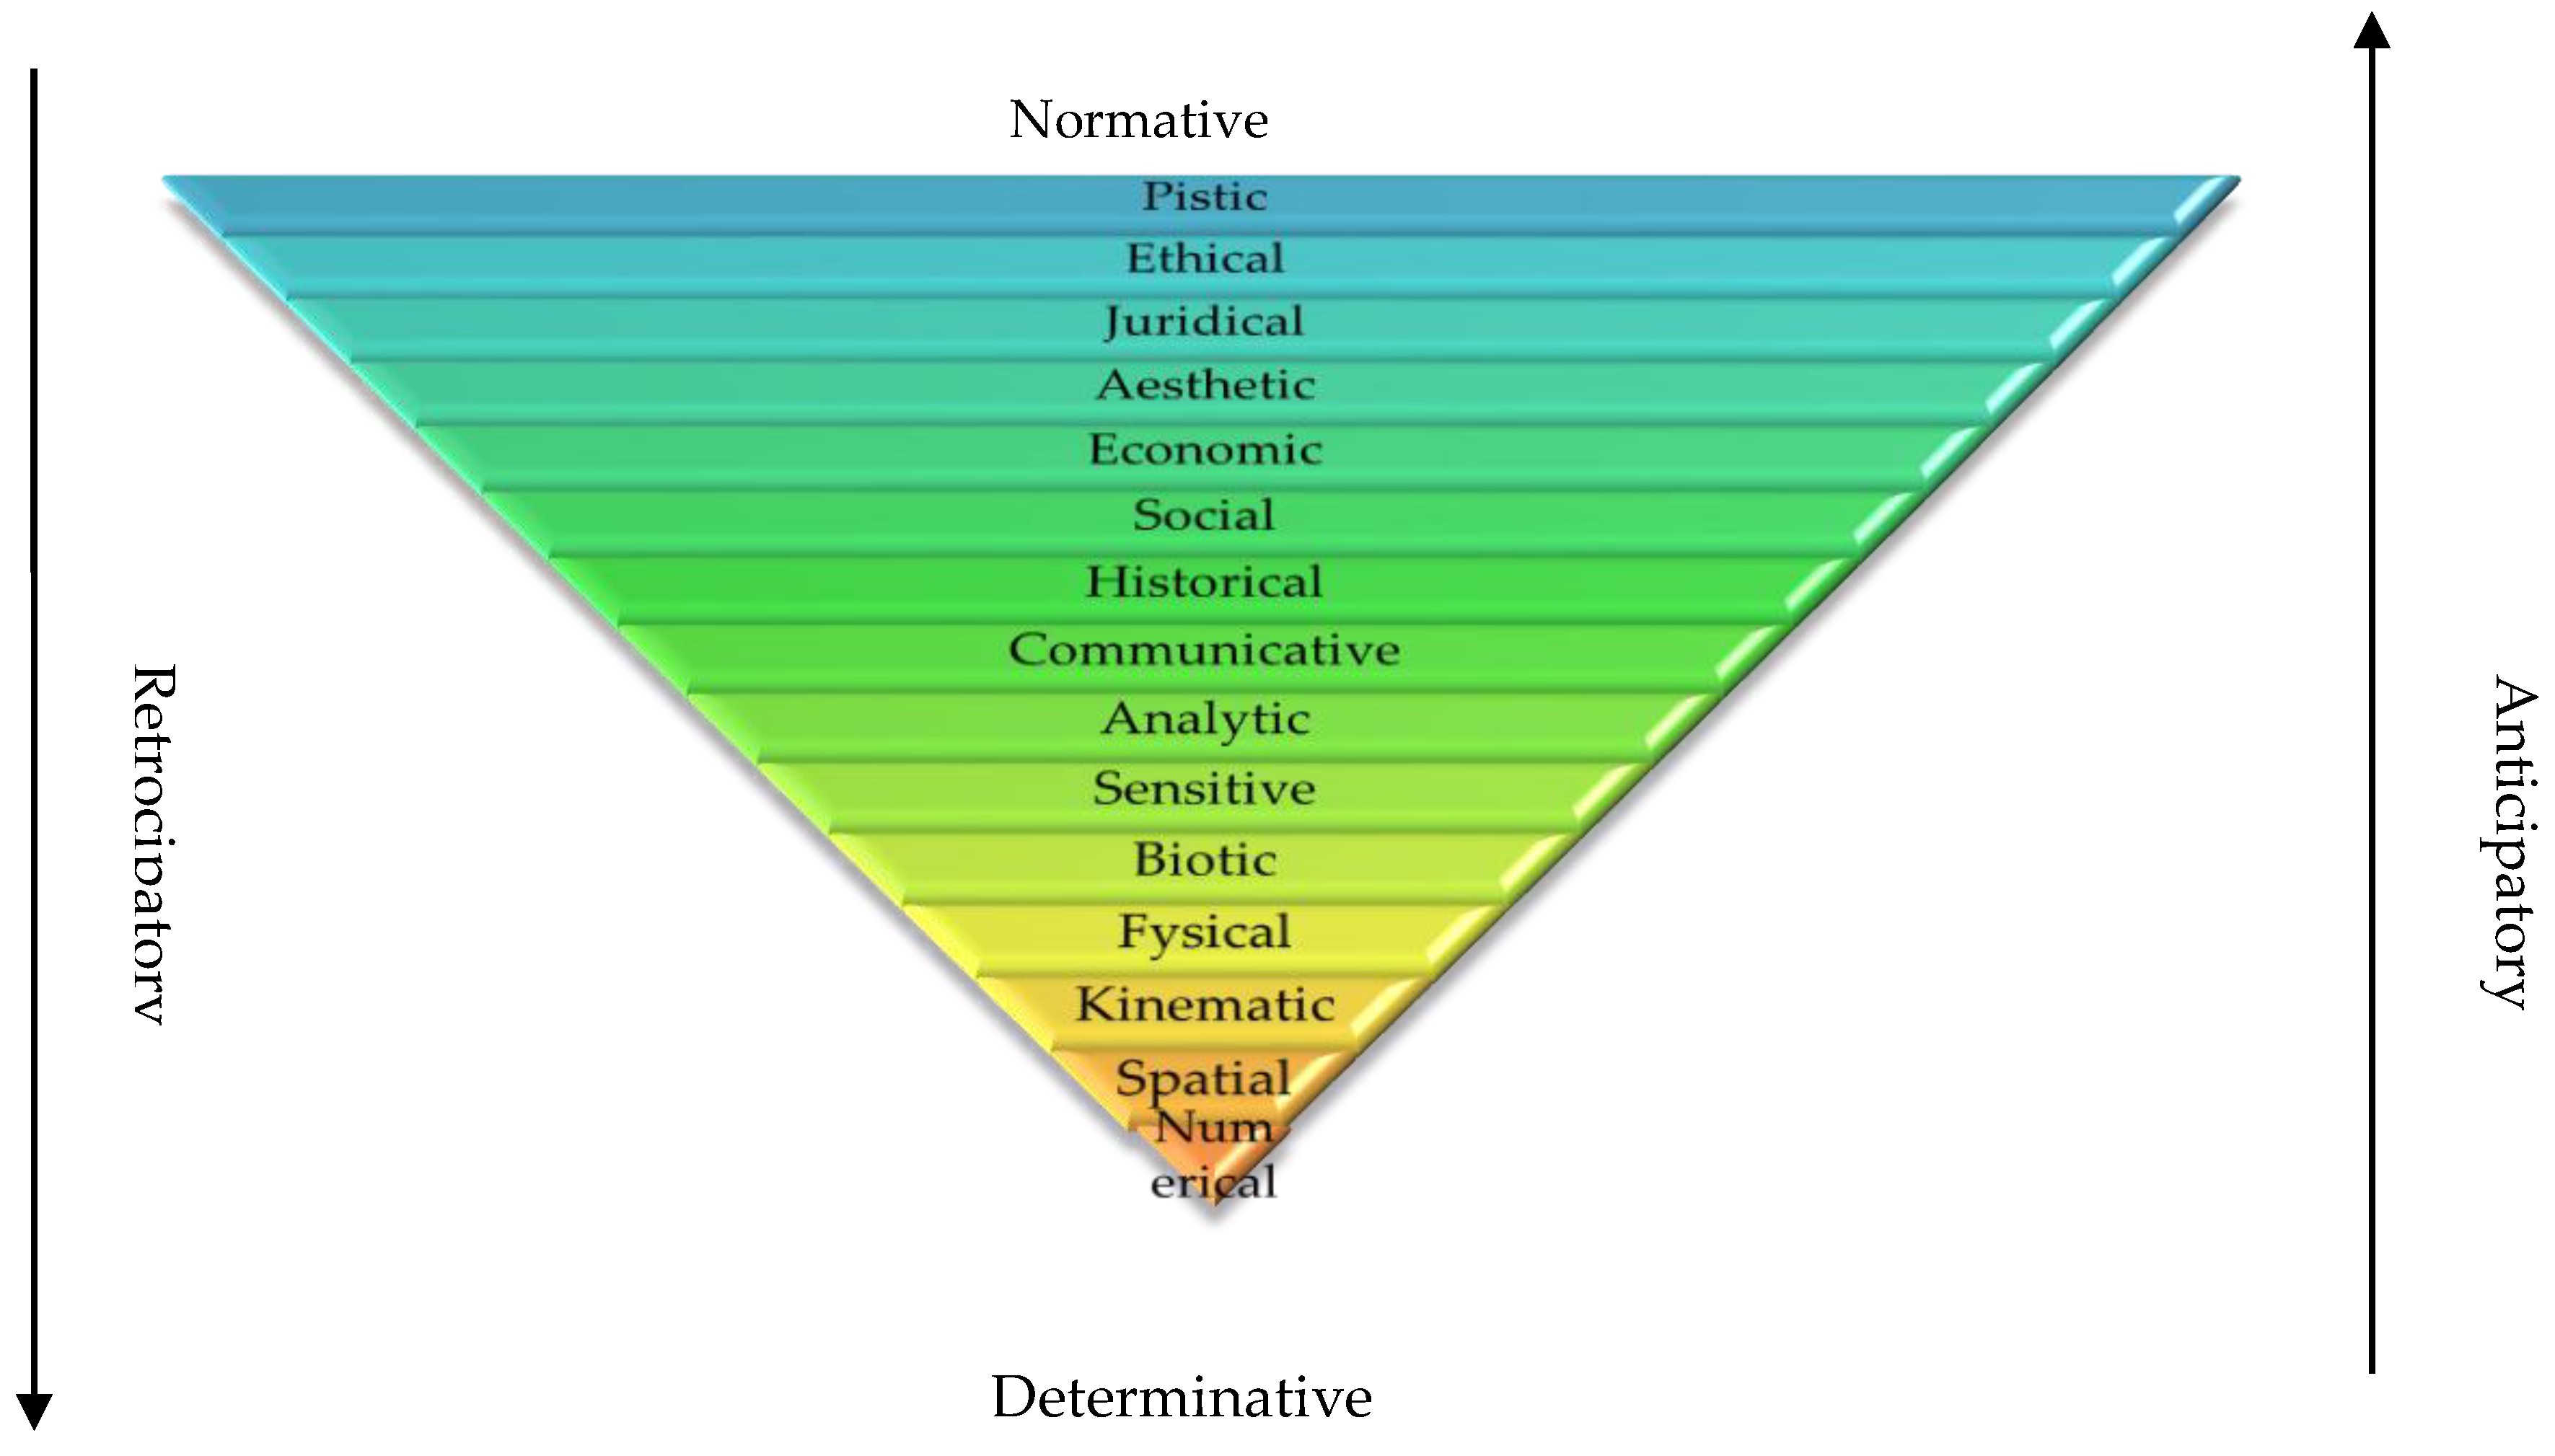
665. New European Bauhaus (European Commission 2023)
(yes I know, not really sustainability per se)

666. A two-dimensional intentional faith development matrix (Martinez 2017)

667. That’s Absurd! (Longyu Shi 2019)
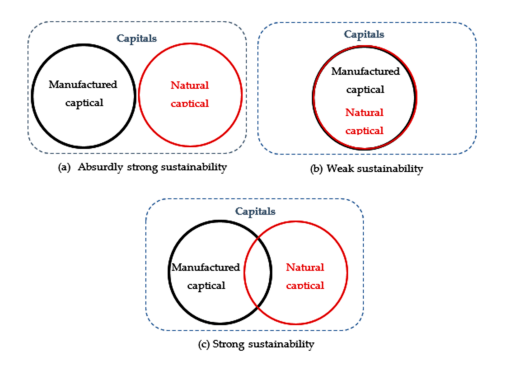
668. Planetary Health Education Framework (Guzman 2021)
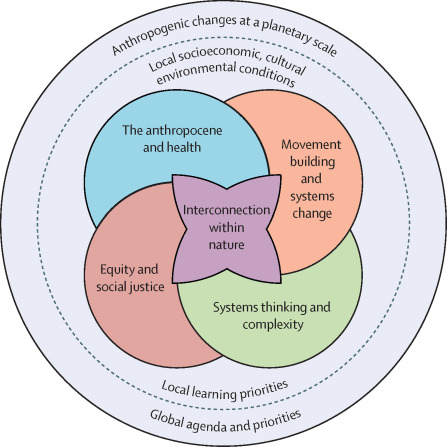
669. COVID as transformative disruption to move from weak to strong sustainability (Aragón de León 2021)
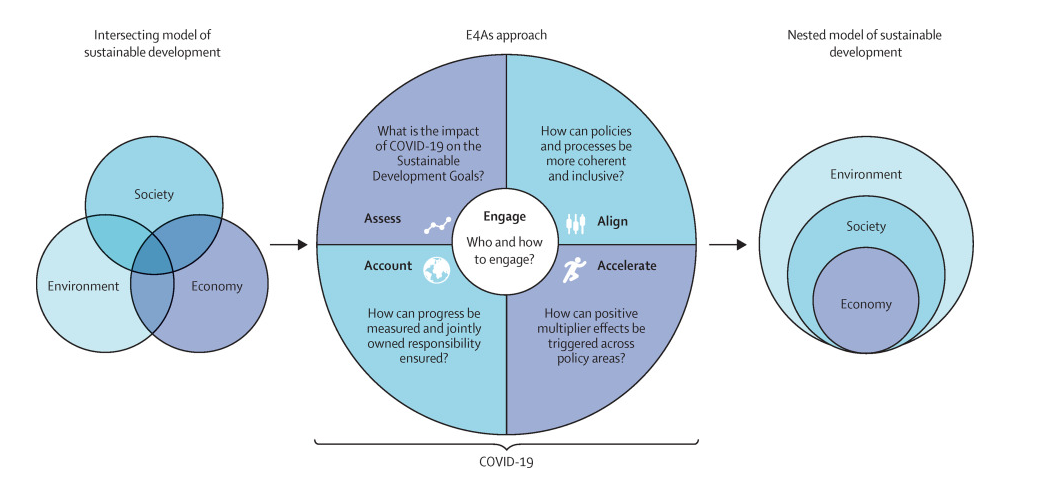
670. Planetary health literacy (Jochem 2023)

671. Model for understanding sustainability in sacred places (Shinde 2023)
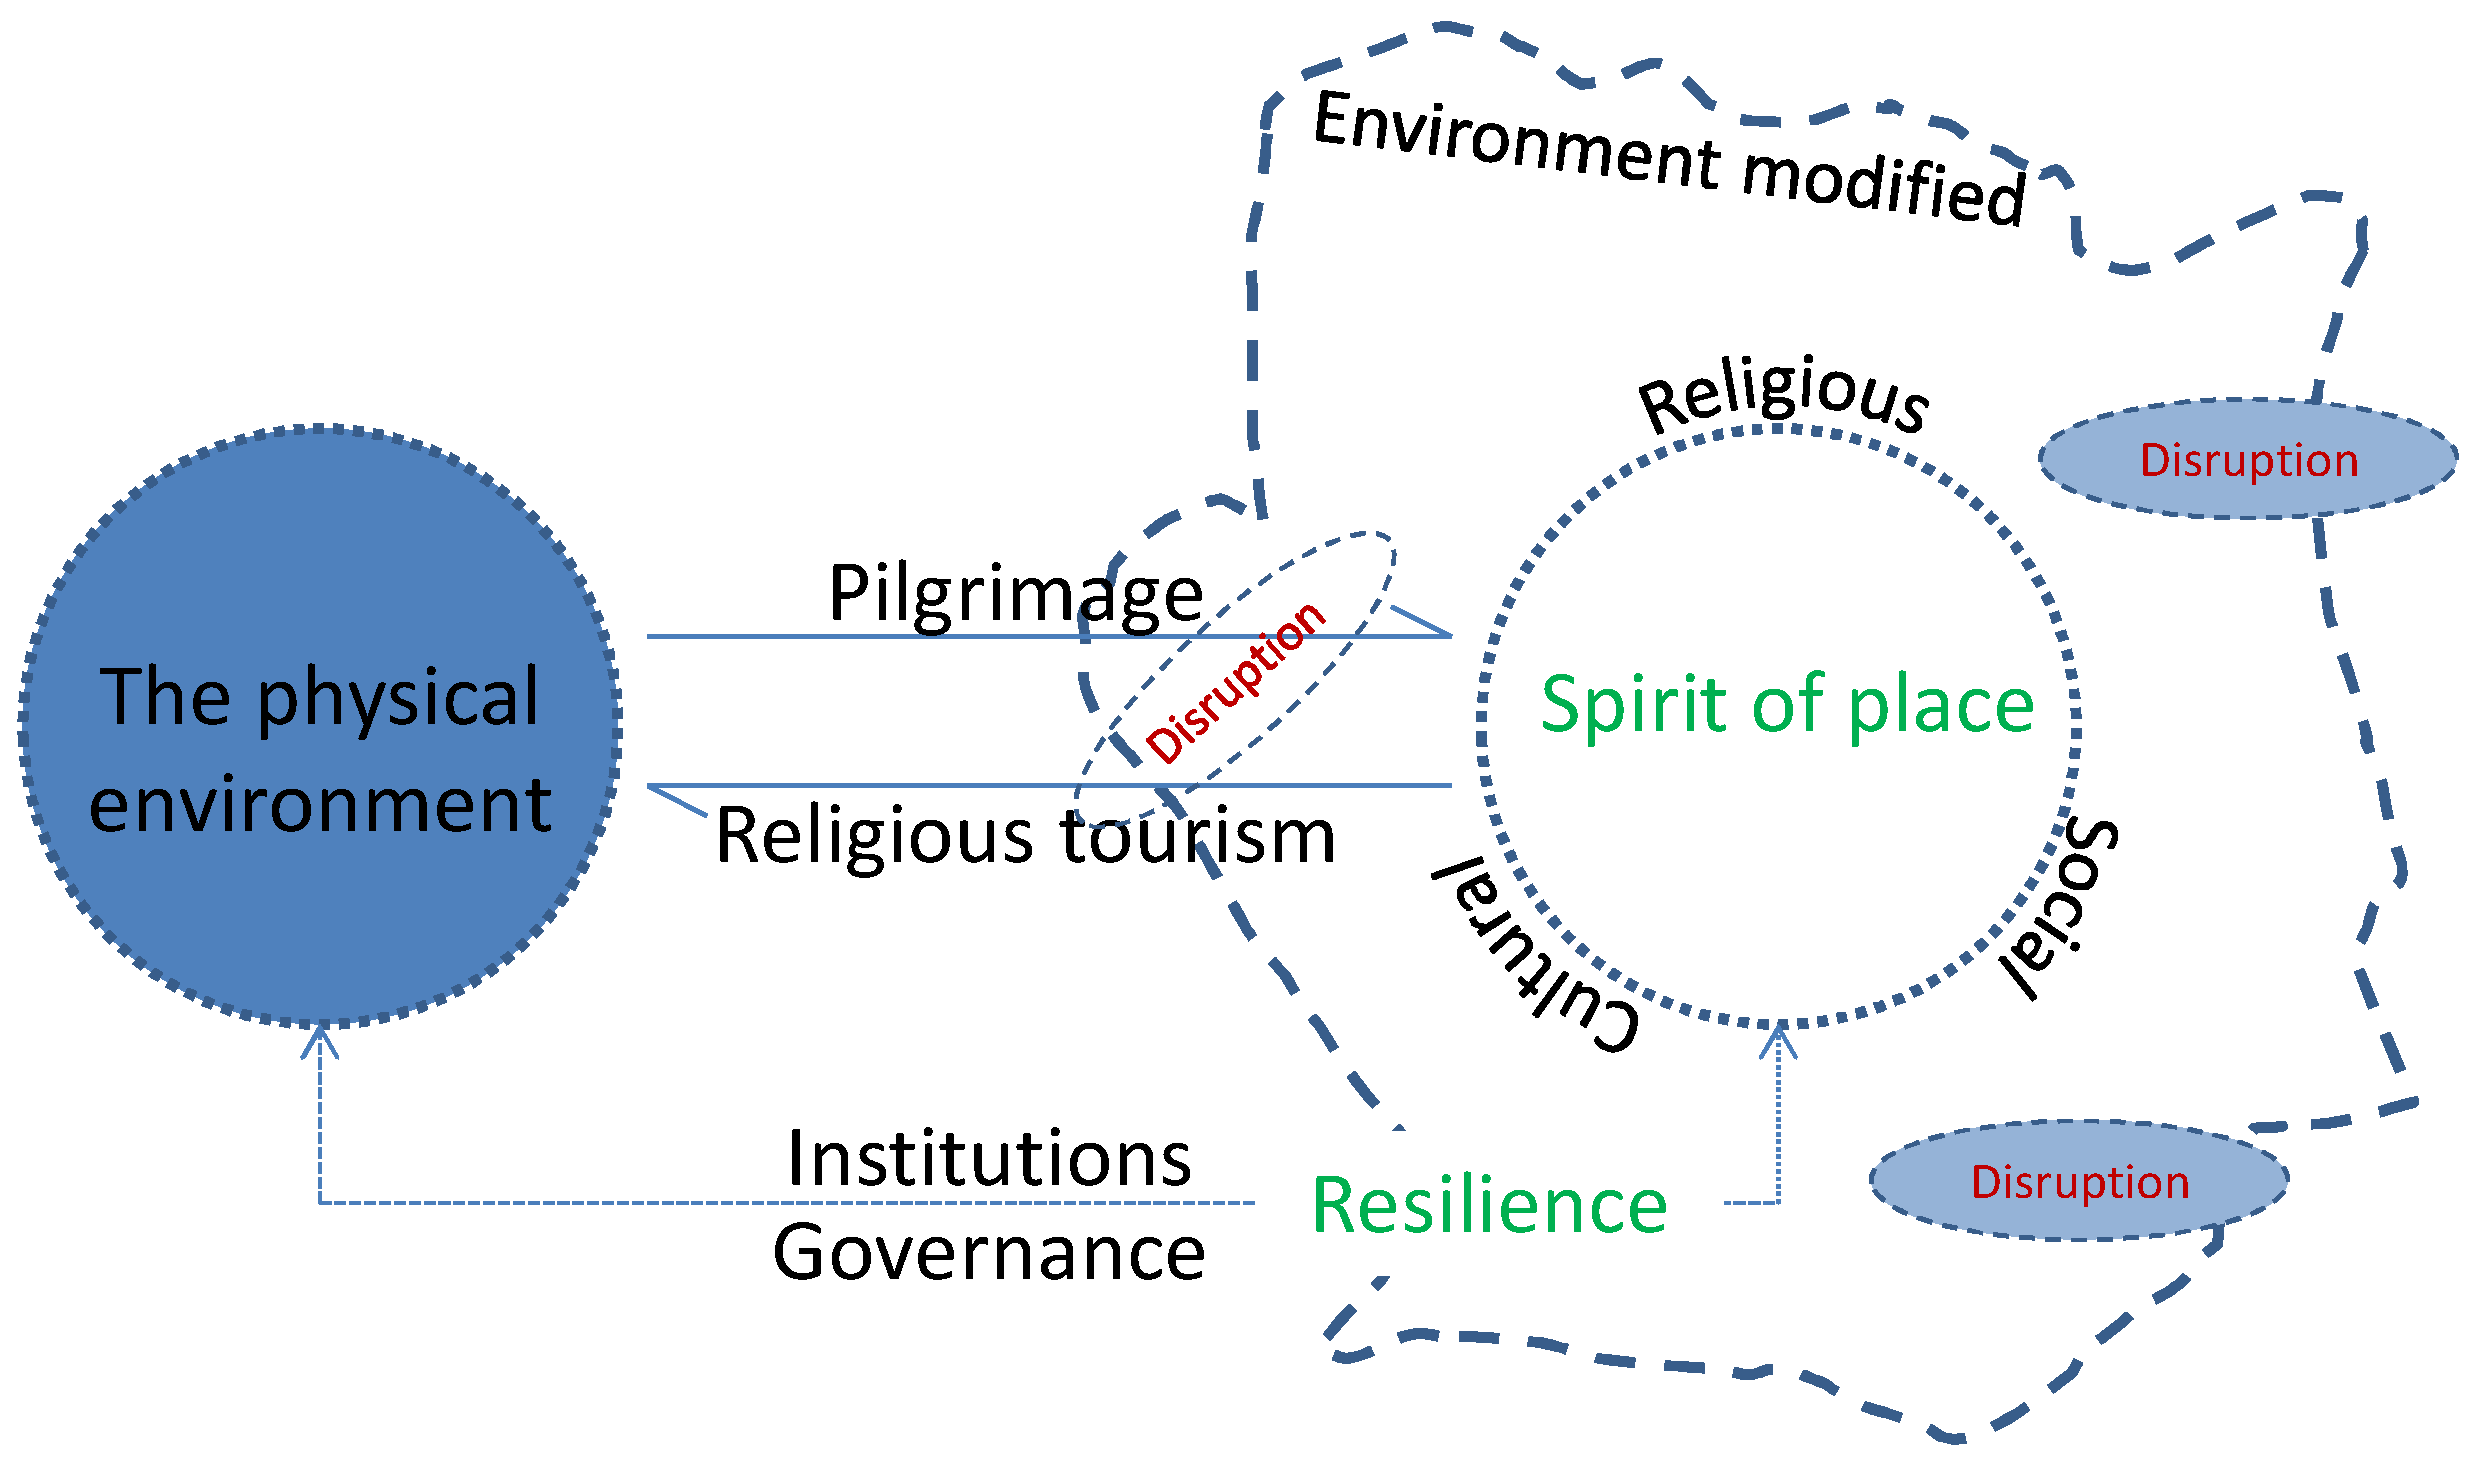
earlier: Shinde 2019

672. Global issues in balance (origin unknown, maybe this defunct)

673. Traversal transformations (Goyeneche 2022)
Move towards a focus on how SDGs are enabling transformative change. A conceptual approach is presented based on the notion that research should build bridges across three types of SDGs: ones that reflect socio-technical system change, directionality, and framework conditions.
A first type is SDGs which we refer to as “socio-technical systems” that describe areas of provision of basic needs…The second type is SDGs that express new social and ecological directionalities that need to be incorporated in the process of socio-technical system change. These directionalities are captured in the following SDGs: No Poverty (SDG 1); Gender Equality (SDG 5); Decent Work and Economic Growth (SDG 8); Reduced Inequalities (SDG10); Responsible Production and Consumption (SDG 12); Climate Action (SDG 13) and Life on Land (SDG 15). In Fig. 1 we use the notion of traversal directions because these directionalities need to intersect with socio-technical systems. The third type of SDG refers to the requirement for wider participation and networking across actors which assumes specific governance and political conditions in which societies can discuss, negotiate and navigate different transformational trajectories of development
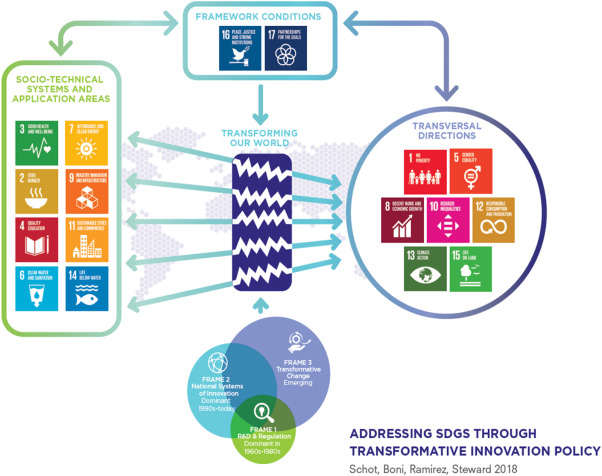
674. Venn but with focus on intersections (Saviano 2019)

675. Sliced silos (Saviano 2019)

676. Sustainable Pyramid Mediterranean Diet (Serra-Majem 2020)
(Yes, I know, not really defining sustainable, but note that wine is considered foundational)
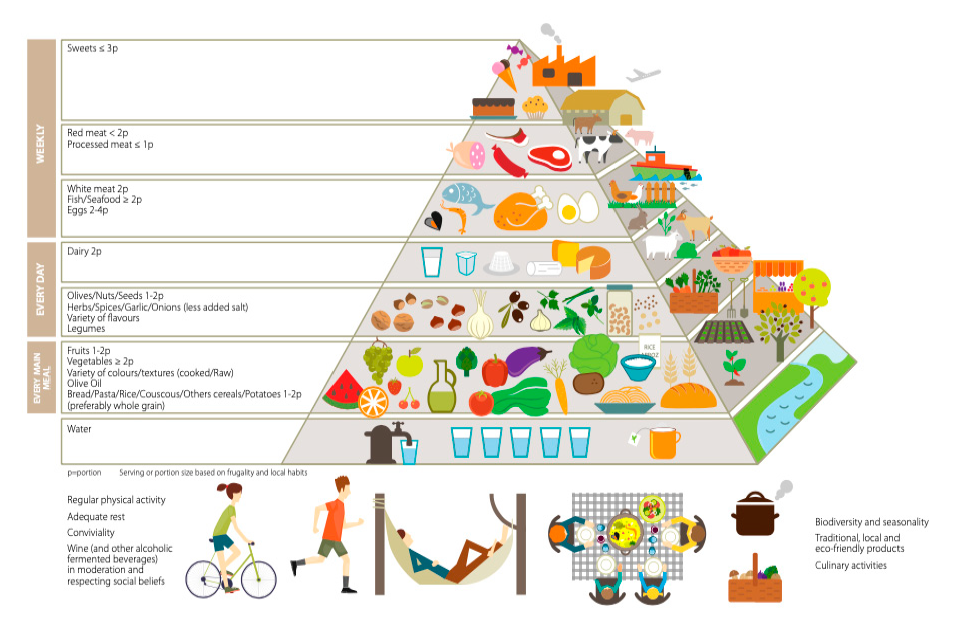
677. Geological and archeological timeframes (Allen 2020)


678. Role of AI in sustainability (plus a forest with Goldilocks’ bears) (Vinuesa 2020)

679. Strong sustainability with flows, and bonus opportunities for teaching chemistry (Elschami 2020)

680. (un)Certainty and agreement (Messerli 2019)

681. SDGs in a space of transformation (Messerli 2019)
Progress in human well-being is closely connected to the state of the natural environment, and vice versa. The space for moving to a sustainable development trajectory lies at the interface between these two components of the Earth System (panel A). Currently, however, the world is not set on a trajectory that lies within this space.
The 2030 Agenda for Sustainable Development defines a political space within which United Nations Member States have committed themselves to managing both the relationships among human beings and between human activities and the planet. That space is delineated by a set of social targets that define human wellbeing and capabilities, as well as environmental targets to secure nature and the global commons (panel B).
As those social and environmental targets are intractably linked, it is not possible to carry out one intervention without influencing another. Therefore, choices need to be made with respect to balancing the gains and tradeoffs of all activities. The overarching objectives provide essential guidance for making choices (panel C).
Achieving more equitable and balanced development within the political space of the 2030 Agenda is
possible only by engaging with the systems that connect people and nature to their guiding goals (panel D).

682. Sustainable just peace (Sachs via Snauwaert 2017)

683. Bonded Biocosmology. (Onyeali 2023)
Autonomy is self-referential and makes us internalize our environment and restructure it in reference to ourselves. The biocosmos, seen from this perspective, is like an ecological fabric, a dress around the human being who has extended his/her boundaries to the periphery of the biocosmos. And so, with one hand, nature provides for us, and with the other hand nature challenges us, which is necessary for our growth. Correspondingly, with one hand we receive the gifts of providence, and with the other we ward off erosion, entropy. The result is a balanced relationship between humans and nature, as schematically depicted in Figure 1, which summarizes this balanced relationship based on the concepts outlined in this article. These principles form the basis of what could be called biocosmology.

684. New Sustainable? (Gibbons 2020)

685. Flows lens as regenerative framework rubric (Middleton 2020)

686. The necessary guilty trap (Lin 2020)

687. Regenerative spiral (Gibbons 2018)
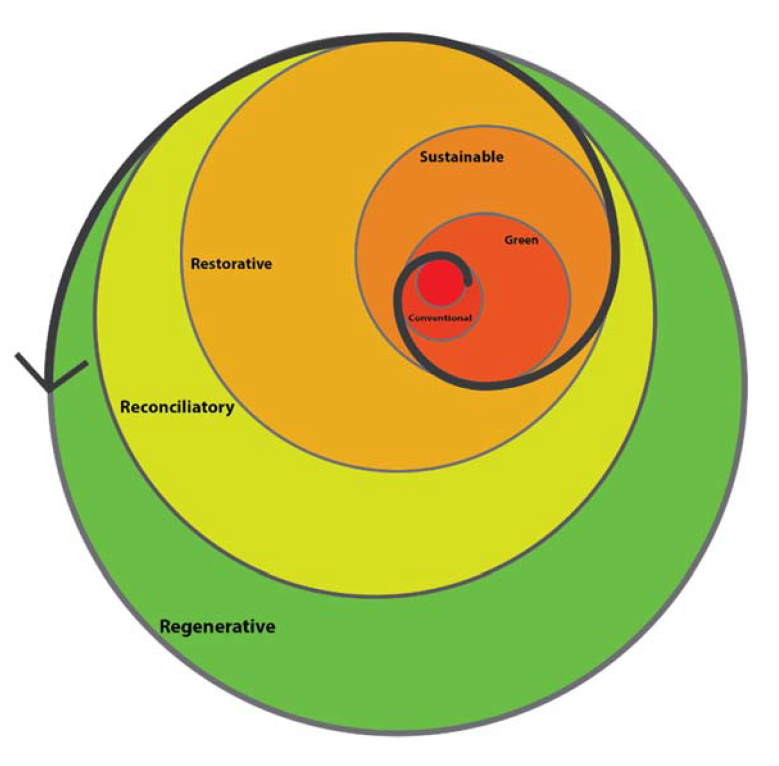

688. Ethical paradox at core. (Jabareen 2008)
The concept of ethical paradox rests at the heart of this framework. The paradox between ‘sustainability’ and ‘development’ is articulated in terms of ethics. In other words, the epistemological foundation of the theoretical framework of sustainable development is based on the unresolved and fluid paradox of sustainability, which as such can simultaneously inhabit different and contradictory environmental ideologies and practices. Consequently, SD tolerates diverse interpretations and practices that
range between ‘light ecology’, which allows intensive interventions, and ‘deep
ecology’, which allows minor interventions in nature.
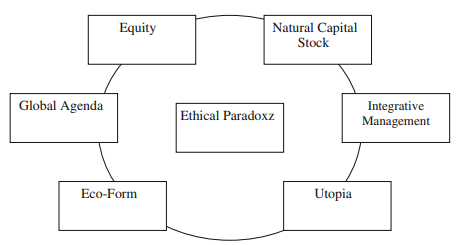
689. Flourishing within boundaries (Casarejos 2020)

690. Regenerative ideation (Ibrahim 2022)

691. Natural Social Contract (Huntjens 2021)
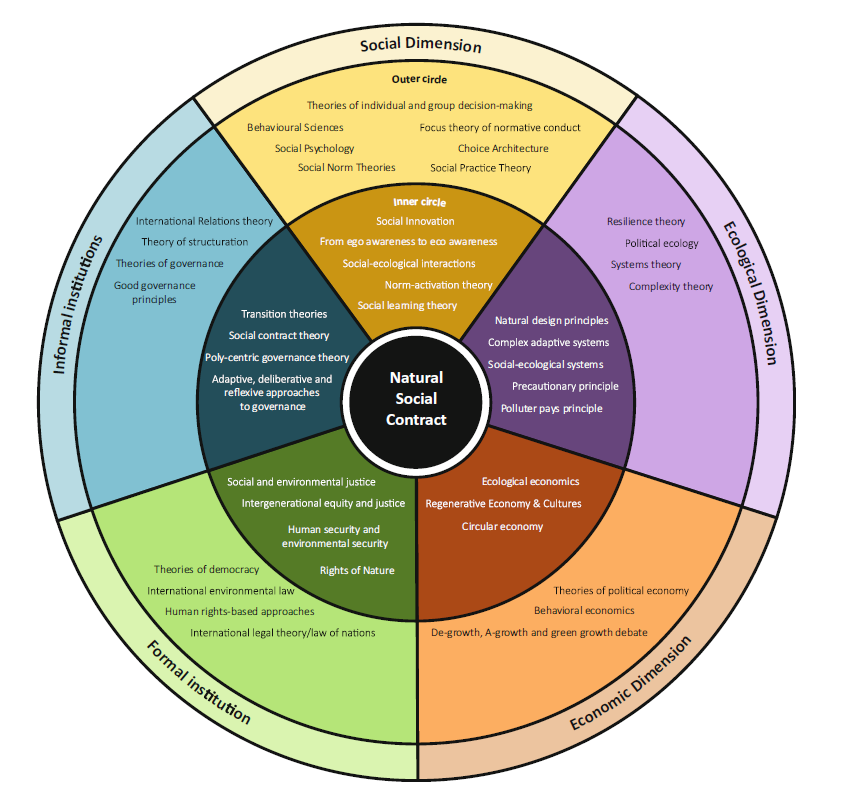
692. From ego to ego (Scharmer via Huntjens 2021)

693. Corporate sustainability moving from current to sustainable (Bolis 2021)

694. Internal/External and Current/Future Value (Sadovska 2020).
Applied in agricultural sector

695. Societal Satisfaction (Deleryd 2020)
The sustainability model: Balancing economic, societal, and environmental sustainability
to achieve societal satisfaction and sustainable success – the new ultimate measurement of quality
and purpose of organisations.

696. Symbiosis in Development (Except, Bosschaert)
It’s a Venn, but not as you know it.

697. Resource light (Liedtke 2015)

698. Transformative Change (UNRSID 2017)

699. Sustainability governance (Iribarnegaray 2012)

700. Sustainable Growth (sic) Wheel (Hoyer 2016)
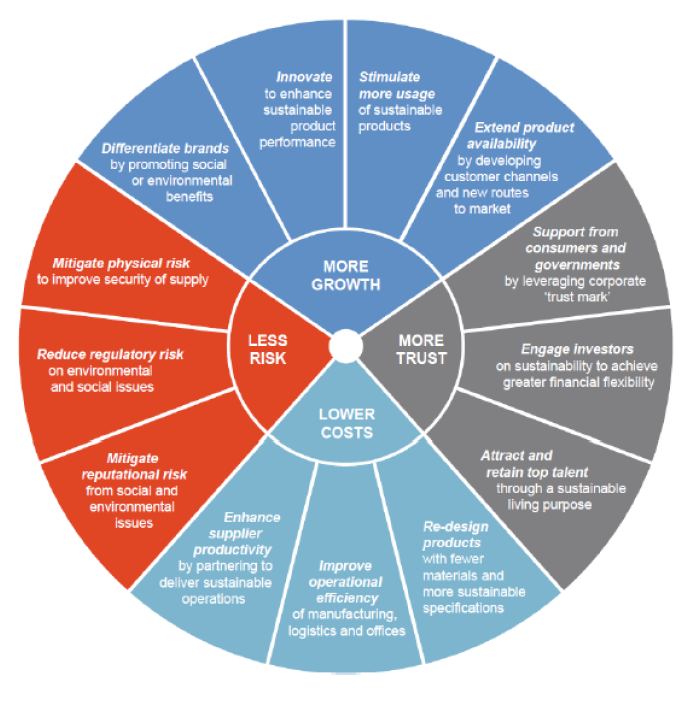
701. Ontology of the knowledge domain of risk, resilience and sustainability (Nielsen 2021)
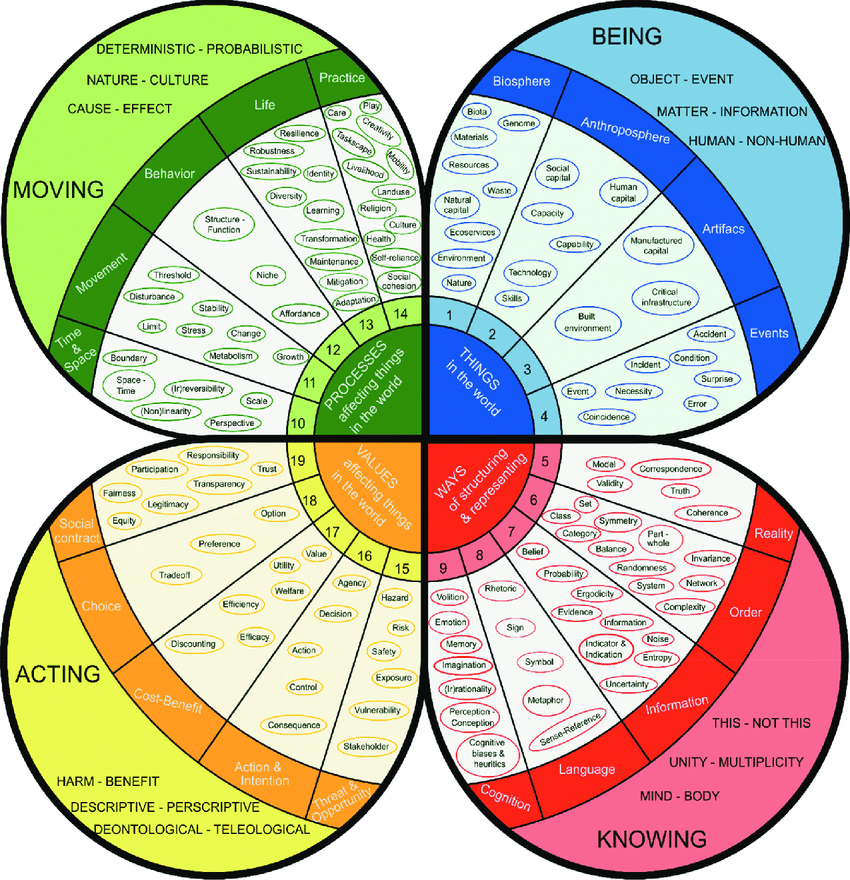
1/9/23
702. Yesterday and today (Hedstrom 2017)

703. Between society and nature (Griessler 2005)

704. Just Acting (All the world’s a stage…?) (van der Jagt 2021)

705. Five elements of the Vastu Shastra
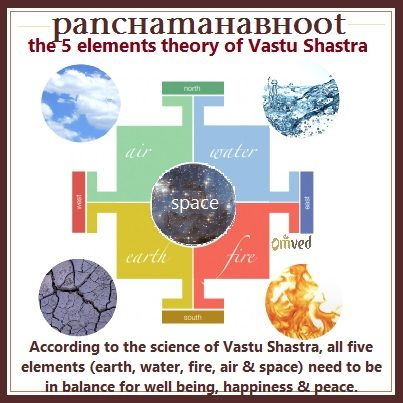
706. On hearing all of them, the banyan tree said, “No life is possible without any one of you. So, none of you is superior to the other”. (Brainkart)

707. Chinese 5 elements (Donr484 Wiki Commons)

708. Alternative levers (Duflot 2021)
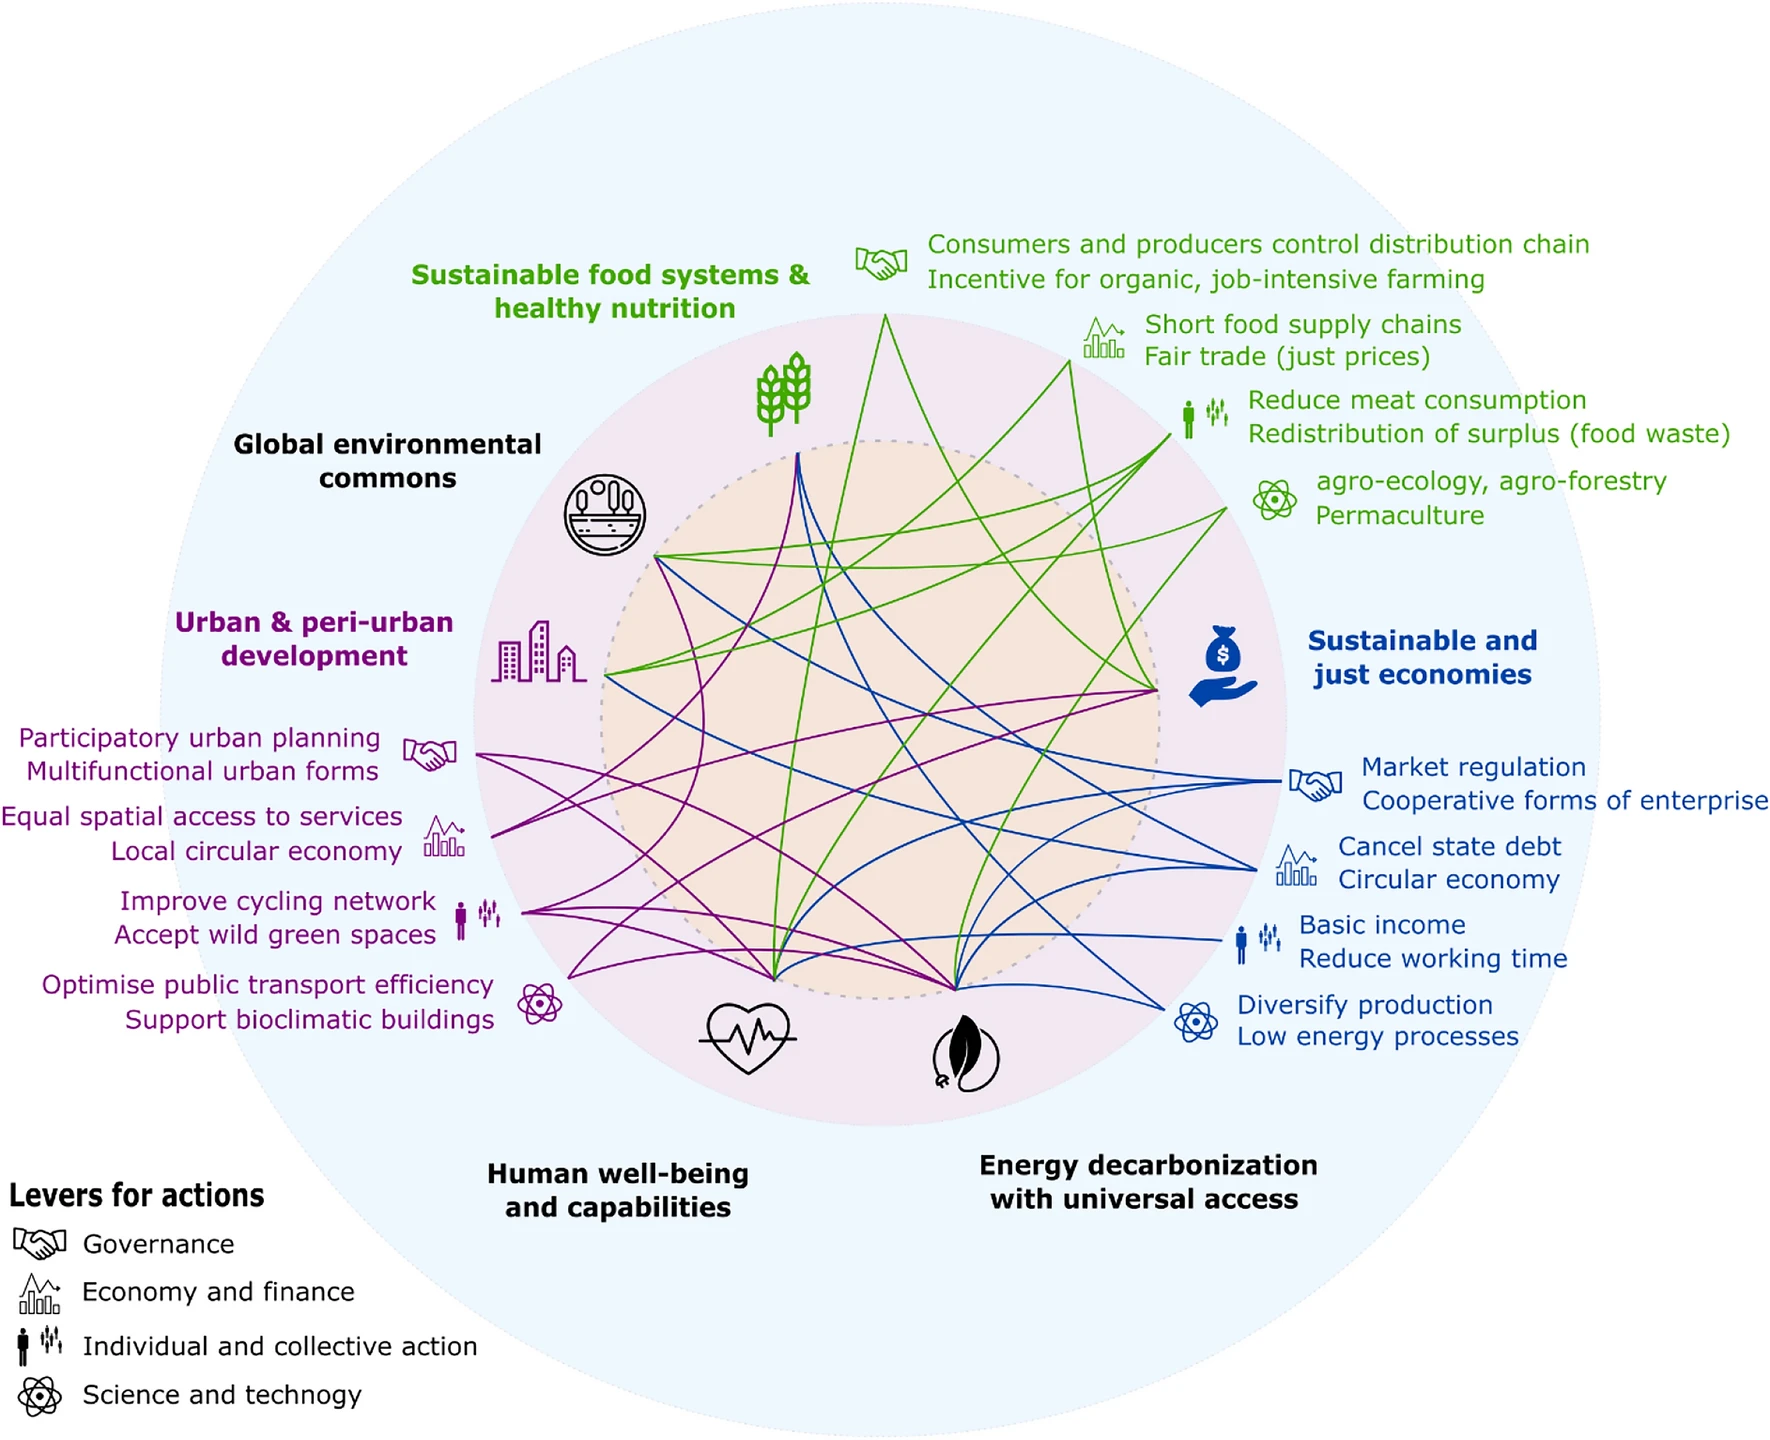
709. Cube of pillars (Szetey 2021)
Axes representing the conceptual space in which the pathways sit. Each axis represents one of the dimensions of the Sustainable Development Goals (people, planet, and prosperity). One pathway sits at each outer vertex of a hypothetical cube on these axes, and there is a pathway at the approximate centre point of the cube representing Business As Usual (BAU). The vertices are color-coded to represent the dimensions which are prioritized for that pathway: yellow–prosperity; green–planet; and blue–people. LSP 5 and BAU are not color-coded as no dimensions are prioritized in these scenarios

710. Competencies (Wiek and Redman 2011, via Brudiers 2021)

711. It’s all agile really (López-Alcarria 2019)
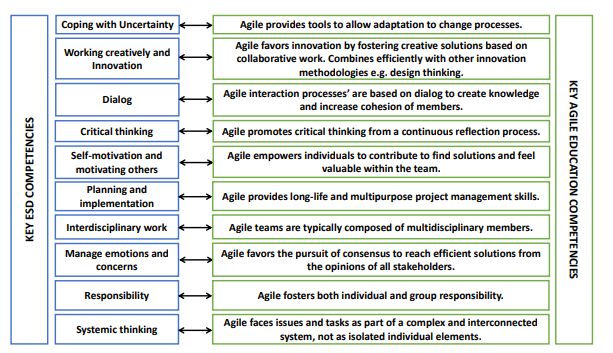
712. Positive psychology (Corral-Verdugo 2012)

713. Daly Hourglass (Baue 2017 – also describes the process of model development from Daly)
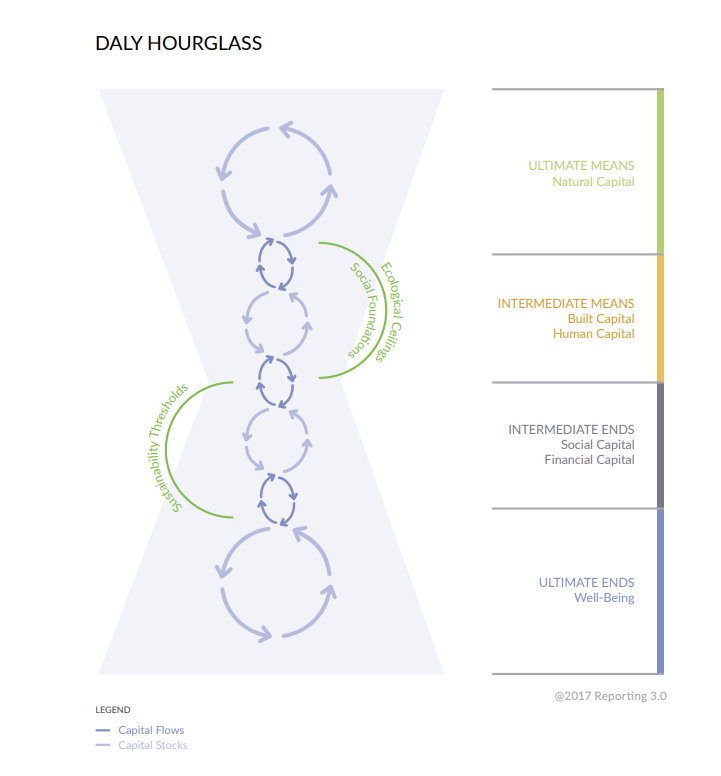
714. True earnings (KPMG) (see also Cooper and Senkl’s 2016 feminist review)

715. Science versus context (McElroy 2015)
Context-based metrics, as indicated, always bring allocations to the table and are otherwise science- and/or ethics-based. Only context-based measures, therefore, make it possible to set goals for, and assess performance against, organization-specific sustainability standards of performance. Neither science- nor ethics-based measures by themselves can do this. Norms, values and ethics are always required to finish the job.
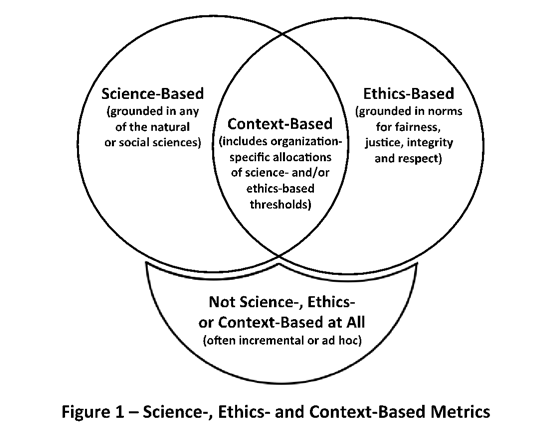
716. Economy for Common Good (ECG)

717. Data to Action hourglass model (Monson 2022)

718. Load of BS (Lüdeke-Freund 2016)
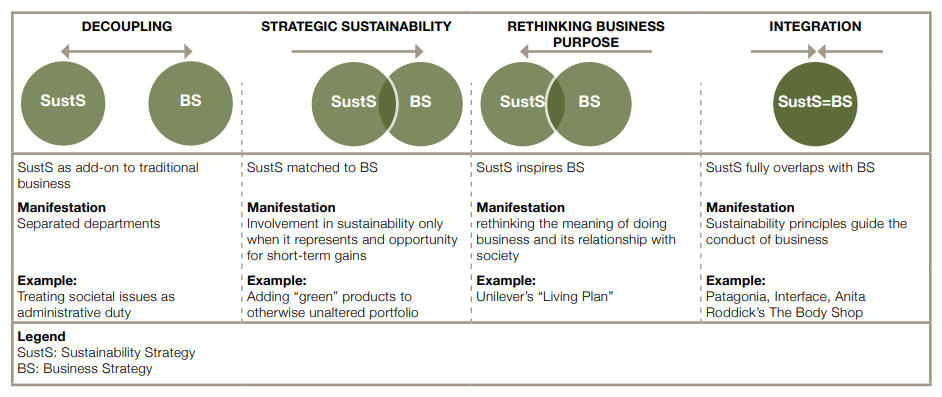
719. Triple-layered business model canvas (Joyce and Paquin 2016)

720. The Ruruku Strategic Canvas (Pirini 2023)

721. Disappointingly, it doesn’t fold into a box (Bocken 2014)

723. Interspecies (Bergmann 2019)

724. Hamburgers (EPOSEA model applied to the story of hamburgers) (Uhrqvist 2021)

725. Hexaflexagon (Sarah McManus)
I decided this would be a great concept to represent in hexaflexagon form! The first face is meant to suggest an organism, which is contained by an ecosystem, which is contained by its environment. The environment represents both large-scale processes (ex: biogeochemical cycles) that surround ecosystems, as well as the small-scale processes (ex: chemical reactions) that exist within organisms, so environment is again enfolded by the organism as you fold the hexaflexagon again. I’m trying to suggest ideas like variation and constraint, energy flow, and a hint of ascendancy/entropy.

726. life = {environment{ecosystems{organisms{environment}}}} (Fiscus et al. 2012)

727. Window of Vitality (Fath et al. 2019)

728. Topological landscape of Sustainable Management (Heitzig et al. 2016) (see also Donges 2017 below).
Heitzig et al. (2016) show how a classification of qualitatively different regions in system state space
emerges from the following three ingredients: 1. environmental dynamics under a default strategy, 2. available management options the agent can choose from, and 3. the division of state space
into desirable (“sunny”) and undesirable (“dark”) regions. Hence, it uses an agent-environment interface perspective (second level of resilience complexity) with a default strategy and fixed state
desirability (figure 2). The various elements of this picture metaphorically illustrate the underlying mathematical Topology of Sustainable Management Framework with the waterstream correspond –
ing to the stability landscape under the default policy.
For example, the shelter is the sunny set of states in which the agent can remain forever without any management. Both in the glade and the lake it is possible to reach the shelter but the agent has to apply management. From the lake it has to cross through the dark region, whereas from the glade it can reach the shelter without leaving the sunny region. In other regions, such as the backwaters, the shelter cannot be reached, but the agent can remain in the sunny region by constant or repeated management.
These regions emerge from the allowed rule changes describing how the agent is able to adapt to and manage the environment.
(So this isn’t a landscape of sustainability per se, but of the difficulty of traversing between different states of sustainability)

729. Multiple cups and balls give multiple undesirable regions (Donges 2017)

730. Pattern–process–service–sustainability framework (Bojie Fu 2022)
A flowchart of the pattern, process, service, and sustainability framework in the coupled human and natural system (a) and a diagram of typical patterns, processes (e.g. hydrological processes), and ESs (e.g. provision services) (b).

731. Emotional profiles (Cremades and Stella 2022)
Speakers’ mindset reconstruction around “climate” (a, b) and “change” (c, d) in the speeches of Greta Thunberg (a, c) and Christopher Monckton (b, d).

732. Model of alternative hedonism (Naughton 2009)

733. Model of cognitive polyphasia (Naughton 2009)
the ability to hold simultaneously two completely conflicting views
Starting positions are at A in two different conversations – one about the “necessity of economic growth for social stability”, the other about “ecological and social goals”. There is not A1 and A2 as these positions can be maintained simultaneously and the text makes no inference as to which has or
should have priority. The positions are in different spaces but within the same current context.
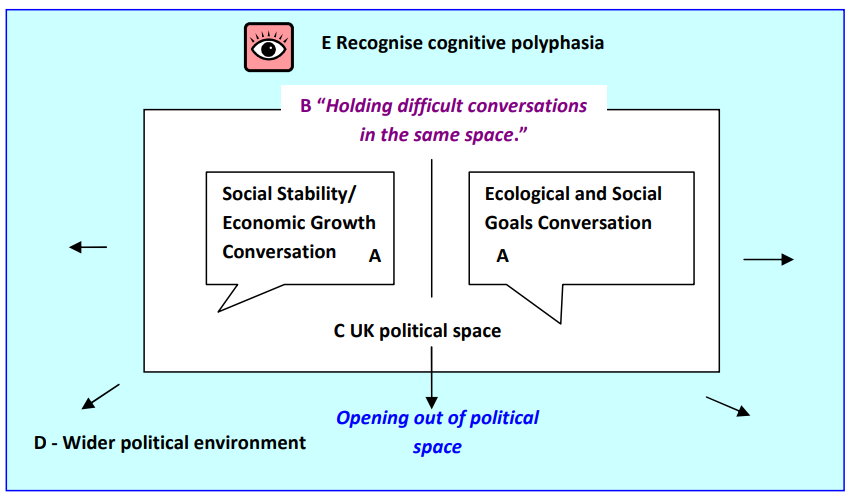
734. Closing metaphorical loops (Raymond 2013)

735. Multiple lenses for transdisciplinary (Vanasupa 2014)

736. Fractal agency (O’Brien et al 2023 after Sharma’s Three Spheres of Transformation)

737. Fractal Powers of 10 (O’Brien et al 2023 after Bhowmik et al.2020)
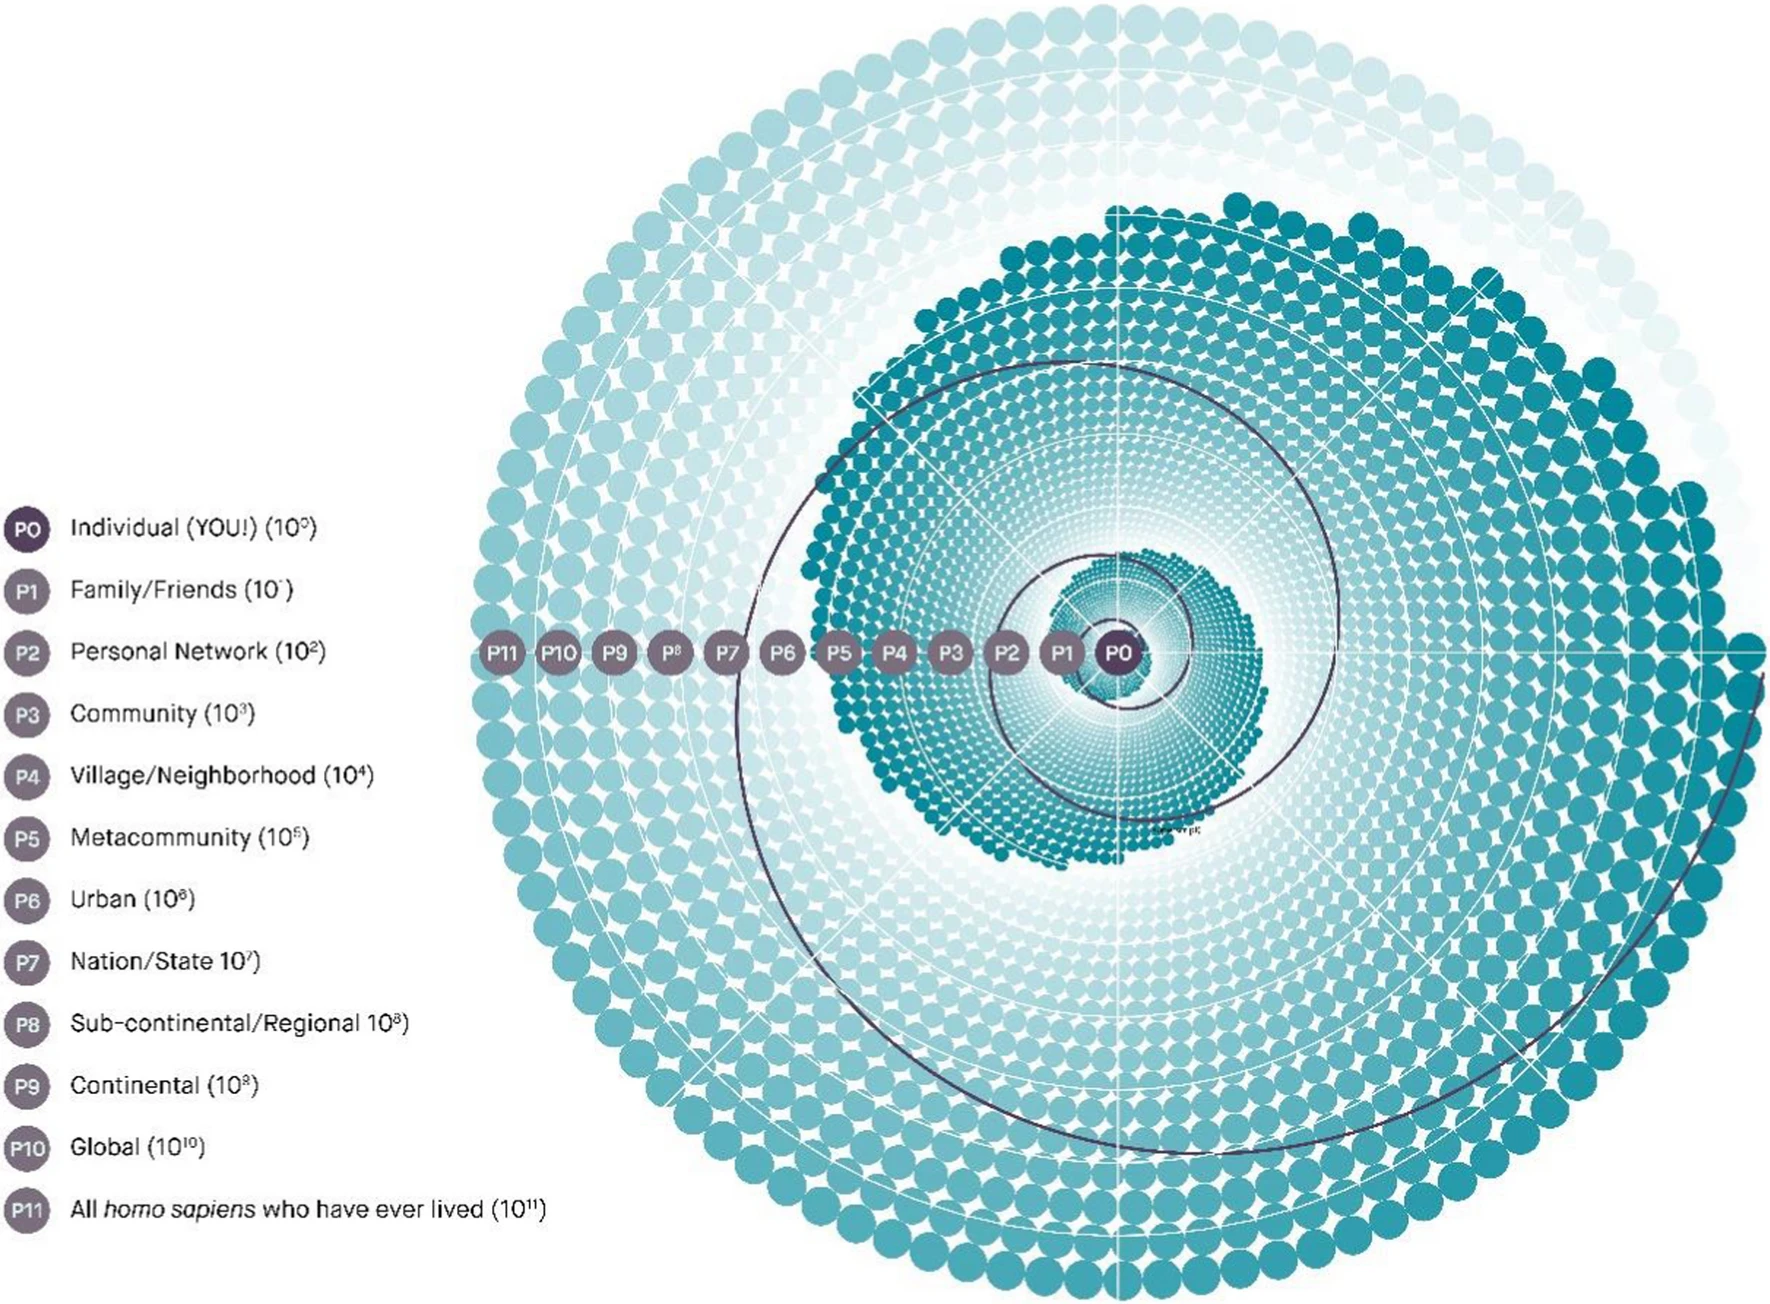
738. Reparation Ecology (Lampis et al. 2022)
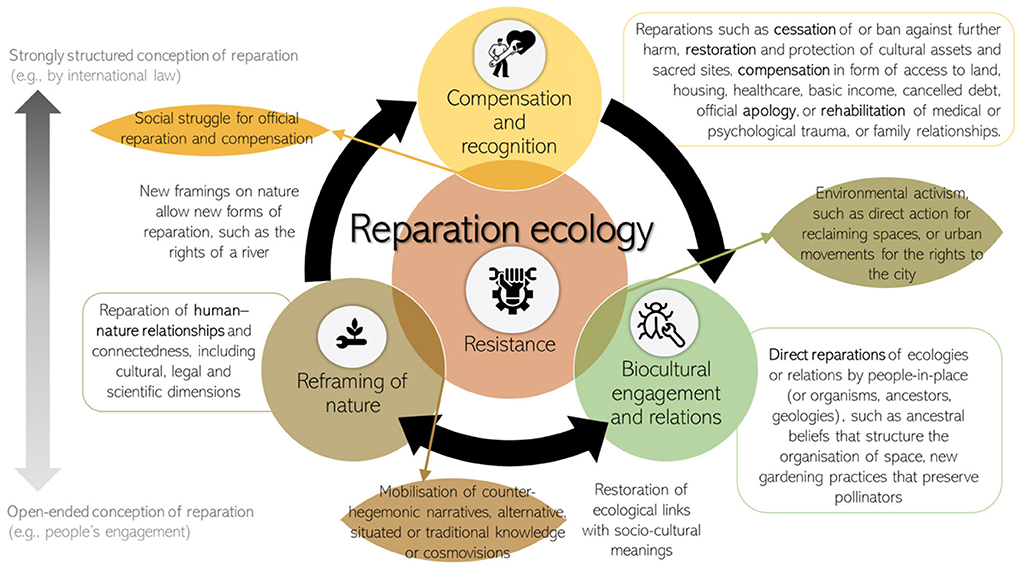
739. Arrow in a circle (Fien 2002)
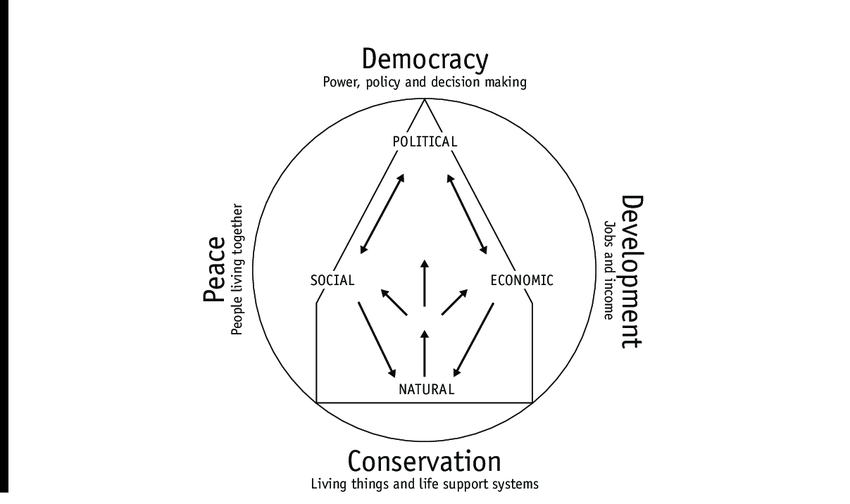
740. Typology (Pascual et al. 2023)
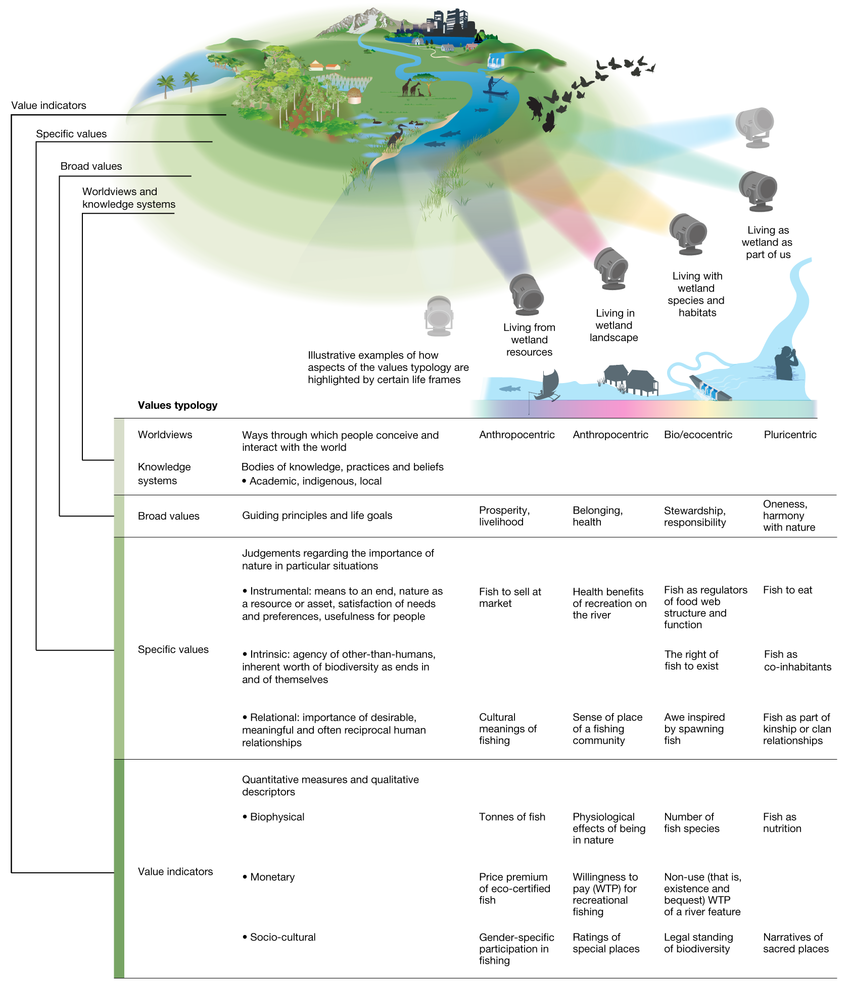
741. Diverse values of nature underpin different pathways toward sustainability (Pascual et al. 2023)
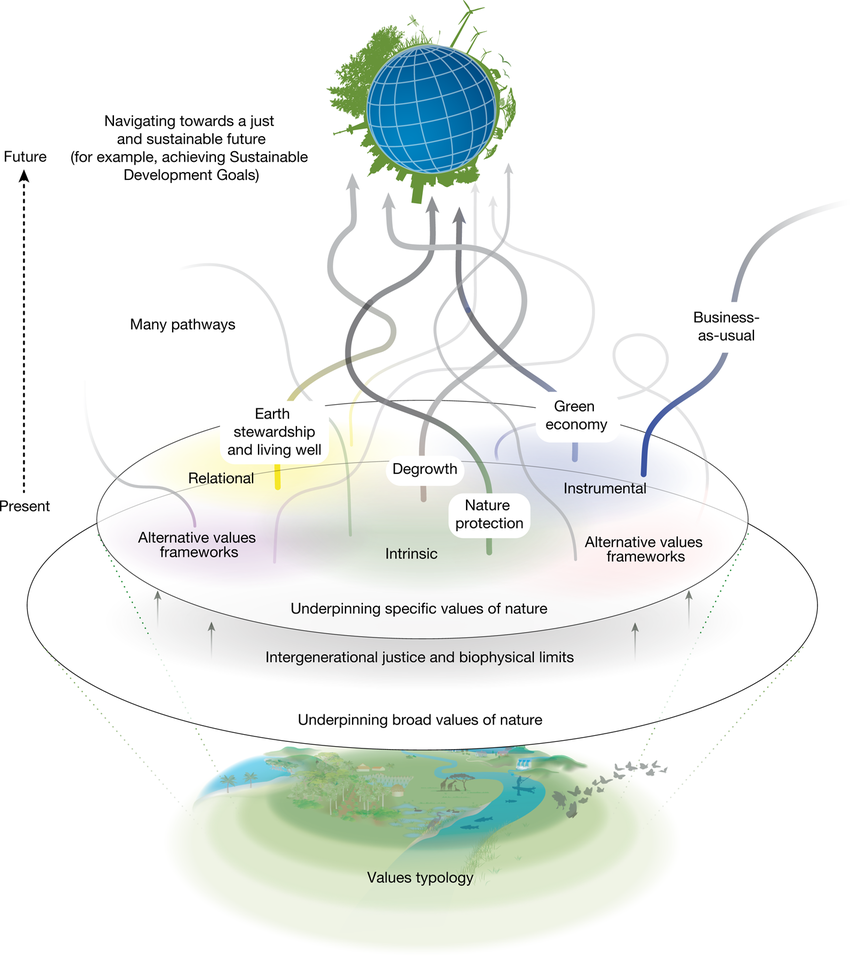
742. Values-centred leverage points (Pascual et al. 2023)

743. Regenerative economics (Fath et al. 2019)

744. Transformation (Kudo and Mino 2020)
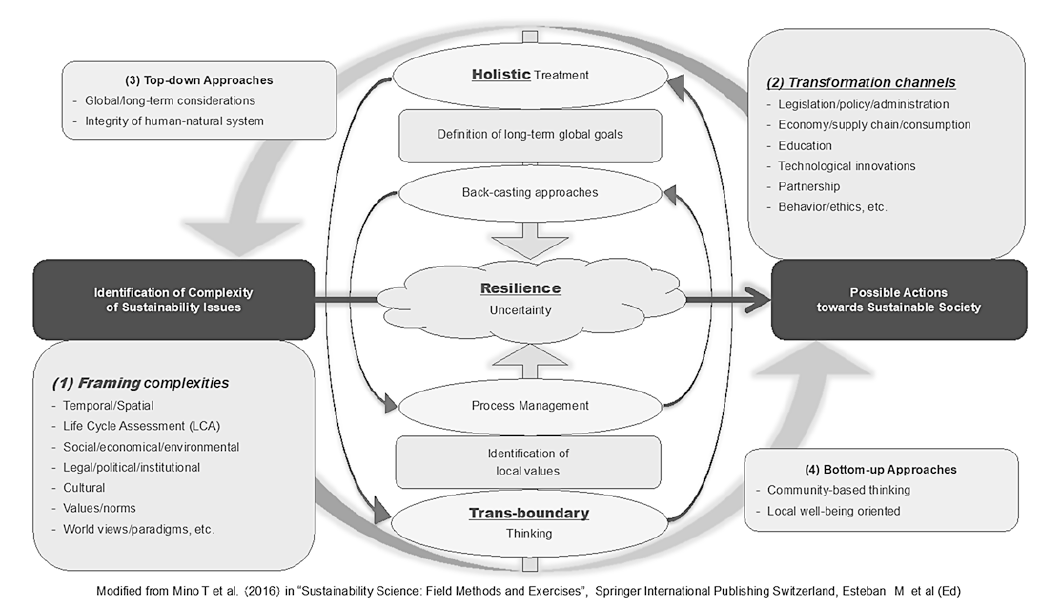
745. Colon (Martin-Ortega et al. 2022)

746. Four plausible futures (Arup 2019)

747. ^That Graph^ (Unintentionally) Reveals What’s Wrong With Our Worldview. (Halsted 2020)
“… the graph makes a fundamental error in separating our social and environmental conditions, when the two are, in fact, inextricably intertwined. Our dominant cultural paradigm, however, assumes that human society and nature are somehow separate. This mental separation of culture from nature is used to justify the domination of humans over other species and the life-supporting Earth systems we call Gaia, as well as men’s domination over women, the domination of certain (usually fair skinned) ethnic groups over other (usually darker skinned) ethnic groups, and even the domination of our thinking selves over our feeling selves. The result is environmental degradation, patriarchy, racism, and psychological alienation.
Here’s what the graph should look like:
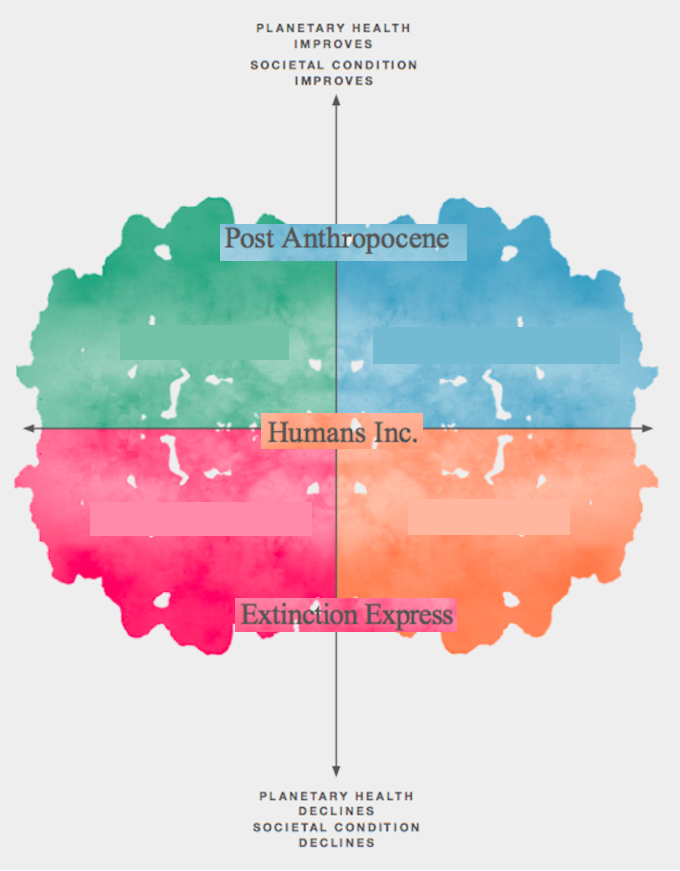
748. Human body, earth, and qi, united as the part of nature and the universe (Harjanto 2018)

749. Metamorphsis (Hutchins 2023)
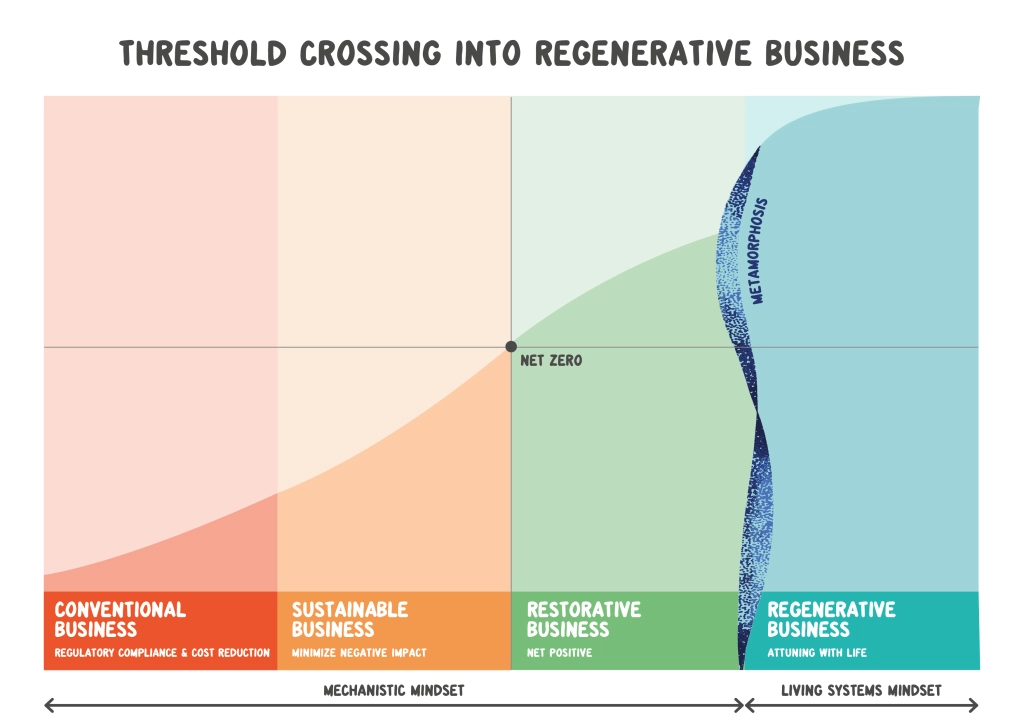

750. Self as participating within the world (Hutchins 2023)
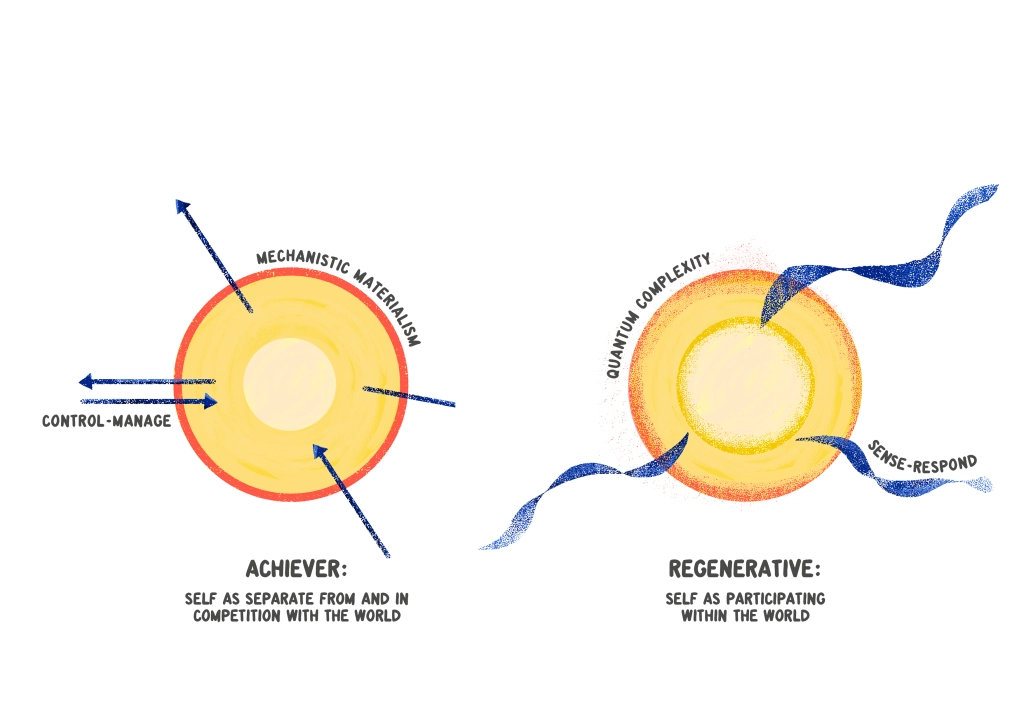
751. A hero, a genie and a woodpecker walked into a bar… (Chambers et al. 2021)

The hatching is from here:

752. Critical processes to foster co-productive agility (Chambers et al. 2021)
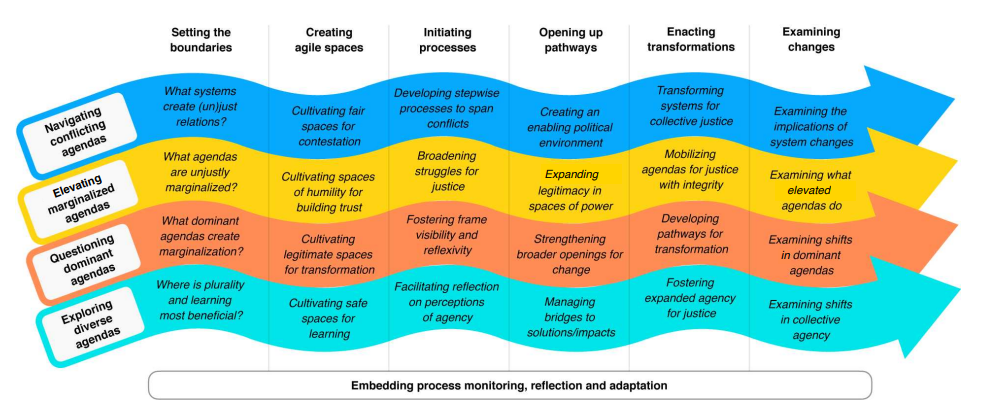
753. Reconciling wellbeing and resilience (Chaigneau et al. 2022)
The narrow pursuit of resilience (1a) and wellbeing (1b) does not always lead to synergistic outcomes. An adaptive process of learning through doing is required to reconcile wellbeing and resilience for sustainable development (1c).

754. Once-in-a-civilisation metamorphic moment (Hutchins 2023)
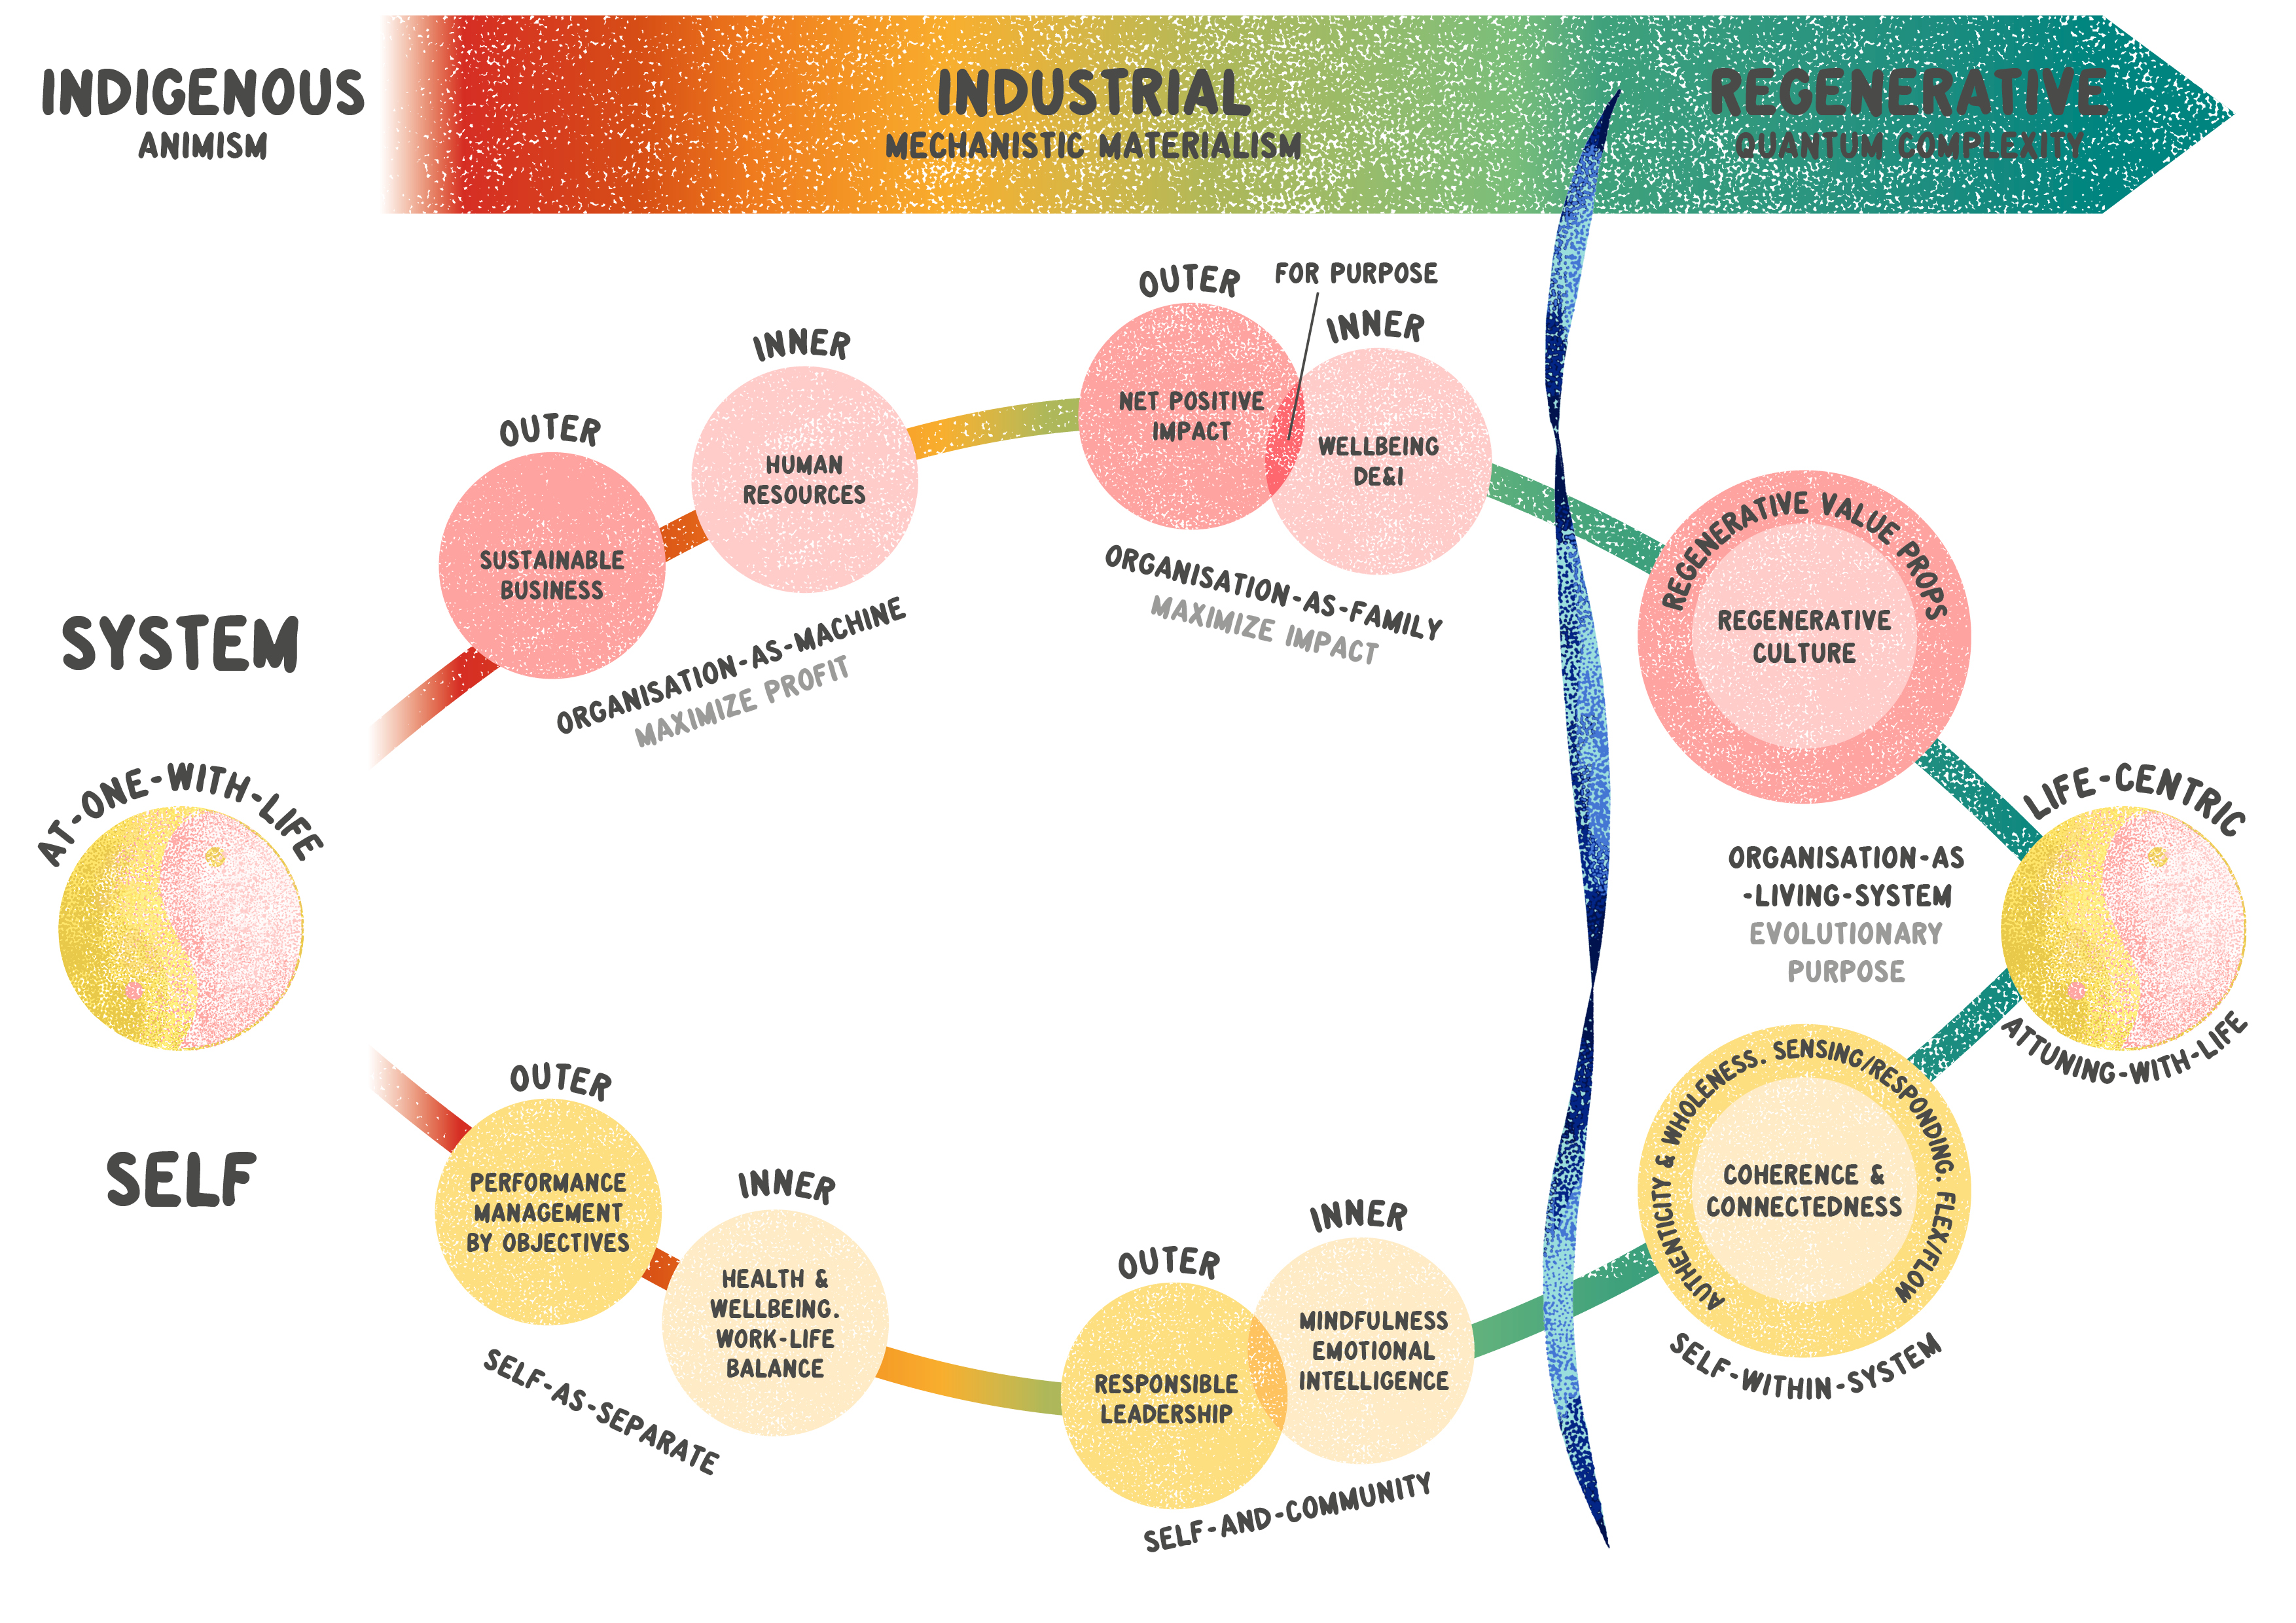
755. Infinity of Connection (Richardson 2023)
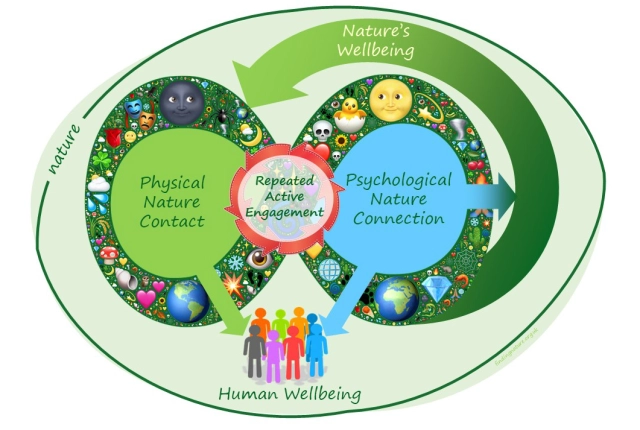
756. Pillars as systems then emergent sustainable development (Reyers and Selig 2020)

757. Collaborations around urban nature (Koefoed 2019)

(Suggestions for altered order, with re-iterative feedback loops)

758. Sustainability requires knowledge as a web (Liu et al. 2019)

759. Regenerative leadership DNA (Hutchins 2023)

760. Coupled systems (Portner et al. 2023)

761. Transformative (Portner et al. 2023)
Biodiversity-climate interactions in social-ecological systems with an explicit depiction of resilience outcomes for alternative pathways.

762. Sustainability is about shared spaces (Portner et al. 2023)

763. Womb of Life (Zabaniotu et al. 2020)

764. Transdisciplinary Trees (Zabaniotu et al. 2020)

765. Interconnectedness of the determinants of planetary health (Redvers et al. 2022)

766. Collective foresight (Wood et al. 2021)

767. The being and doing of sustainability researcher identity (Hakkarainen et al. 2023)
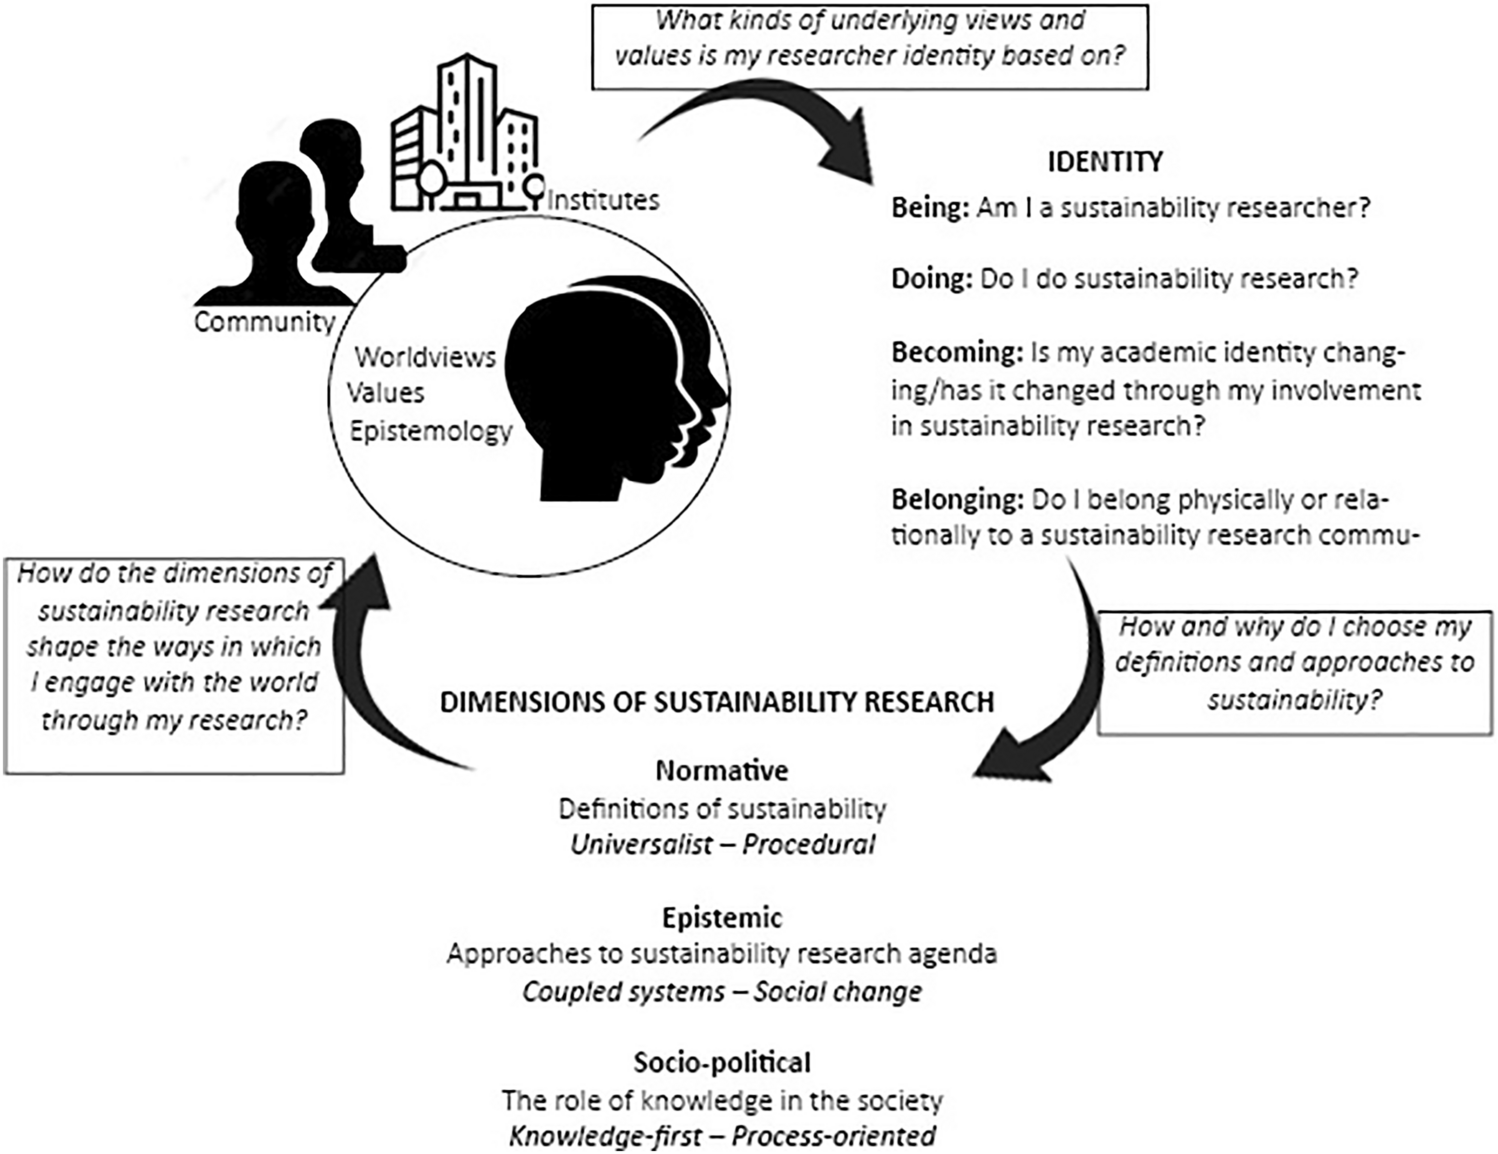
768. Different pathways as a result of differences in history, context, and values. (Bennet et al. 2021)

769. Sustainable scaling mechanisms (Bennet et al. 2021)

770. Social memories and human niche (Douglass and Rasolondrainy 2020)
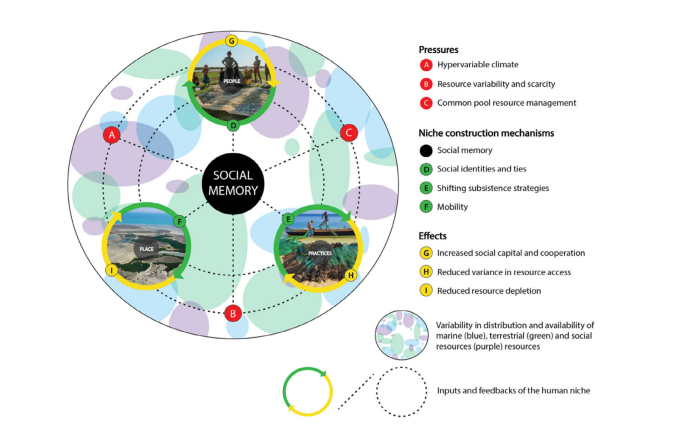
771. Relational turn (West et al. 2020) (see also Raymond et al. 2021 response, and West’s 2021 response to that)

from West 2021: Two possible research pathways for putting relational thinking to work in sustainability science

772. More integral – adding to Wilber (Lavaf-Pour and Meraz 2023)
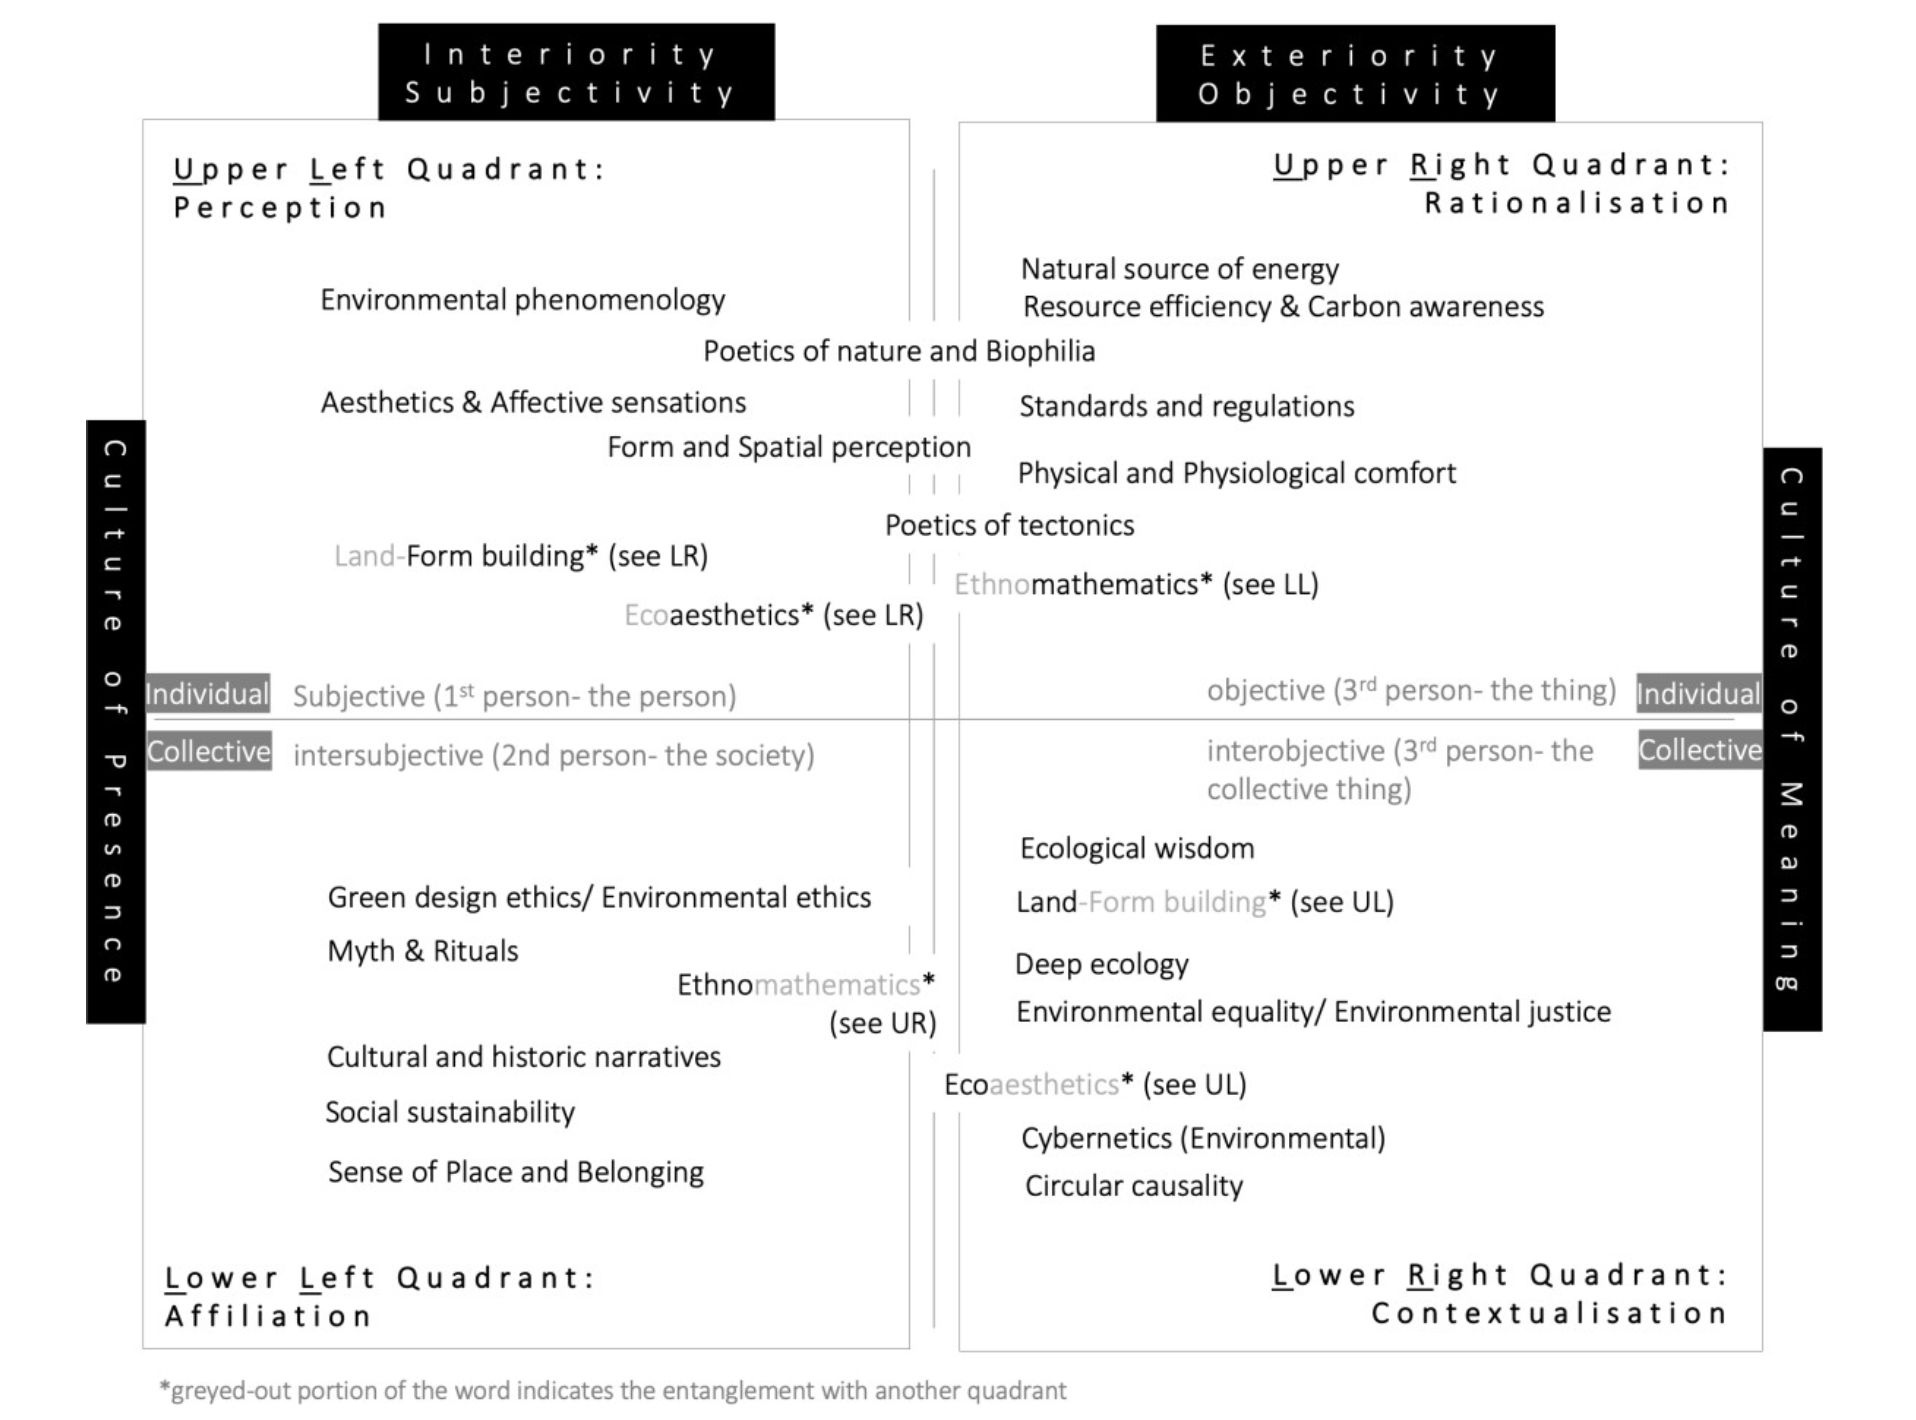
773. Vulnerability in Complex Adaptive Systems (Naylor et al. 2020)
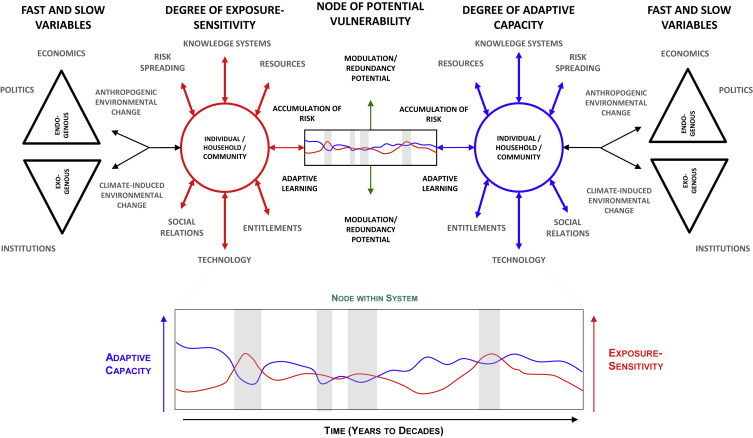
774. Network compass (Schneider et al. 2021)
The Network Compass’: four generic fields of action, each with five subfields, through which networks seek to foster co-production of knowledge for sustainability transformations


775. Adaptive cycle applied to creative destruction for sustainability transformation (Wassénius et al. 2023)
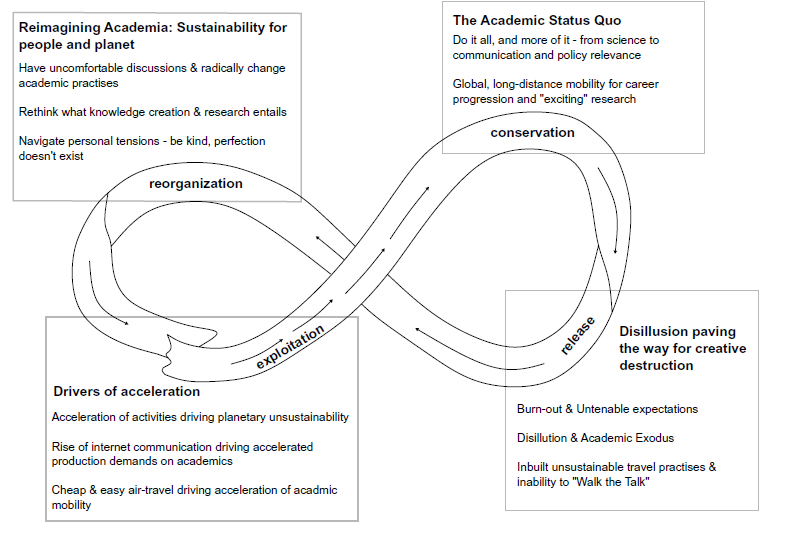
786. I’m here for the atom in the middle (Feagan et al. 2023)
Urban Resilience to Extremes, Sustainability Research Network

777. Undisciplinary journey (Haider et al. 2017)
Artistic rendition of the sustainability science PhD student (right) attempting to explain her ‘background’ to the more disciplinary ‘Nanotech science’ PhD student (left) who questioned her professional identity.

778. Undisciplinary compass (Haider et al. 2017)
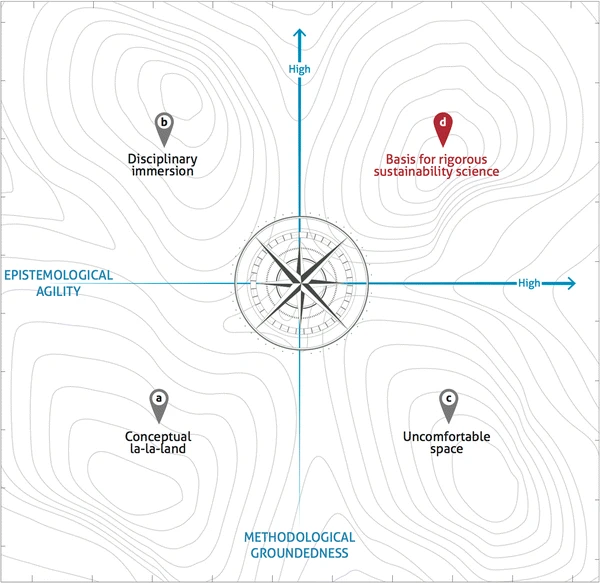
779. Vivo way (Vivobarefoot)

780. Triple-S, caring for Science, Society and Self. (Sellberg et al. 2021)
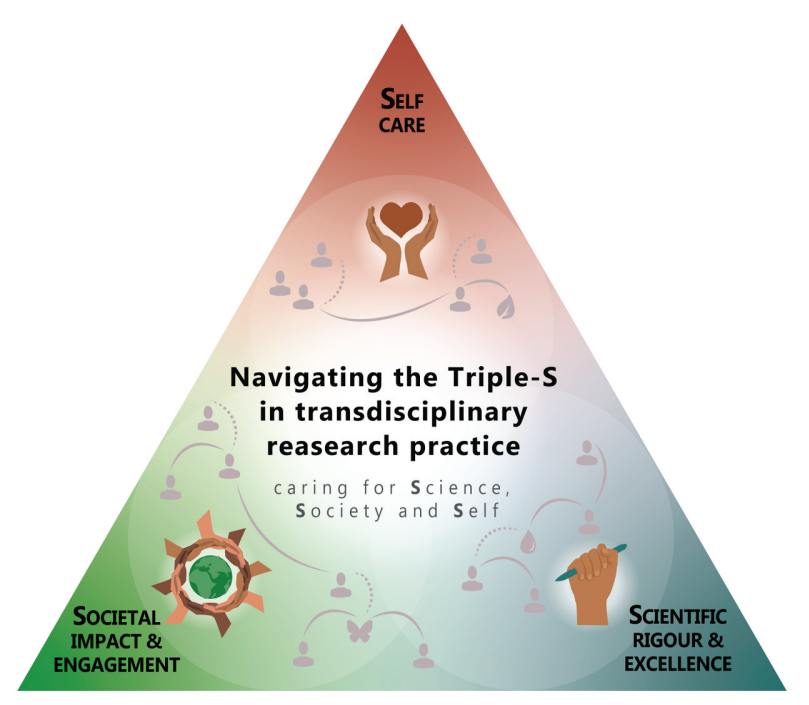
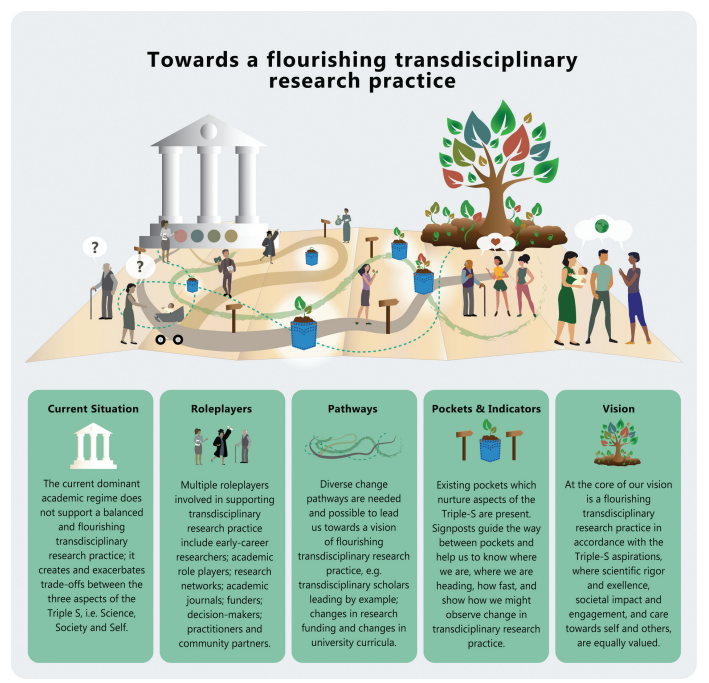
781. Multiple lines of evidence (Tengö et al 2021)

782. Leadership collective for sustainable transformations (Care et al. 2021)

783. Safe and just operating space for identity (Oliver et al. 2022)

784. IMAGINE inner transformation and inner–outer change (Ives et al. 2023)
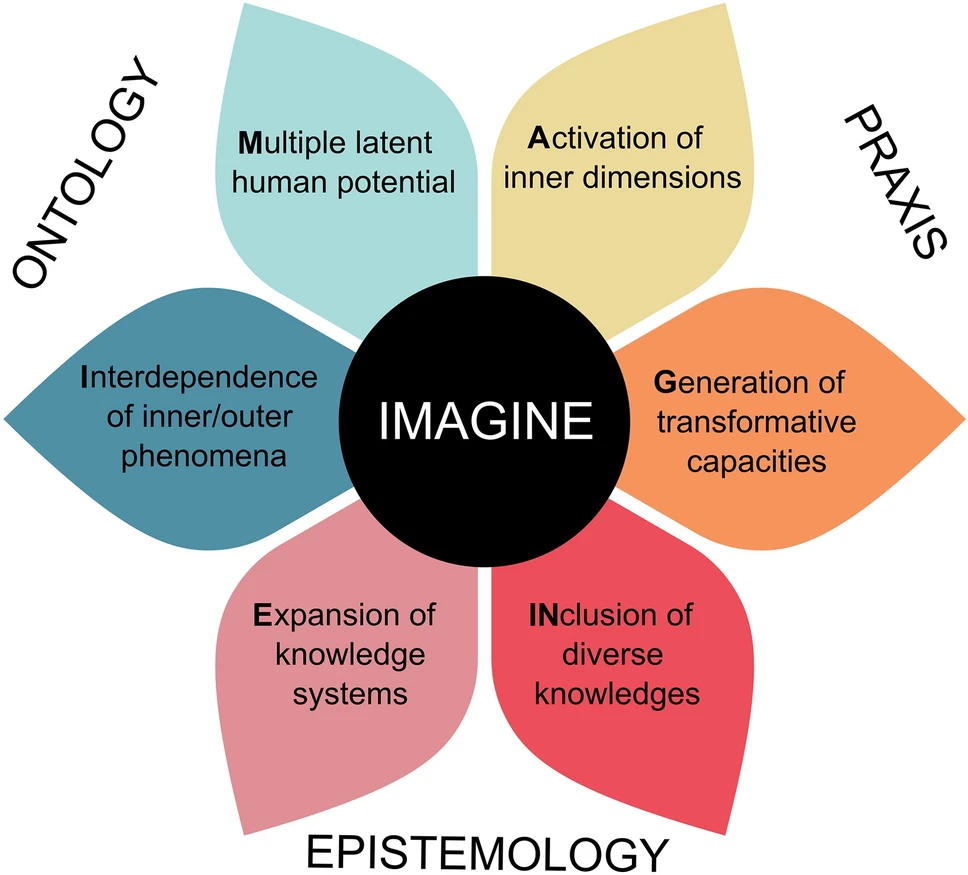
785. The regenerative eyes have it (Buckton et al. 2023)
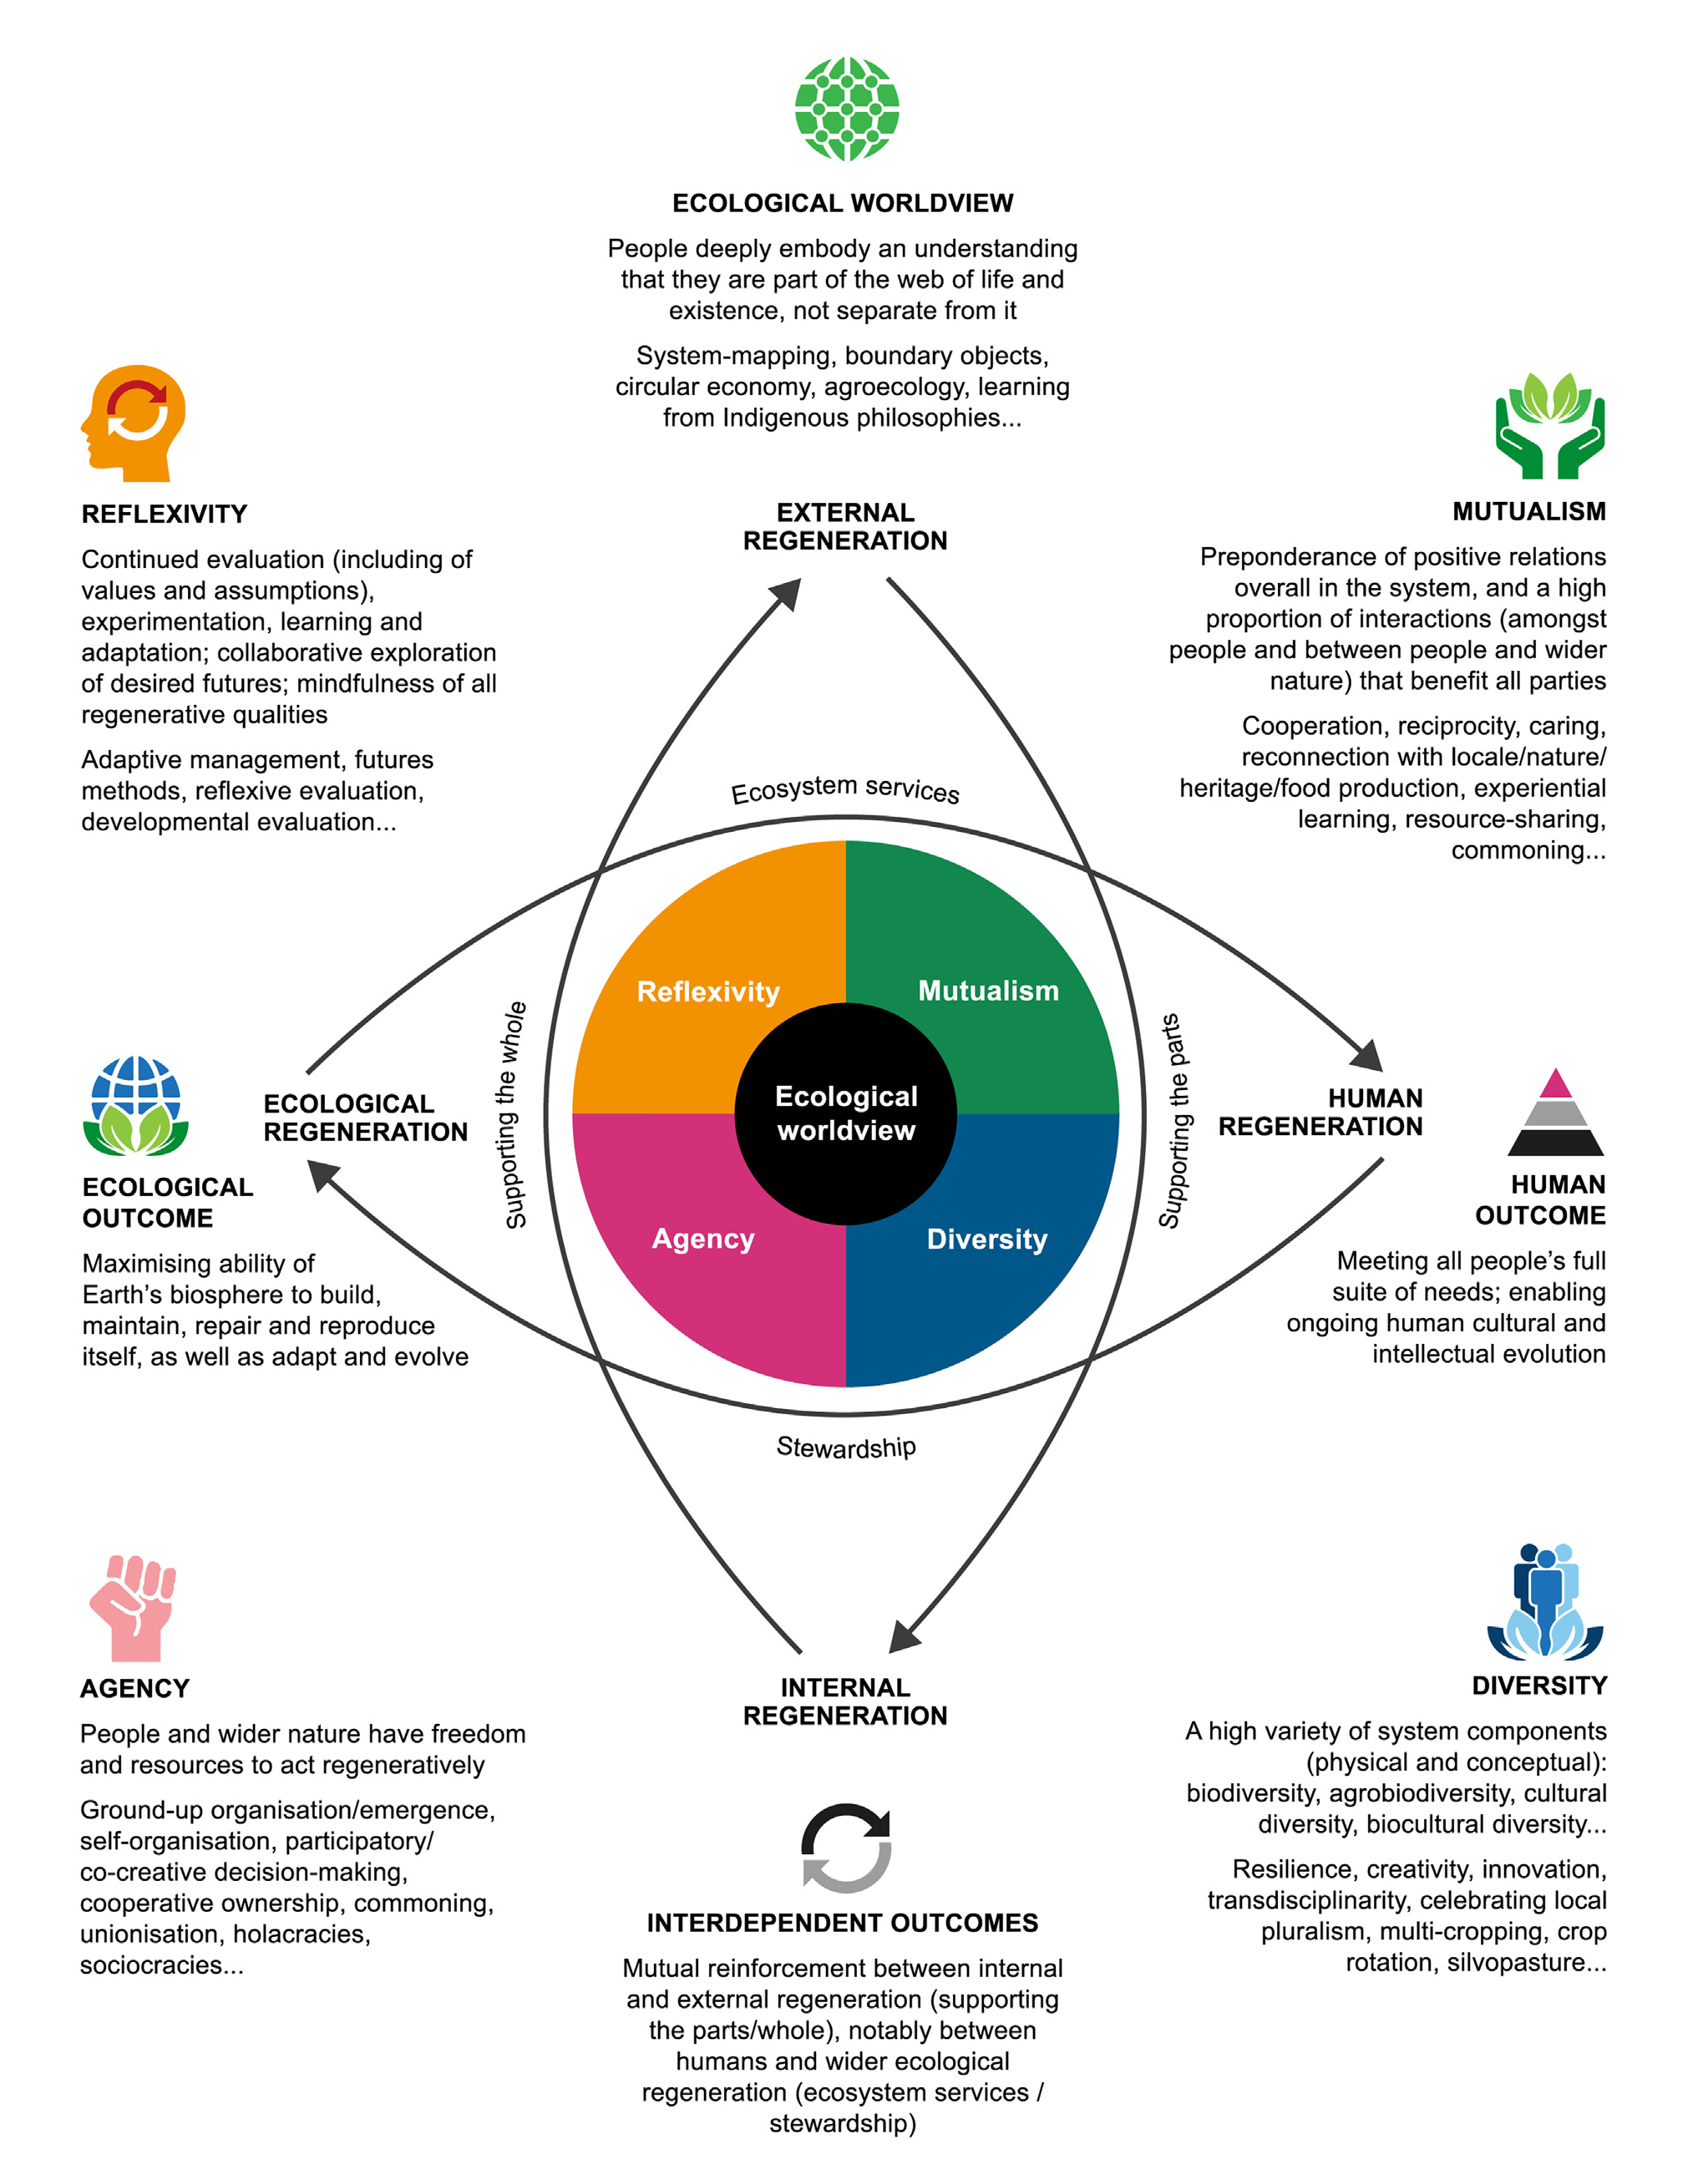
786. Grand feedback loop (Masterson et al. 2019)
Integrative conceptual model illustrating the dynamic interrelation between ecosystems (1), their benefits to people (2), well-being (3), and people’s values and actions (4–5) that affect the condition of ecosystems.

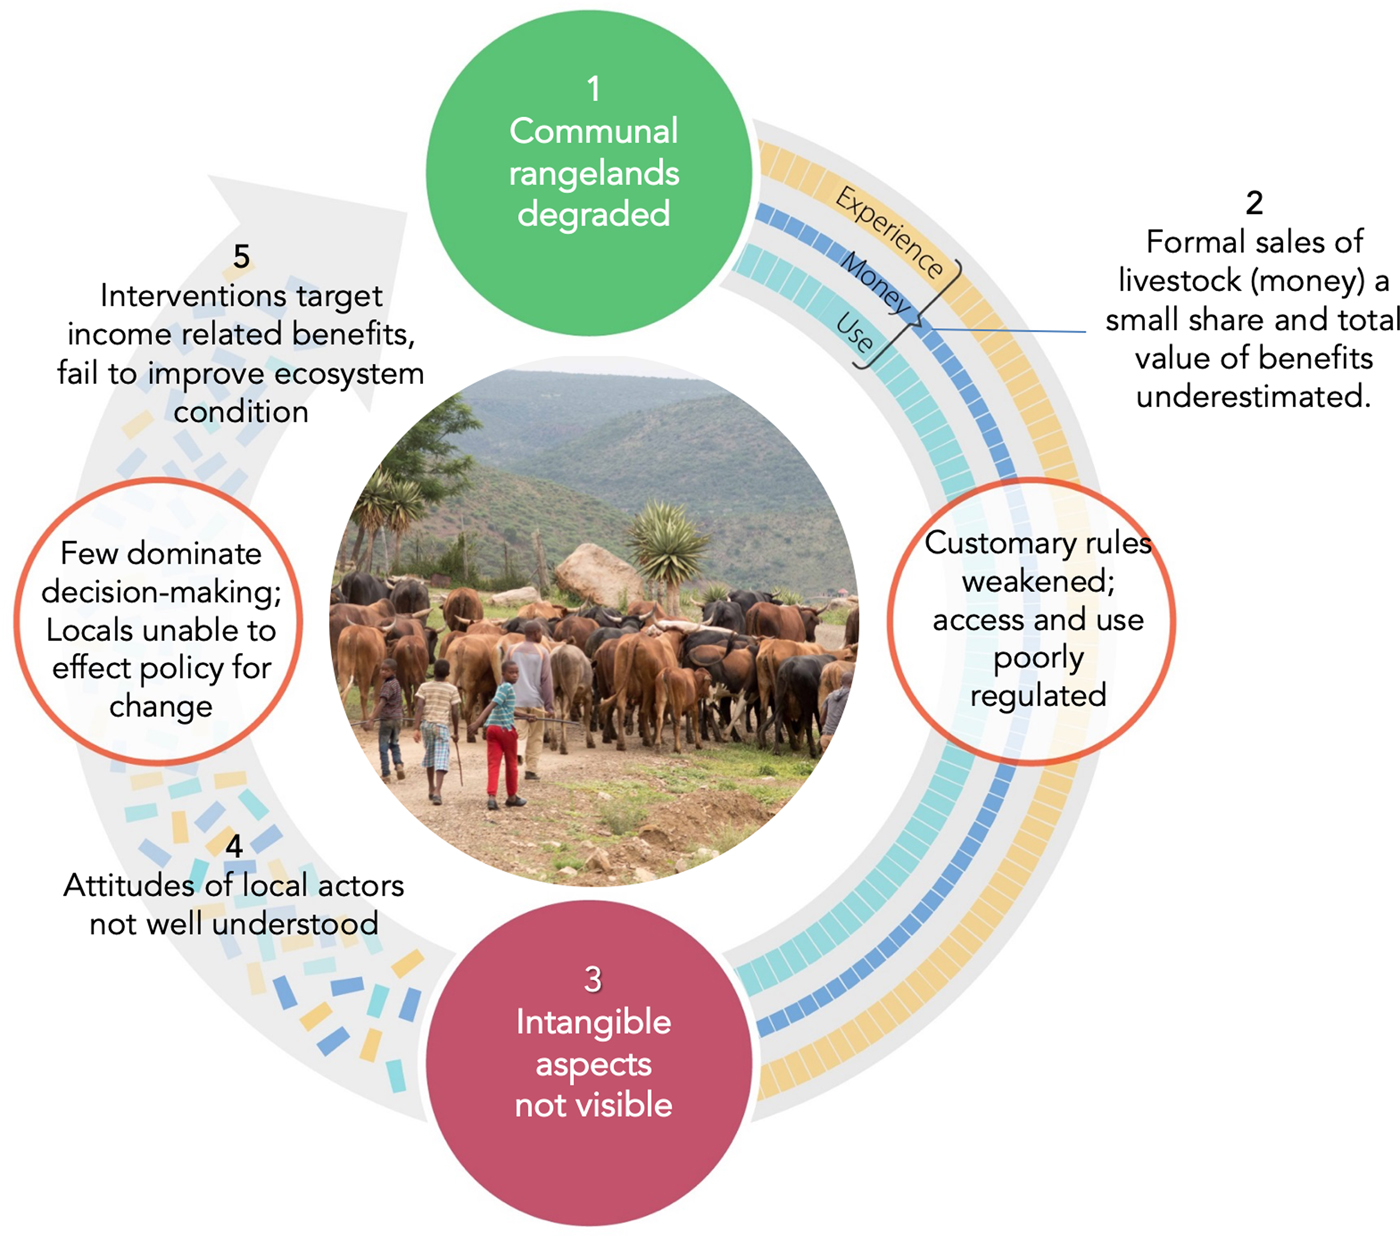
787. Andean cross Chakana (van Norren 2020)
Balancing the inner, current and upper world, corresponding with emphatic care (heart), work (hands) and wisdom (head) (integrality); departing from families within communities and regions, which pray to (and respect) nature, sun and moon, and Great Spirit (relationality), while balancing the masculine and feminine in all life forms as complementary and living in reciprocity.

788. Relationship between human and nature (Taghvaee & Ma 2017)

789. Nature Futures Framework (Pereira et al. 2020)

790. Visions on dimensions (Pereira et al. 2020) (from Lundquist et al. 2017)

Bonus diagram I really like (but I couldn’t call about sustainable even though really wanted to). (Sterling et al. 2019)
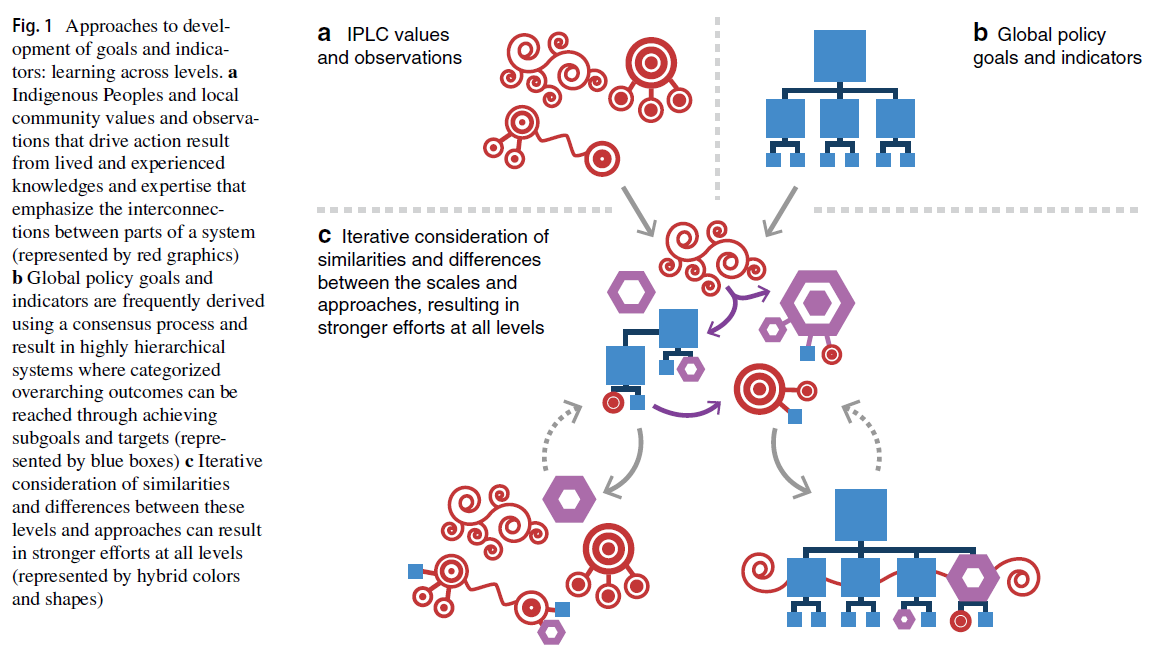
791. How can you be board with a lightbulb face and exploding head? (Grayson 2012)

792. Navigating the plurality of social values for sustainability (Raymond et al. 2019)
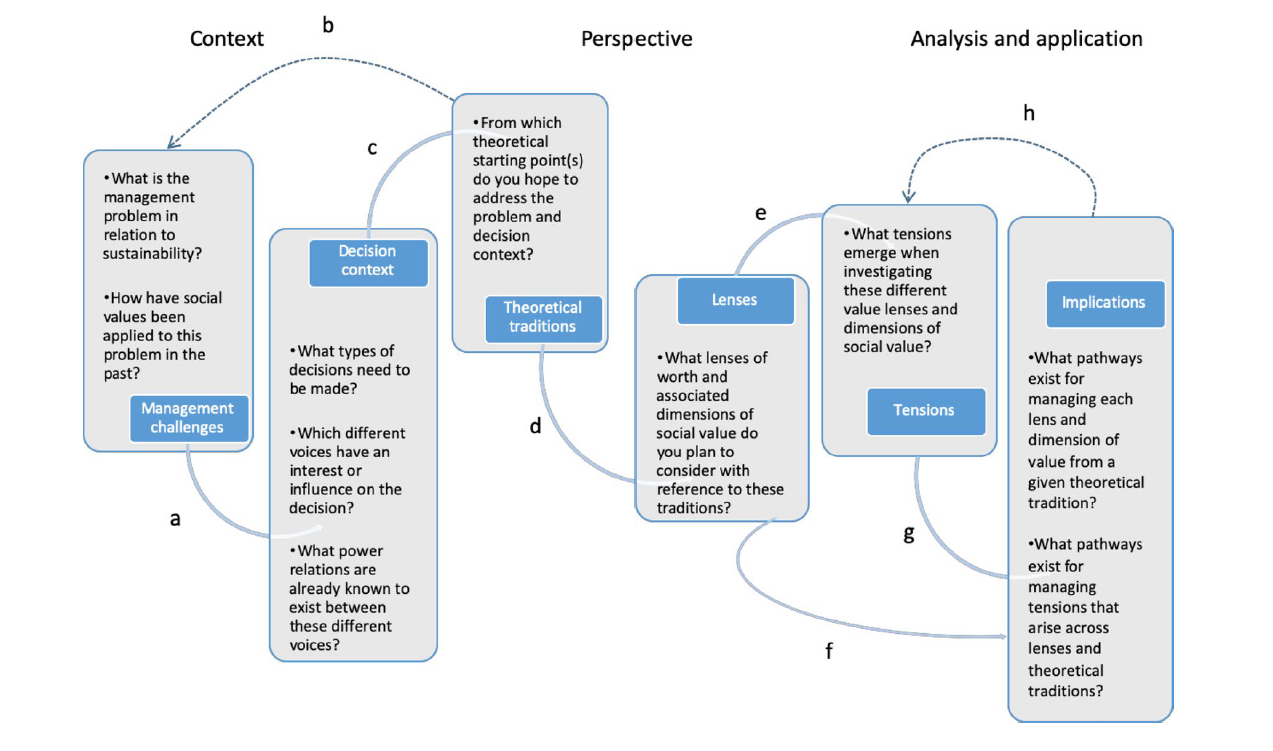
793. So long as we achieve sustainability on the way to business results, we’ll be OK. (Menzes et al. 2021).
European Foundation for Quality Management Excellence Model with a sustainable future arrow on top.

794. Place-based causal model (Raymond et al. 2011)

795. Conceptual framework for values and valuing across tensions of abstractness and context dependence (Rawluk 2018)
(although this doesn’t explicitly represent sustainability, I’ve included it as it attempts to provide a framework for relationships between values – in a way, something that has been missing since the first Venn).


796. Employees’ personal values and organisational sustainability (Florea et al. 2013)
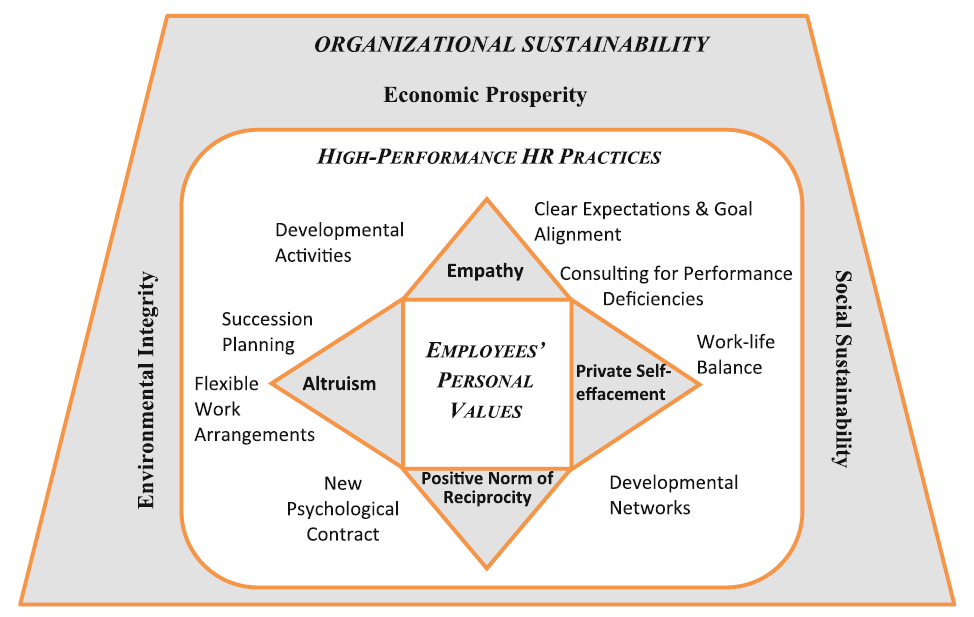
797. Means-ends (Schneider 2015)

798. Viable System Model (here applied to pollution, Panagiotakopoulos et al. 2015)

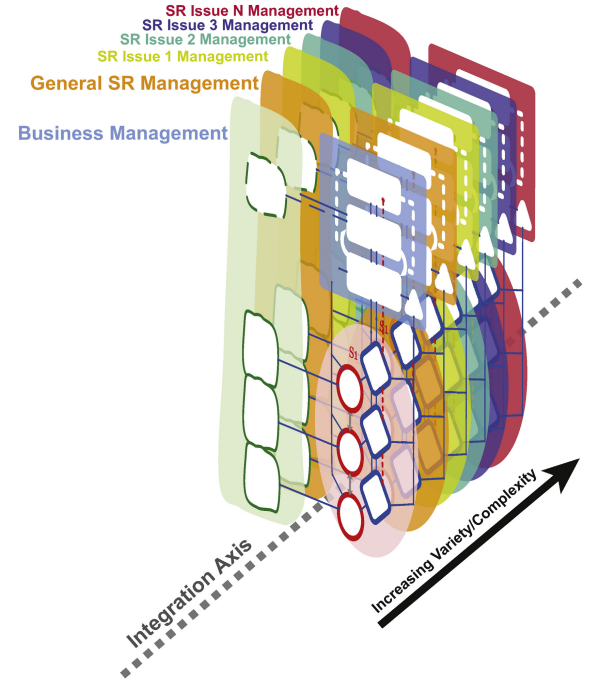
799. Nexus (Estoque 2023)

Conceptual structure of a nexus approach in the human-environment realm. (a) An example of a five-node nexus: food, energy, water, health and ecosystems. The diagram presents the basic flow in the development and implementation of a nexus. Outcome refers to the development outcome after synergies and trade-offs have been considered. (b) The human-environment nexus as a nested hierarchy, encompassing the sustainability nexus and the nexus of interest, and considering transboundary interlinkages (geographical, political or administrative). (c) The human-environment nexus as implemented across spatial scales, from local to global.
800. Sustainability and diversity and inclusion (Kose)
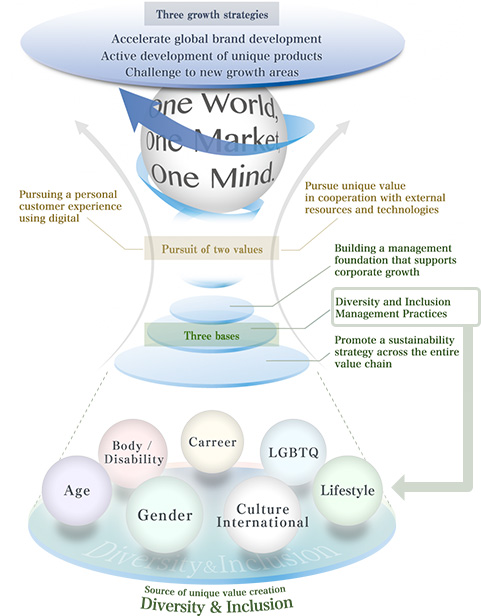
801. Societal knowledge about resource nexus (Giampietro 2018)
- “The resource nexus represents an inconvenient narrative”
- The resource nexus flags a remarkable gap in governance structures when it comes to dealing
with the complexity of the sustainability predicament. - The resource nexus exposes the ineptness of the paradigm of reductionism in scientific inquiry
for quantifying complex issues.
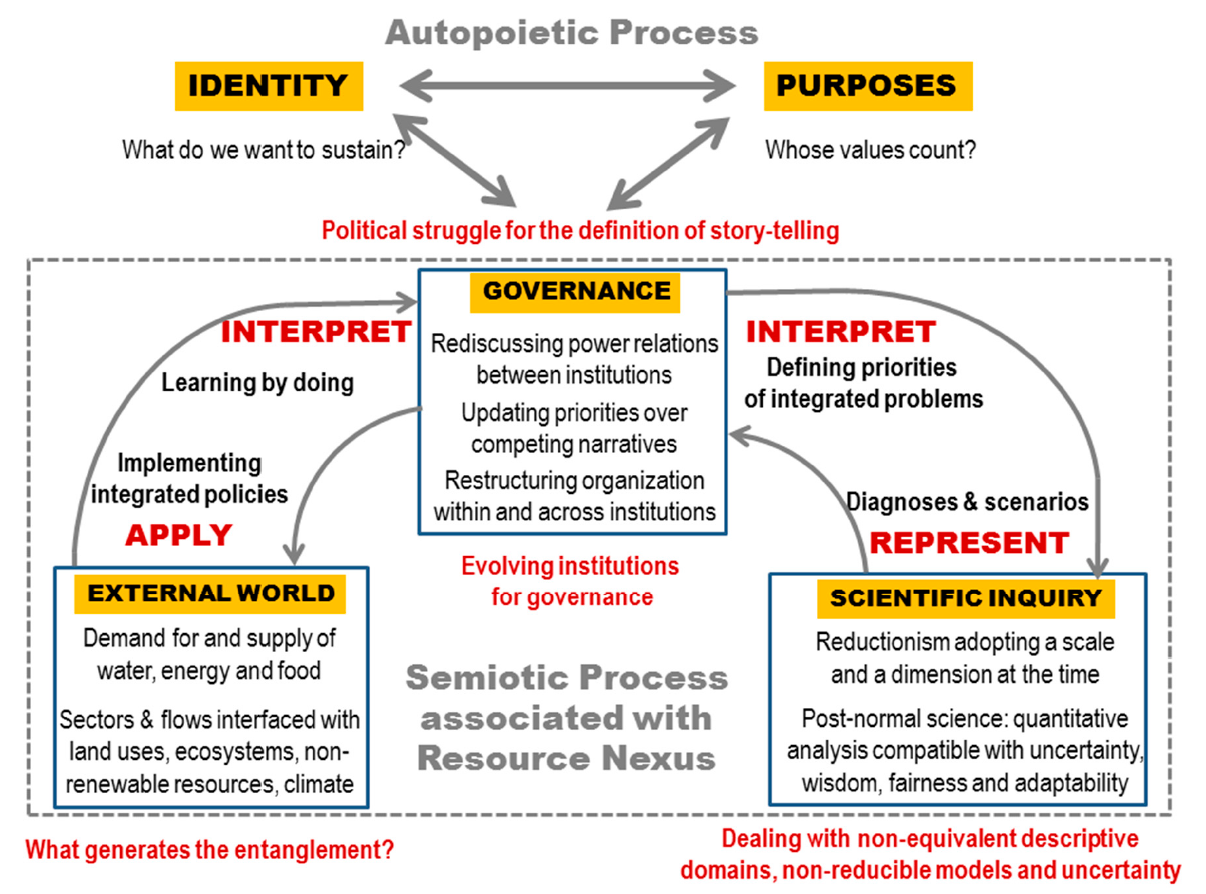
802. Intrapersonal process (Schweitzer et al. 2023)
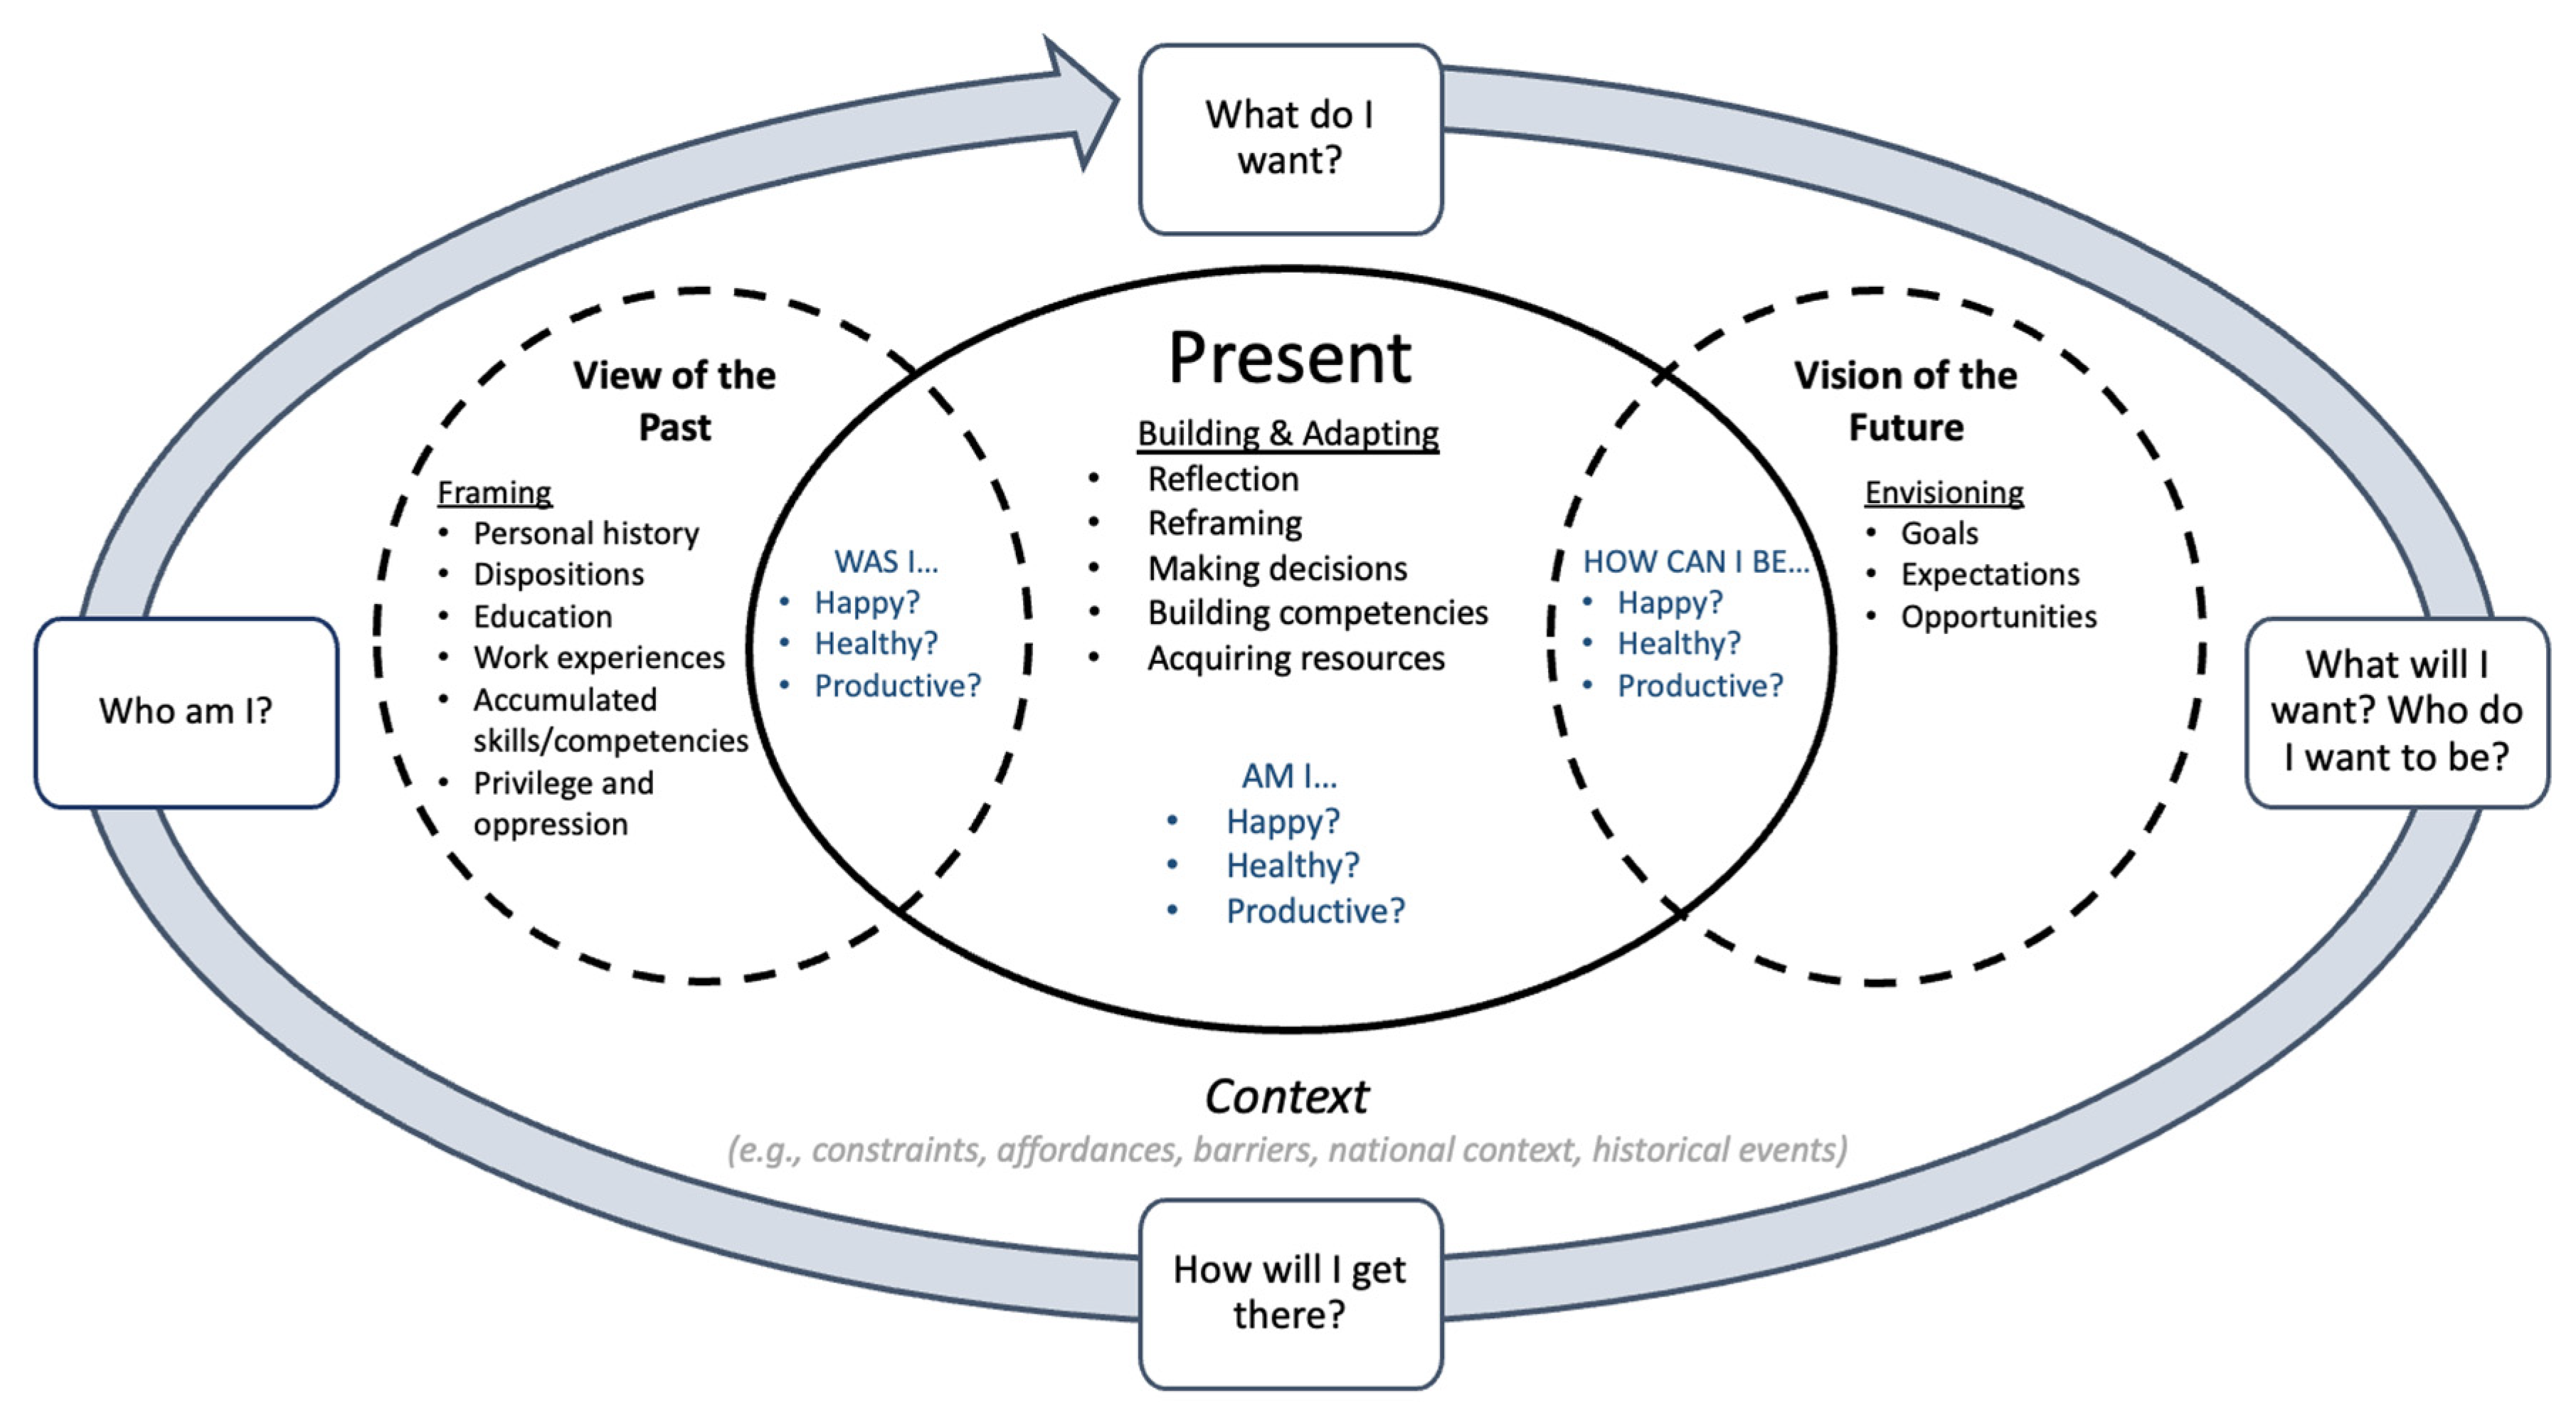
803. Transformative capacities (Galaz et al. 2022)

804. Thematic map based on 2021 Norwegian political parties (Sæterdal 2021)

805. From ‘econs’ to humans as ‘enculturated’ and ‘enearthed’. (Schill et al. 2019)
a, The first step of our journey towards a dynamic understanding of human behaviour—from ‘econs’ to humans. In this step, we replace Homo economicus (or ‘econ’, left) with a model of human behaviour that represents individuals as diverse and intrinsically pro-social, recognizes that people do not always act on their plans, and are generally not well described as optimization algorithms (right). In this model, singular individuals act and make decisions through interactions with their immediate contexts. b, The second step of our journey—individual behaviour in context. In this step, we go beyond the immediate contexts of the ‘very moment’ in which individuals take their decisions and place (‘quasi-rational’) individuals in their multiple broader socio–cultural contexts (humans as ‘enculturated’), ultimately embedded within the biosphere (humans as ‘enearthed’).

806. From Homo economicus to humans in complex adaptive systems (Schill et al. 2019)

807. Mediated Social_ecological system (Constantino and Weber 2021)

808. Exposome (Prescott and Bland 2020)
Addressing the multidimensional complexity of the exposome across the life-course: Health
depends on (1) minimizing adversity, recognizing that life in distress (dysbiosis) is multidimensional,
and (2) promoting the often underestimated value of protective and buffering factors. Both aspects of
this challenge may be enhanced by restoring value systems that promote connectivity and responsibility
for people, place and planet.

809. Post Traumatic growth (Logan et al. 2021)

810. An ideal curve is rarely smooth (Allen and Malekpour 2023)


812. “Eco-centric Developmental Wheel” – nature-based model of human psychological development (Plotkin 2008)

813. Just transition (Winkler 2020)

814. Indigeneity (Johnson 2021)
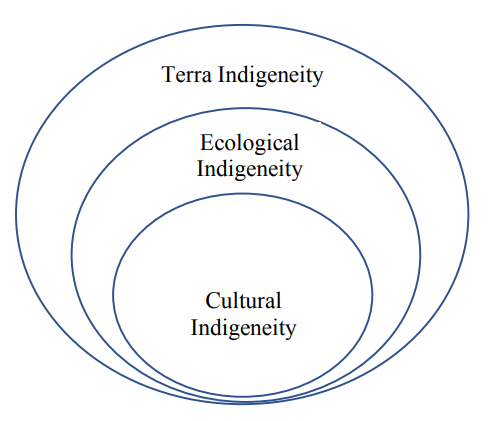
815. Change begets change (Rice 2020)

816. Flourishing – more than absence of harm (Logan et al. 2021)

817. Interconnected flourishing (Logan et al. 2021)

818. Ten facts about land systems for sustainability (Meyfroidt 2022)
(in a table cleverly disguised as a figure)

819. Worldviews and values (Anderson et al. 2022)

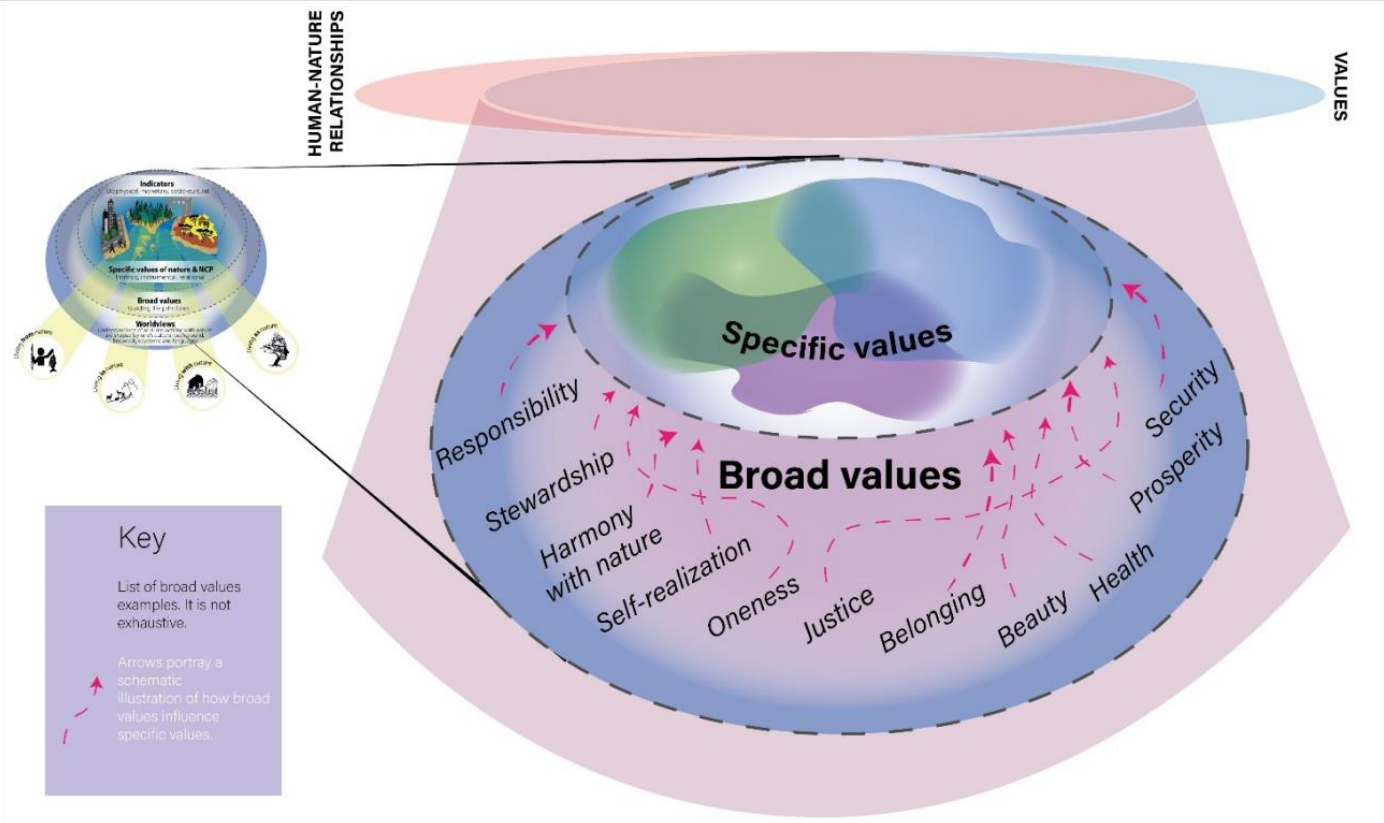
Inset bigger:

820. Assumptions of substitutability (Anderson et al. 2022)
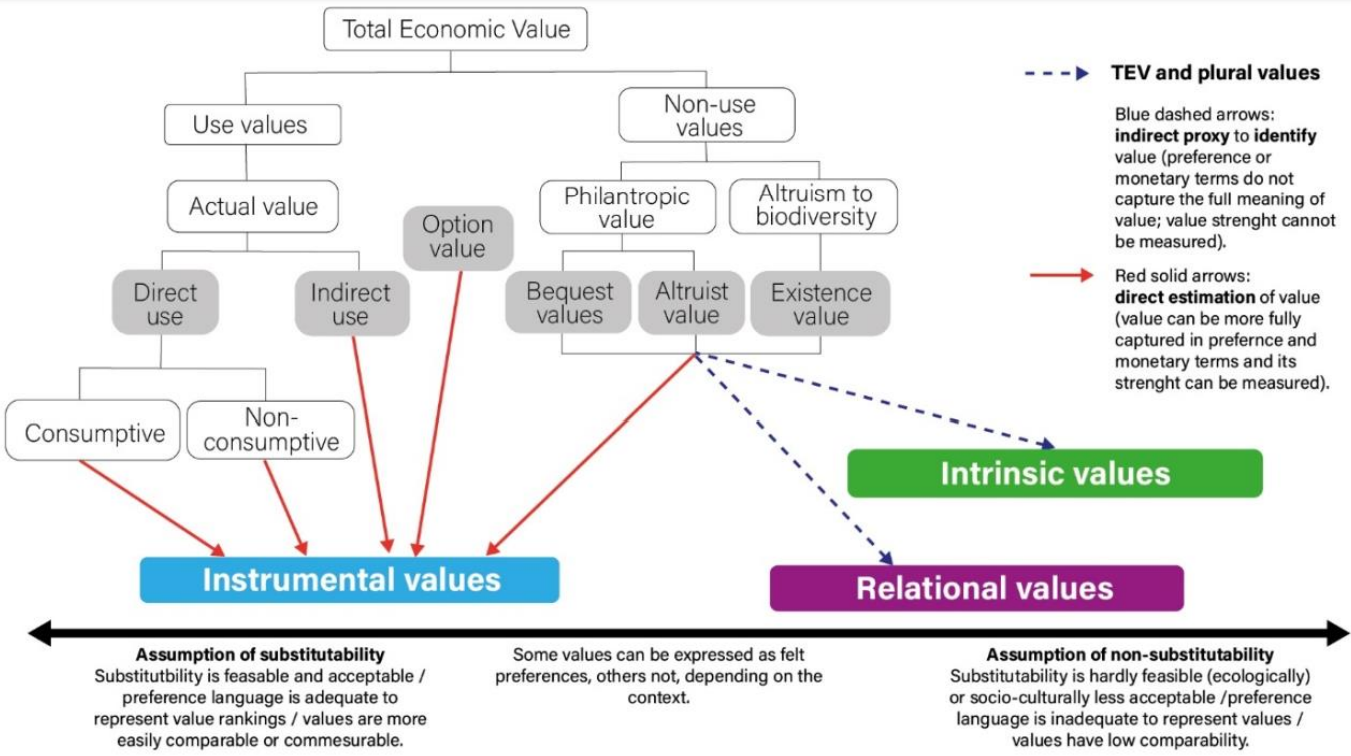
821. Values sets within life frames (Anderson et al. 2022)

822. Power and environmental justice dimensions (Anderson et al. 2022)

823. Put it together and what have you got? (Anderson et al. 2022)
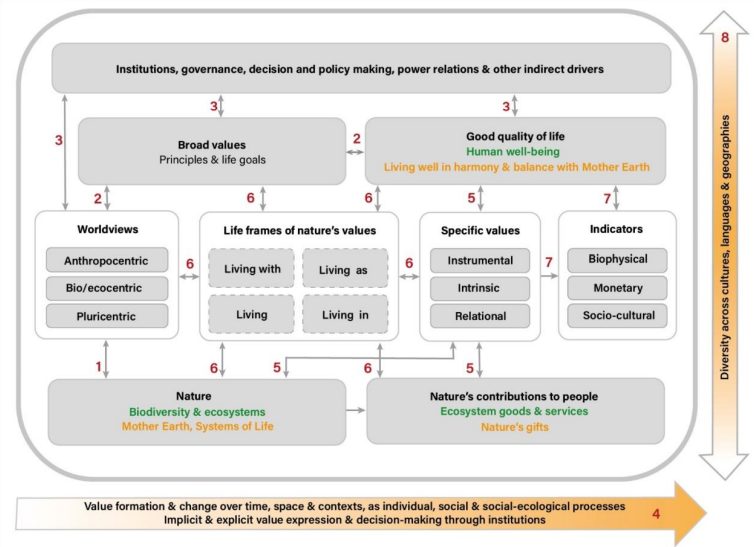
824. Increasingly challenging control problems (Andreries 2025)
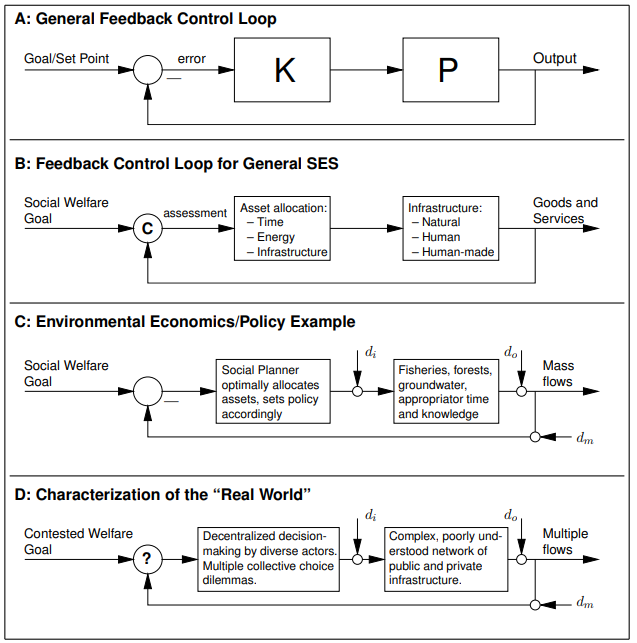
825. Living in the milieu (Droz 2021)

826. Responsibility for environmental harm and reparative actions (Droz 2021)

827. Economics education (Tallgauer and Schank 2023)

828. Decentring the social (James 2017)
Thus the human has been decentred, while the social is given complex and variable meaning. The natural is treated as both grounding and extending infinitely beyond the social. And through the domain of the ecological—defined as a social domain that emphasises the practices, discourses, and materialities that occur across the intersection between the social and the natural realms—the environment of things, processes, and assemblages comes right into the centre-point of what it means to be human. In this way, the centre-point of the circle, which in Euclidian terms has no size, large or small, becomes not a plughole but the point of intersection of all social things—even as for analytical purposes they can be separated out.

829. Social Futuring Index (Szanto and Mueller 2022)

830. Wisdom (Intezari 2015)

831. Typical! (Roggema 2023)
Responses to climate change

832. Responses and complexity (Roggema 2023)

833. Future uneasiness (Roggema 2023)

834. Integrated social-ecological system (in mangroves) (Dahdouh-Guebas et al. 2021)

835. Mangrove silviculture in a historic context (Dahdouh-Guebas et al. 2021)
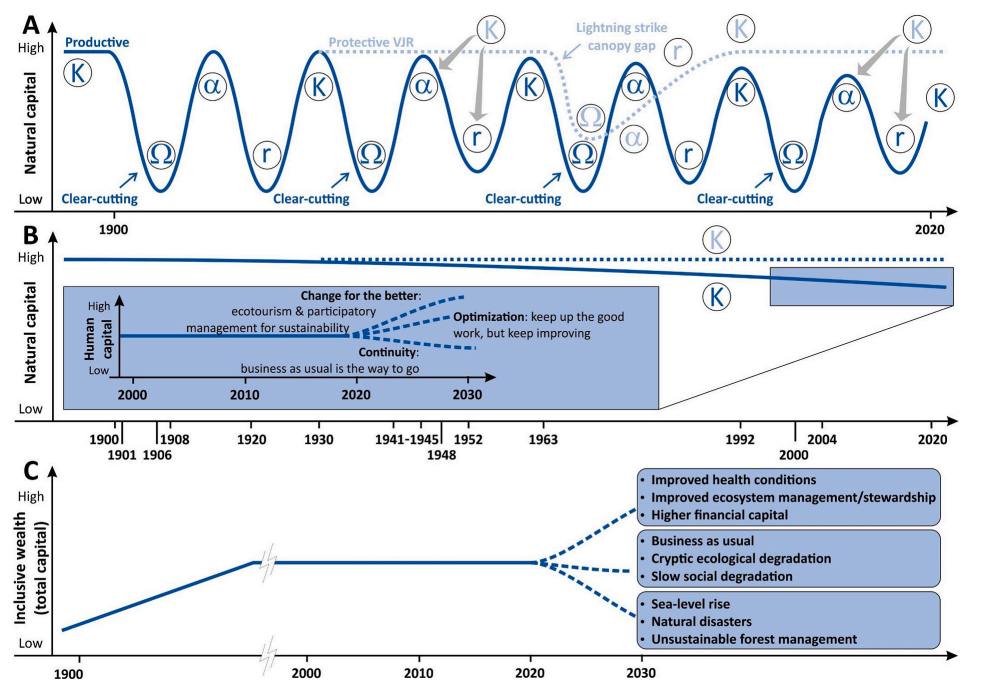
836. Vagabond trap (Dahdouh-Guebas et al. 2021)

837. Enabled levers (Diaz et al. 2018)
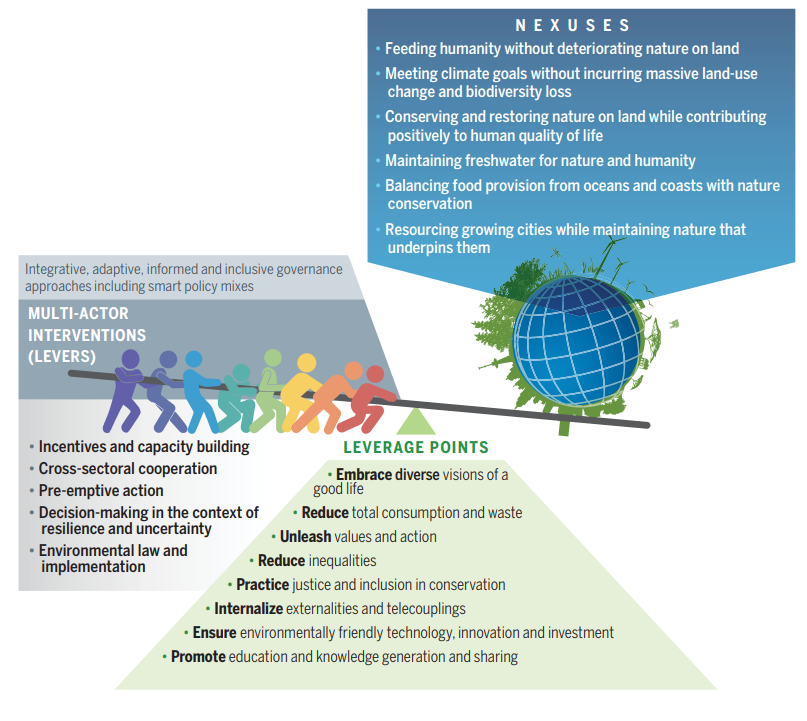
838. Planet at the core (Oliveira et al. 2021)

839. Framework for societal transformations (Patel et al. 2022)

cf current societal dynamic

840. Values as leverage points (Horcea-Milcu 2022)

841. Collective exploitation (Mathias et al. 2020)

842. Riskscapes (here climate change is the risk) (Müller-Mahn et al 2020)
Conceiving riskscapes as temporalspatial phenomena implies that time and space are intricately connected in their constitution, that is, in their duration and spatial expansion. Figure 4 visualises this concept by putting the concurrent immediacy of risk in the middle of a subject-centred riskscape, where the physical (material, spatial and temporal) and/or psychological distance of risk is closest, and where
decisions are made and action taken. Material conditions, discourses and practices meet at this
centric point of immediacy. They are structured along a gradient of temporal and spatial diffusion,
which determines the distribution and scale of hazards, the progression of uncertainty, the intensity of perceptions, communication and values, and agency, capacities and control.

843. I think it is strong sustainability but somehow in a different order and 3D (Sulitest)

844. Flourishing Ecological Self (Flourish Project 2022)

845. Six Pathways to a Thriveable 2050 (Wood, Estonian Association for Quality 2021)

846. Circular Humansphere (Lemille 2019)
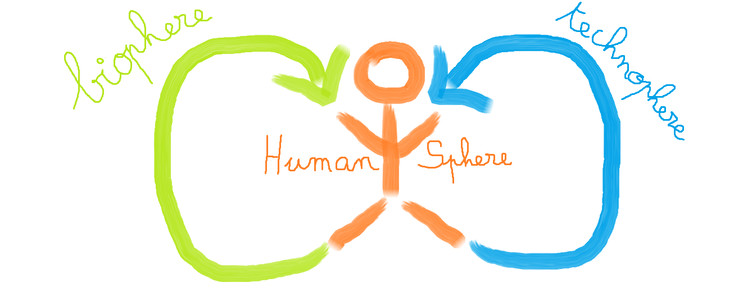

847. Circular Humansphere (Lemille 2020)

847. Preserving Life on Earth Thinking Pathway (Lemille 2020)

848. Aesthetic value (Turan and Cetinkaya 2021)

849. Mental health (notice the pillars on the outside) (Lawrence et al. 2022)

850. Risk propeller (IPCC 2022)

851. Connection (Parmesan 2022)
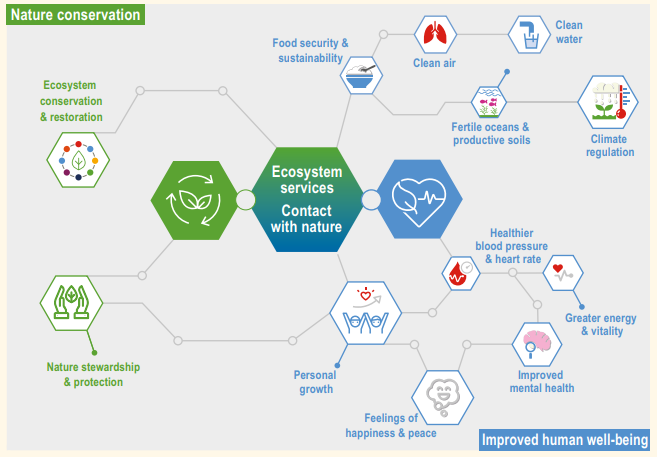
852. Decision-making framework (Parmesan 2022)
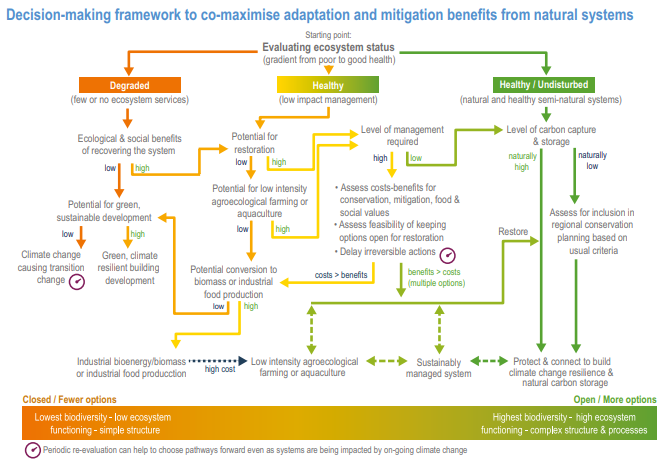
853. Narrowing window (IPCC 2022)

854. Compound, cascading, complex and transboundary (IPCC 2022)
Compound, cascading and transboundary impacts for humans and ecosystems result from the complex
interaction of multiple climate hazards, exposures and vulnerabilities
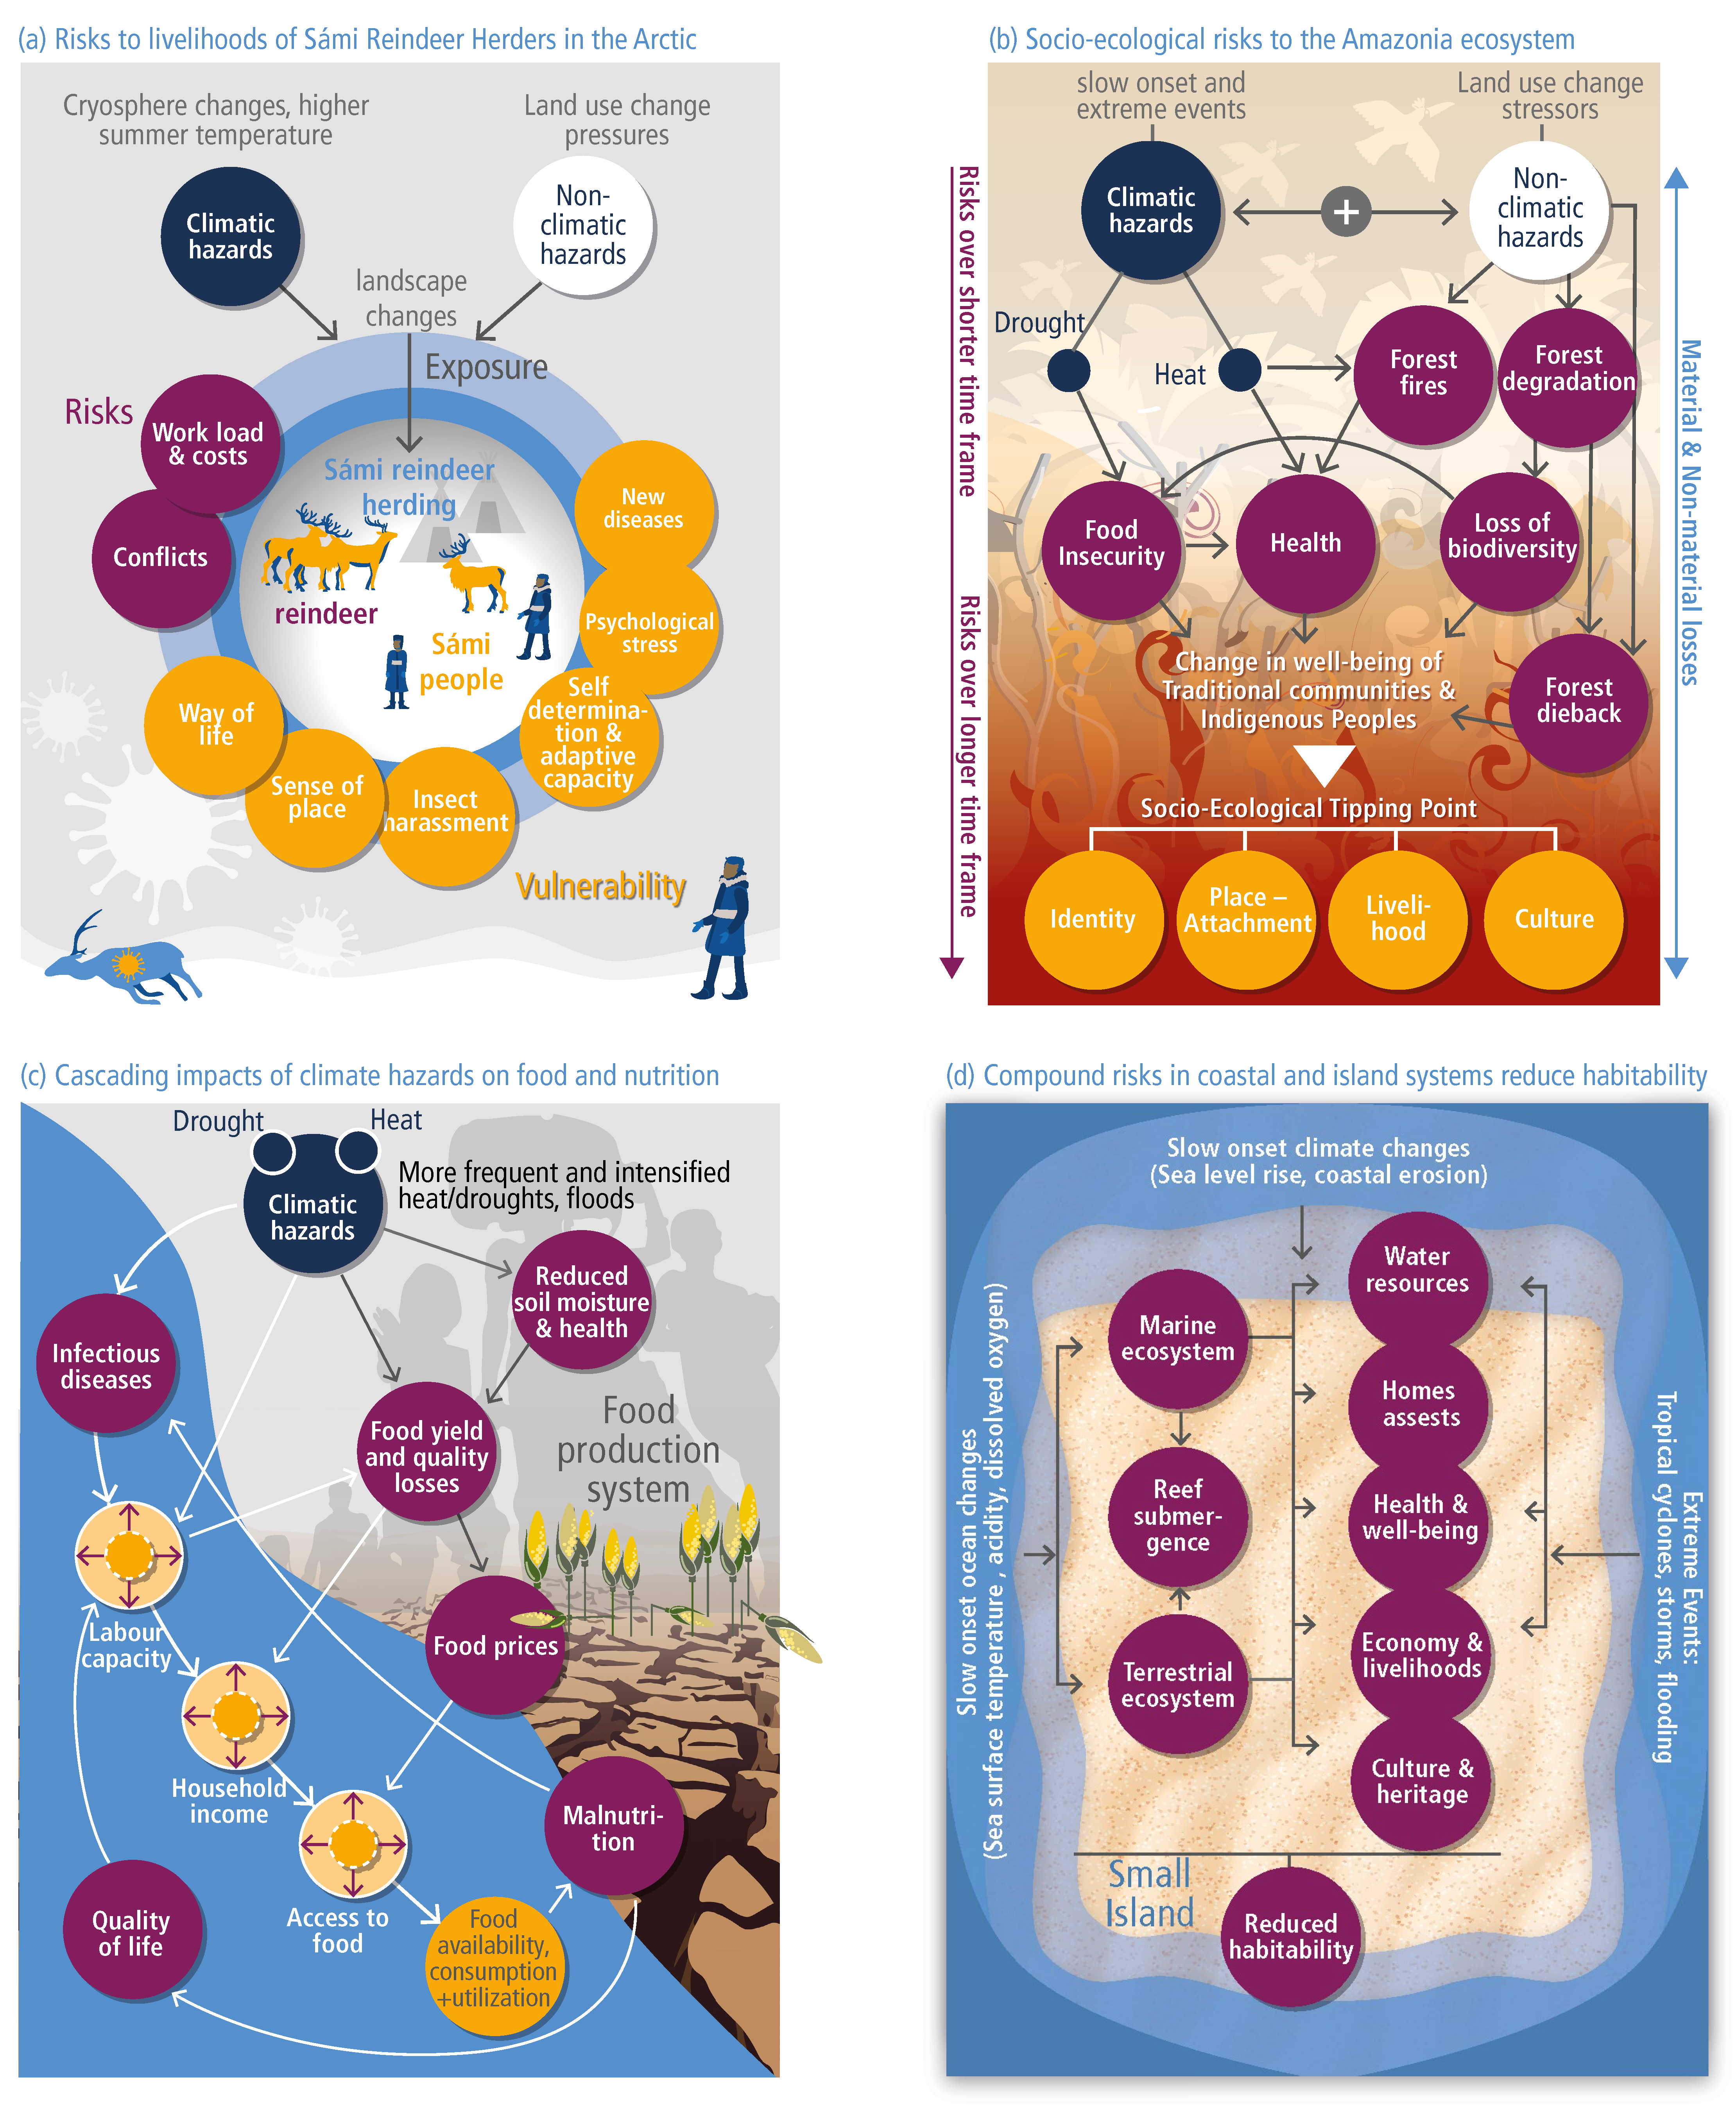

855. Connected concepts (IPCC 2022)

856. Pathways to transformation (IPCC 2022)

857. Human dimension is the nexus (IPCC 2022)
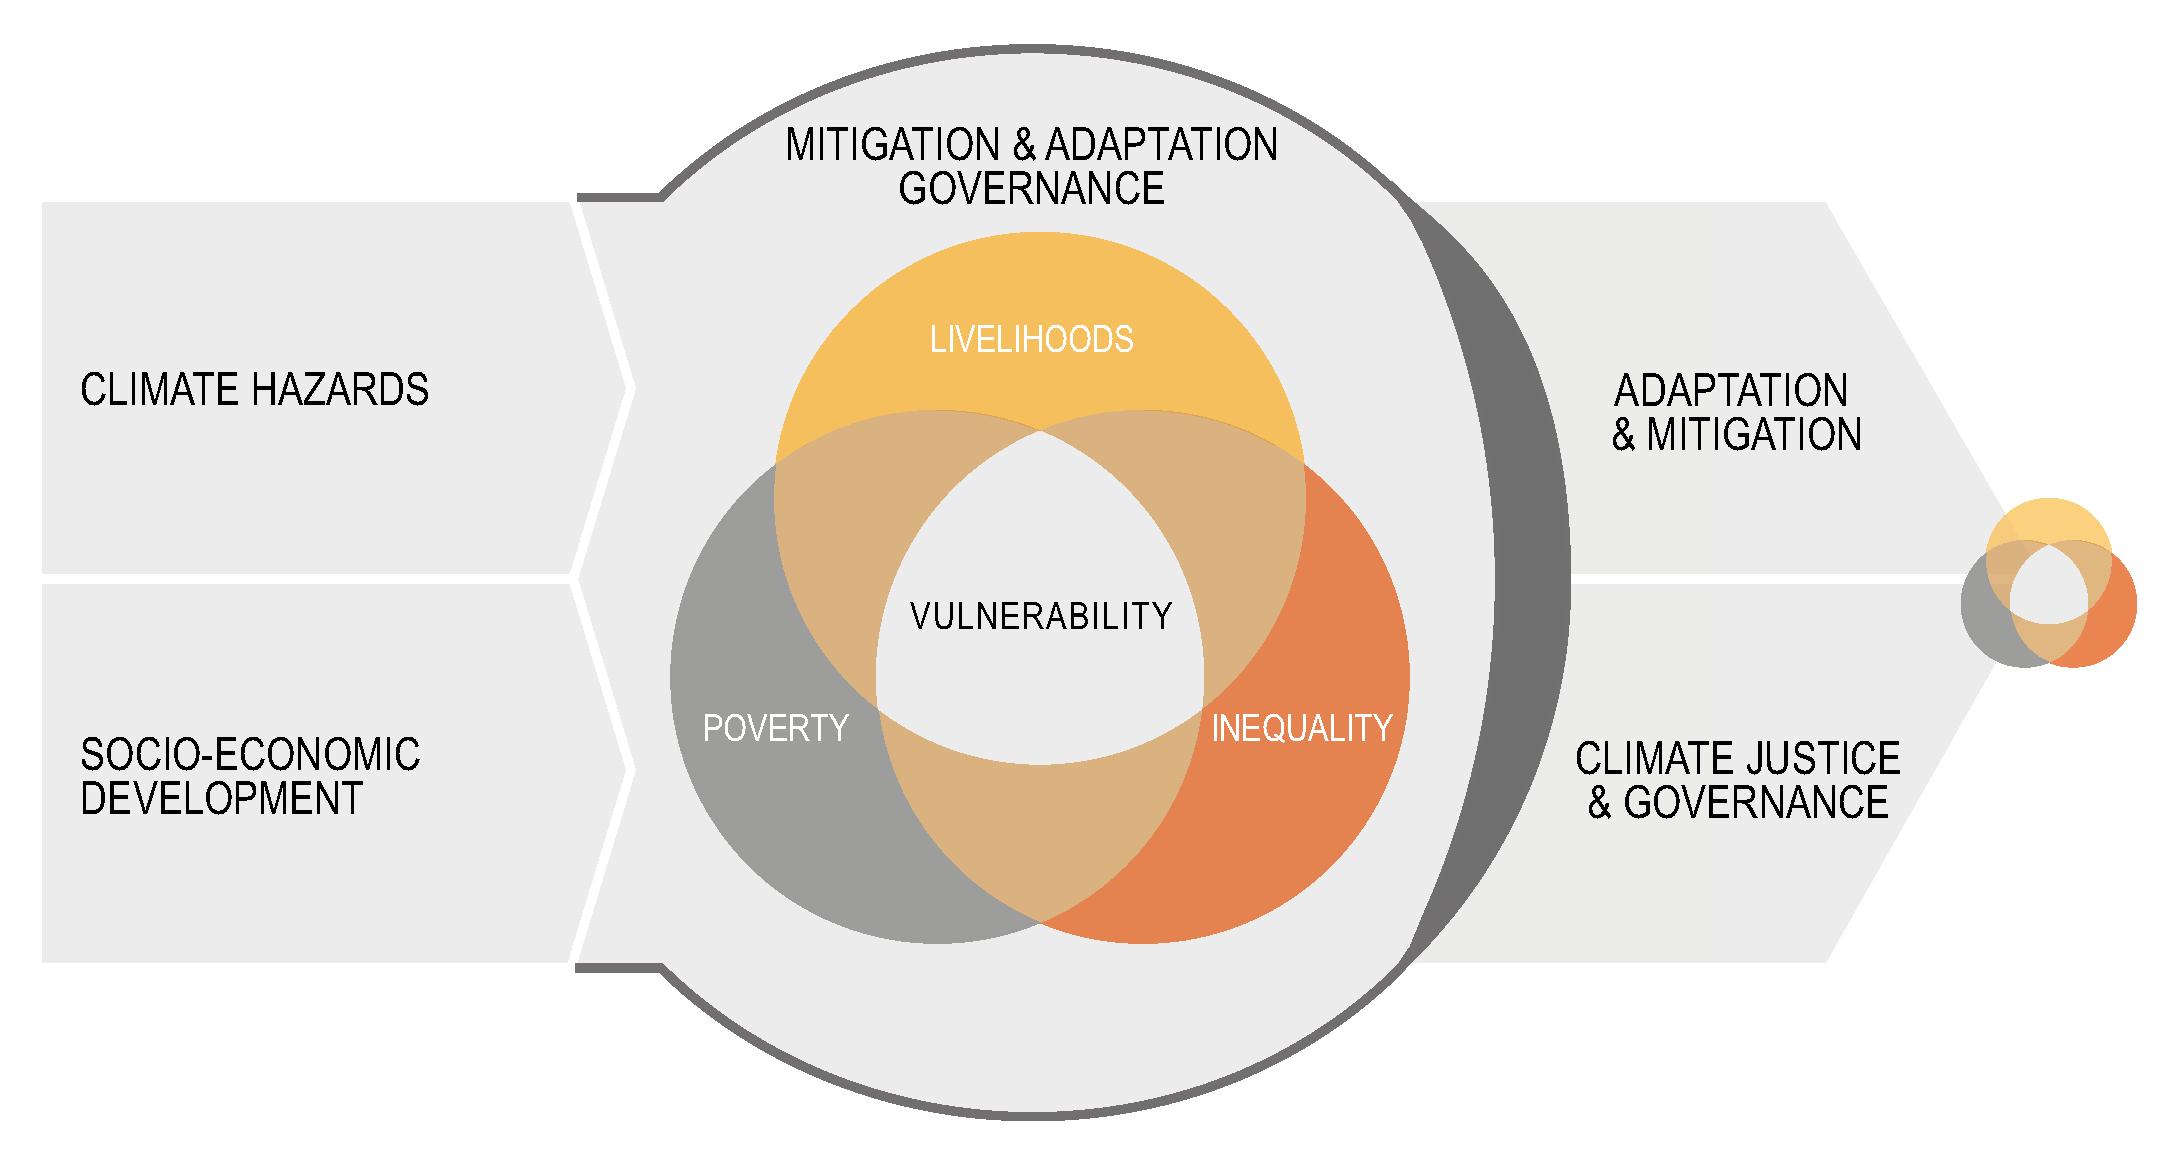
859. Social tipping point (IPCC 2022)
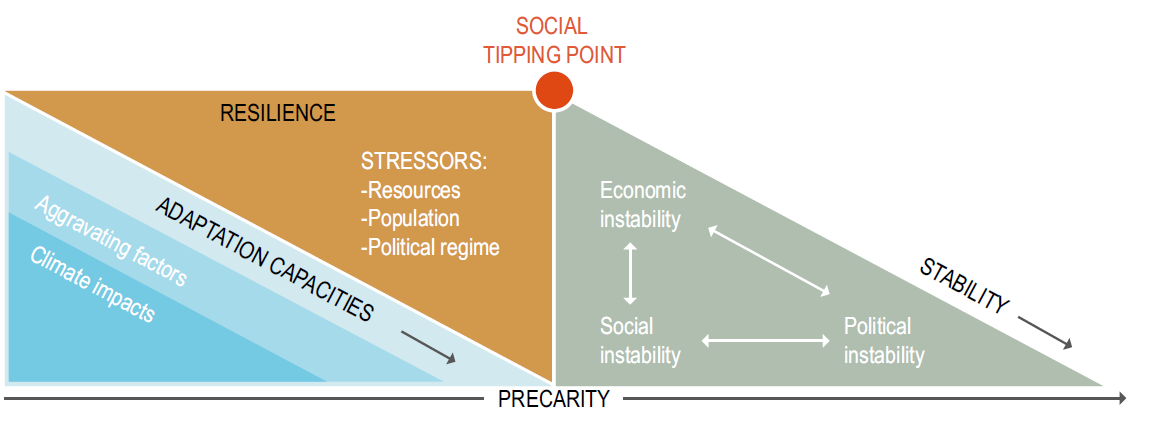
860. Adaptation gap (IPCC 2022)
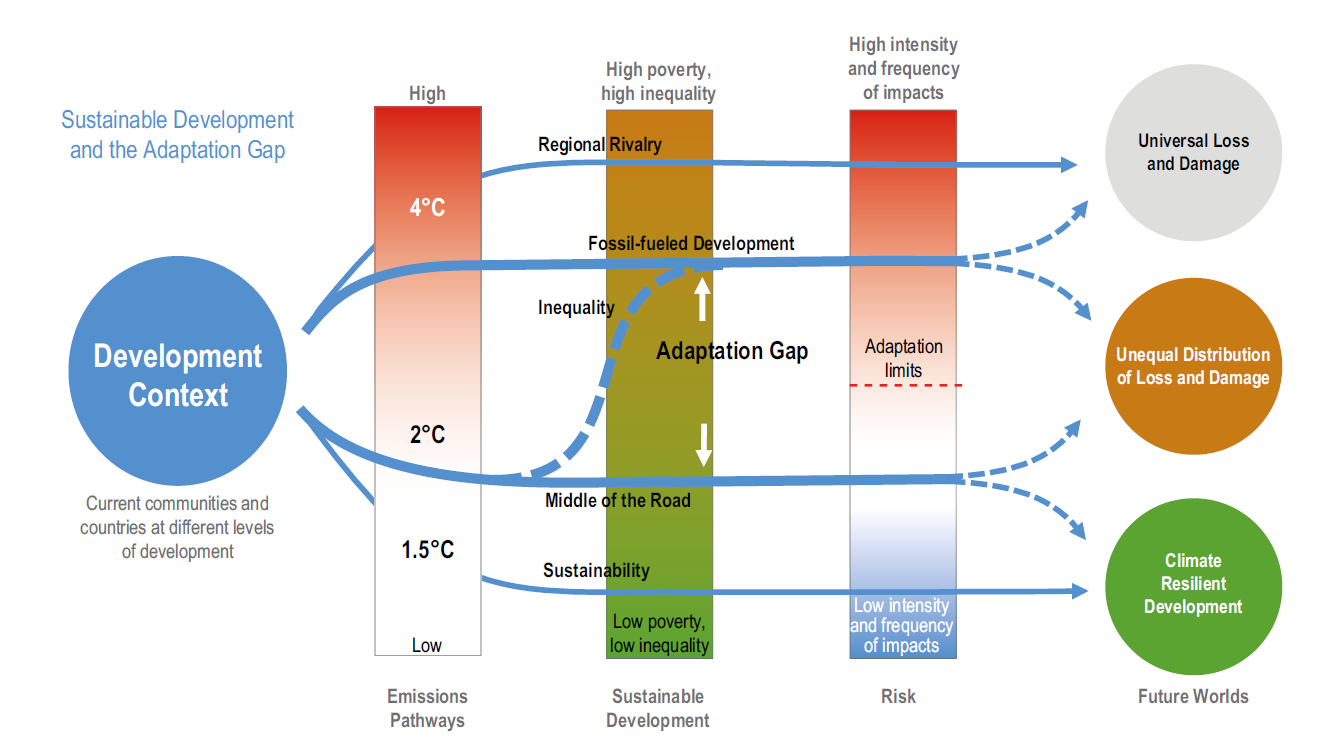
861. Societal choices towards Climate Resilient Development (IPCC 2022)

862. Transformative actions towards Climate Resilient Development (IPCC 2022)

863. Multiple intertwined climate resilient development pathways (IPCC 2022)

864. Ecopyschology (Fisher 2019)

865. Re-orientation (Steiner 2022)

866. Rainbow model (of ocean health – after Dahlgren & Whitehead which is after Brofenrenner’s ecological model of health) (de Salis 2022)
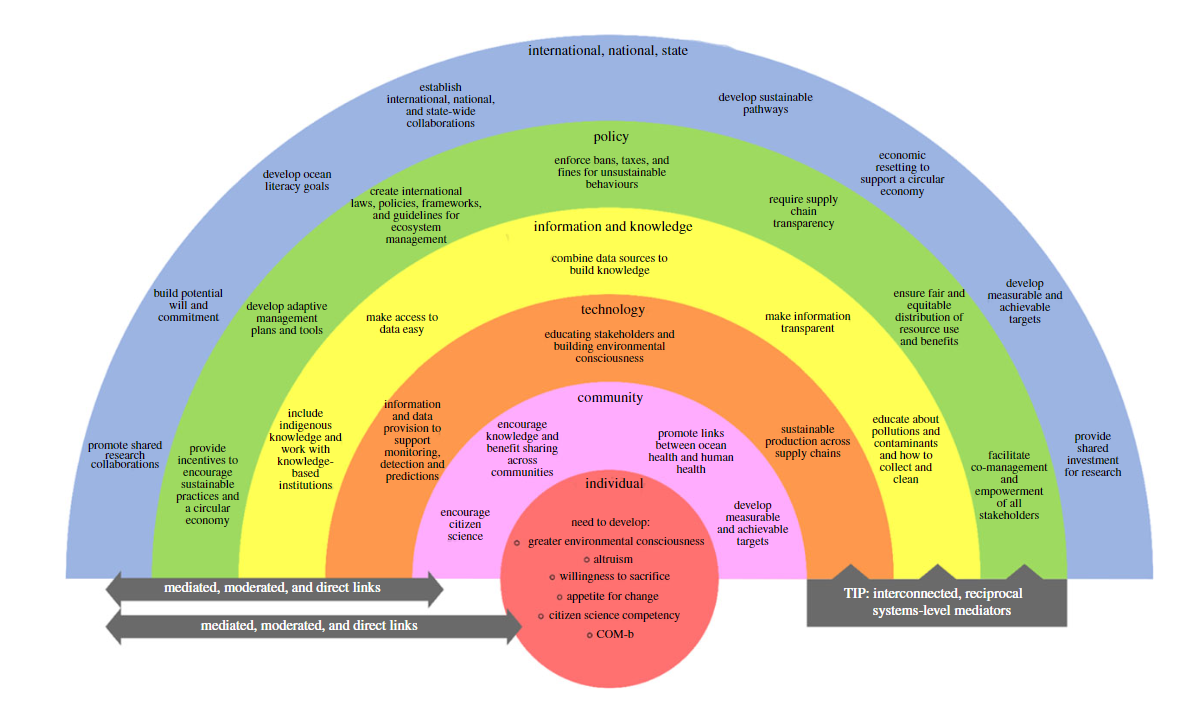
867. Dancing with Dugongs (Dennison 2013)

868. Child-centred SDGs (Bruckauf and Cook 2017)
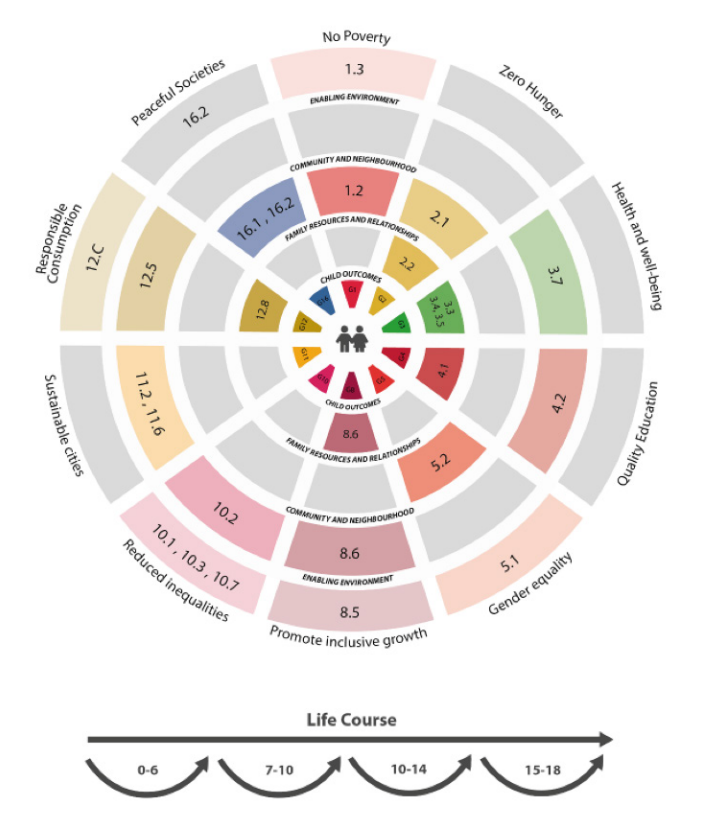
869. Traits of social-ecological system for sustainability (Andersson 2021)
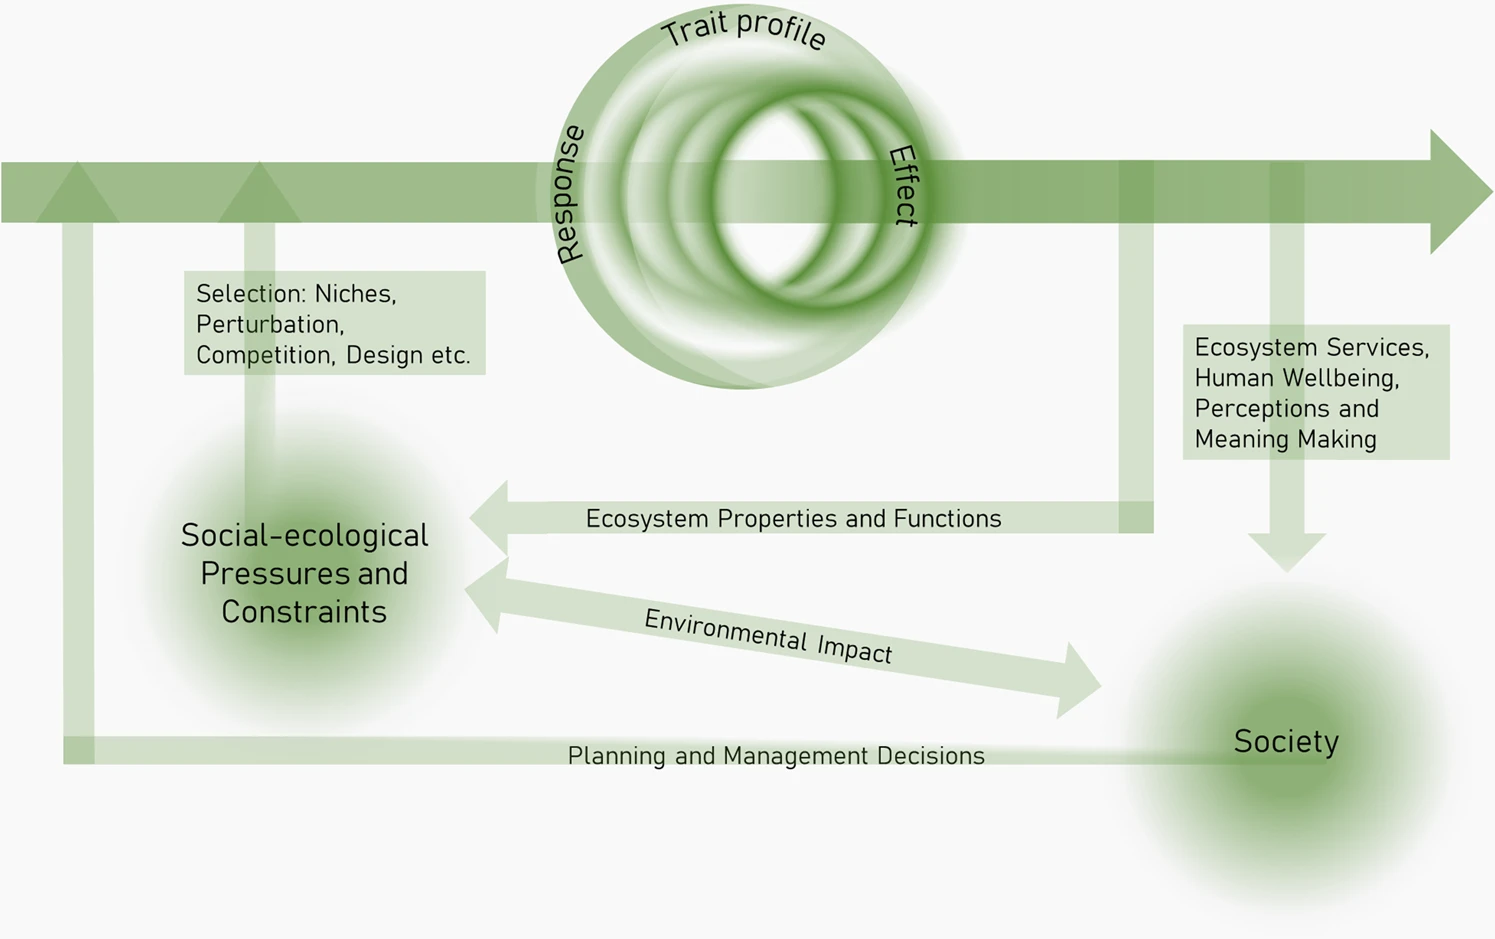

870. Collective Stakeholders (Hörisch 2014)

871. Drain or Sustain (LAYA and Samuchit Envio Tech)
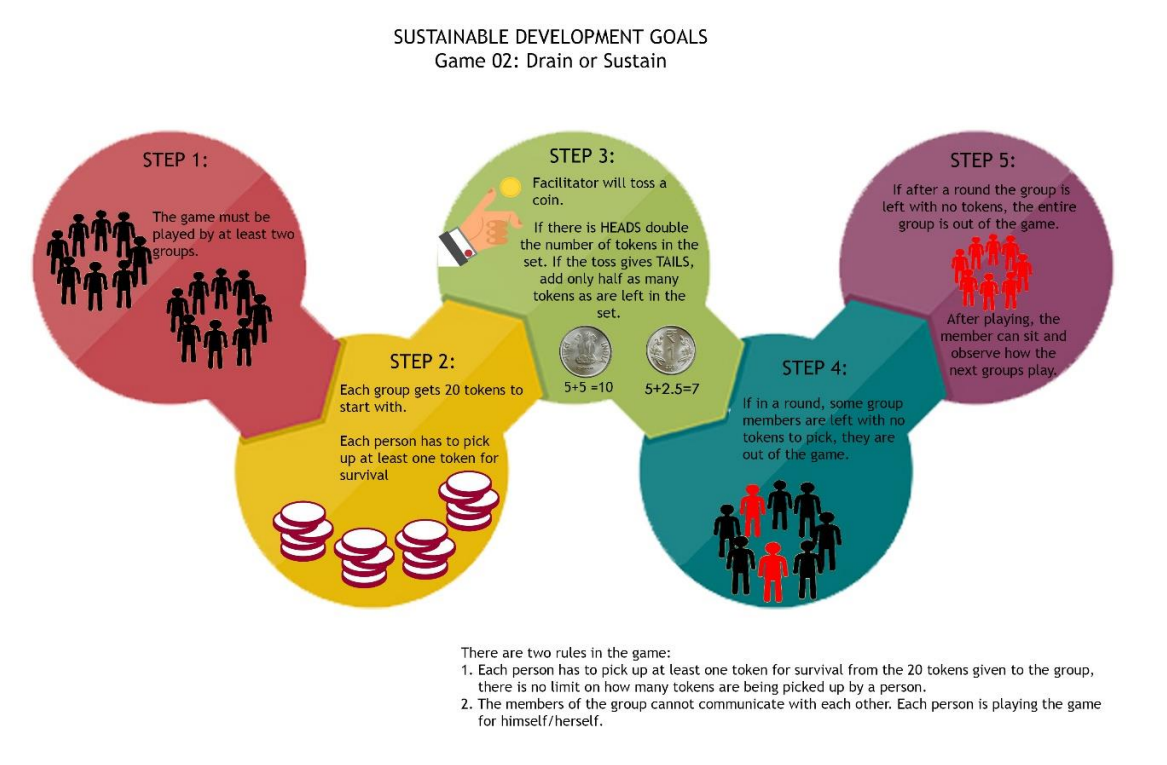
872. More equitable and effective restoration (Lofqvist 2023)
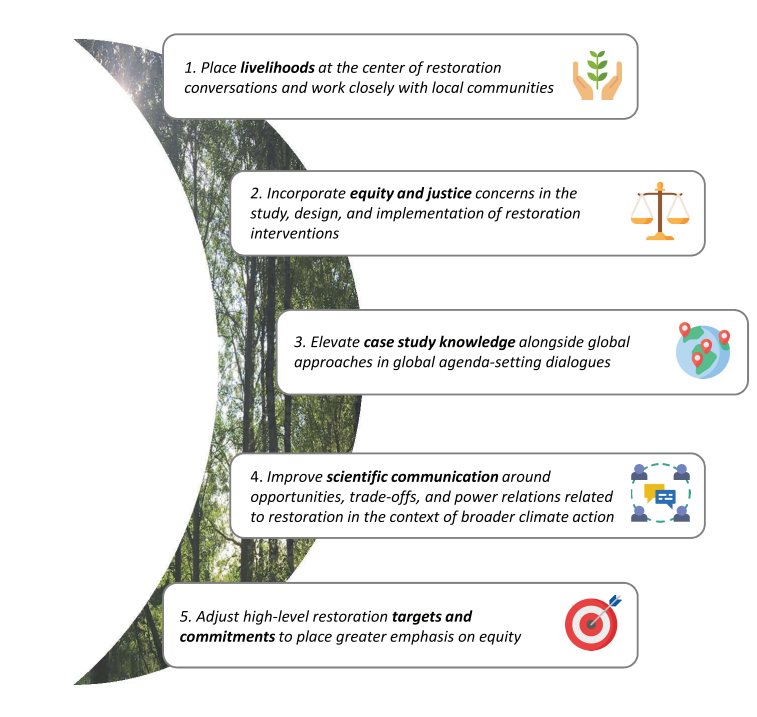
873. Coevolving pathways of development (Haider 2021)
ractices are filtered by a set of constraints, opportunities and choices defined by myriad factors, ranging from social to ecological, endogenous to exogenous and active to passive (represented by different colours). Each filtering process creates the conditions for new development pathways to emerge. The filters are drawn as traditional winnowing baskets as used in the Pamirs Mountains

874. Transdisciplinary Sustainability Research (Pohl 2021)
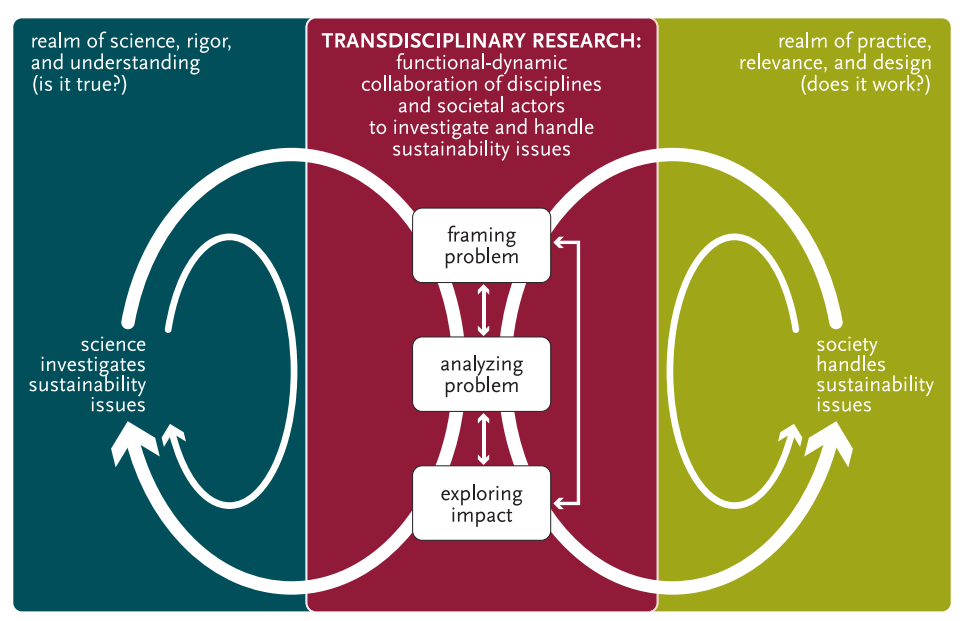
875. Sustainability Science Framework (Clark & Harley 2020)

876. Capacities for sustainable development (Clark & Harley 2020)

877. Opening the human spirit to sustainability transformation (is the graphical abstract for Müller 2023)

878. Denial in environmental communication (Boehnert 2013)

879. Sustainability equation (Weinstein 2012)

880. Overcoming the paradox (Weinstein 2012)
Resolution of the ” paradox of the dual mandate ” —reconciling society’s desire to preserve, restore, and rehabilitate natural ecosystems while at the same time ensuring the provision of reliable, predictable, and stable supplies of goods and services—will be a key component of any future success

881. Ecosystem services as a boundary object for sustainability – three types of knowledge (Abson 2014)
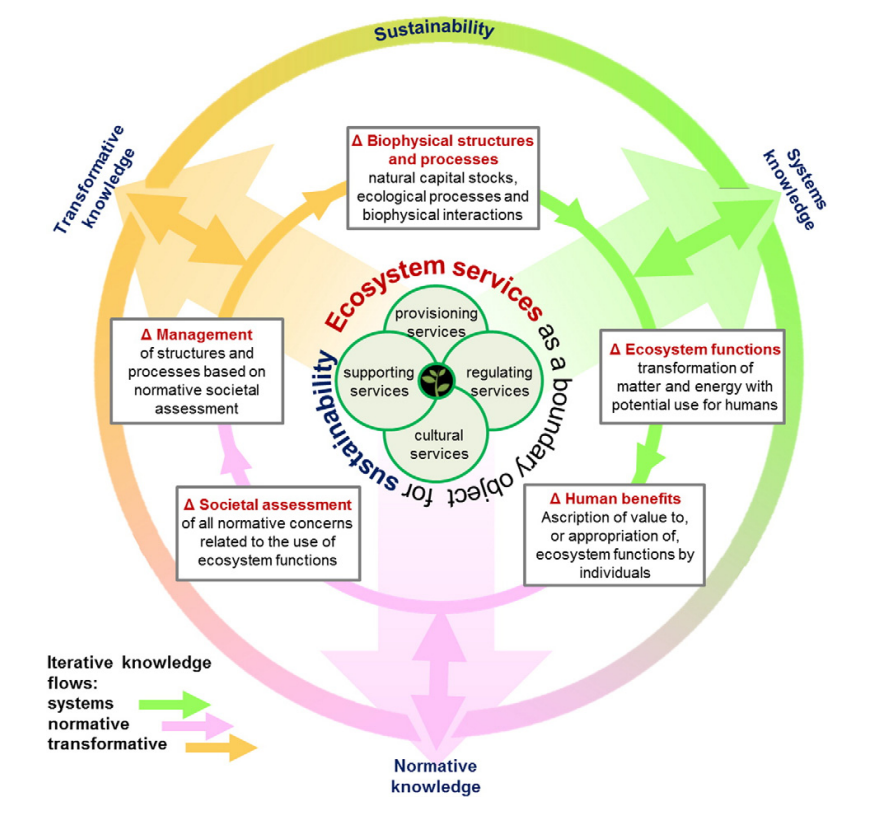
882. Consequences of a mental model (Vanasupa 2010)

883. Expanded IPAT equation (Vanasupa 2010)

884. Plural values (Coelho-Junior 2021)

885. Humanising Education from Sustainable Ecosystem (International Islamic University Malaysia)

886. Pillars but as a system (EPA Environmental Protection Agency)

887. Interdependencies (Reyers 2020)

888. SDGs in the mangroves (Eyzaguirre 2023)
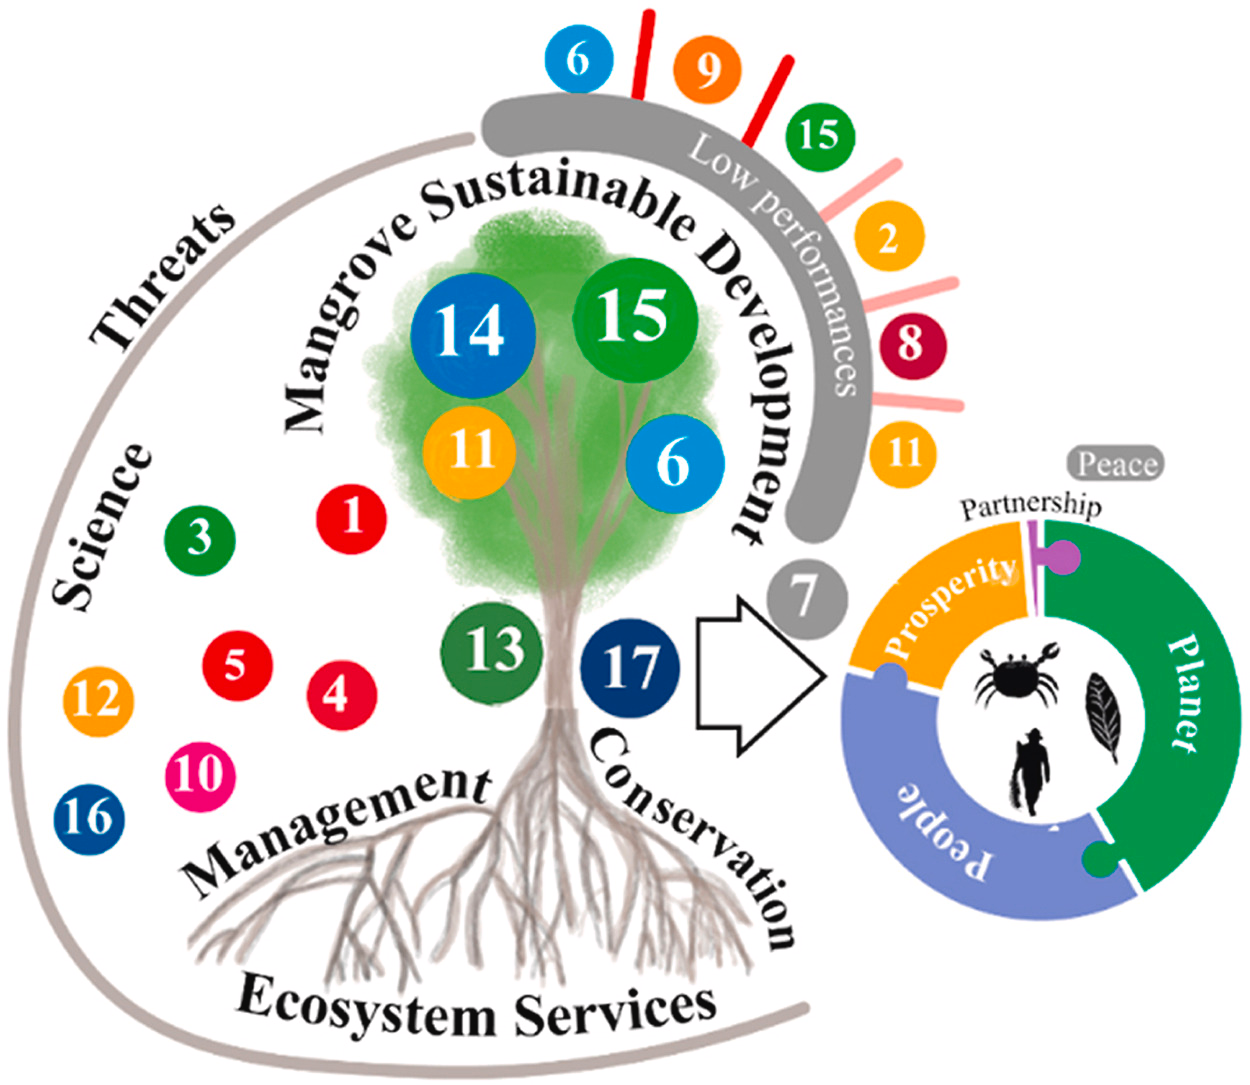
889. A tiny slice of partnership pie Eyzaguirre 2023)

890. Framework of change (Cammarano 2021)

891. The Sheriff’s arrived. (Misra 2017)

892. Dynamics of sustainability (Najjar 2022)

893. Classical sustainability model associated with the traditional poles of conflict (Najjar 2022)
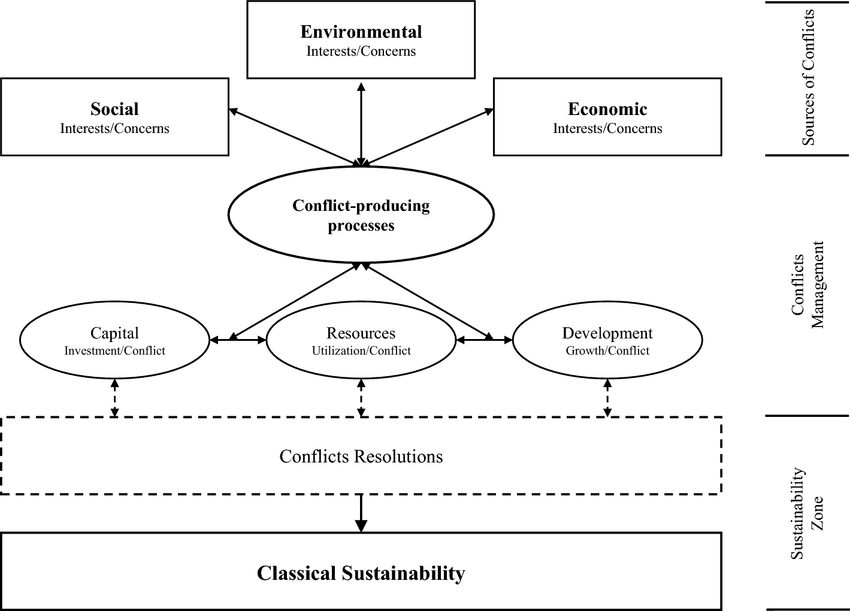
894. Classical sustainability within a divided world (Najjar 2022)

895. (Najjar 2022)
“… set forth an innovative outline definition that copes with the multiple spatial aspects of sustainability. Namely, a revolutionary concept that assures sound development which respects ecological balances, social justice and economic prosperity, in parallel to inclusive temporal analysis in incorporating effectively the cultural and the historical domains.
‘‘This [model] adds a new comprehensive time-based dimension allowing the integration of the past of a referenced space by evaluating its cultural and historical identity and to assess the consequential cause-effect impacts of the projected, future development. Furthermore, considering the cultural-historic dimension within the development process enhances the integration toward a well-balanced time scale focusing on understanding a past-present trajectory before linking it into the future.’’
Spatial presentation of the 4DSS model and the generated SEEC orbit (social, economic, environmental, cultural-historical)– centered by multiple polar tensions.
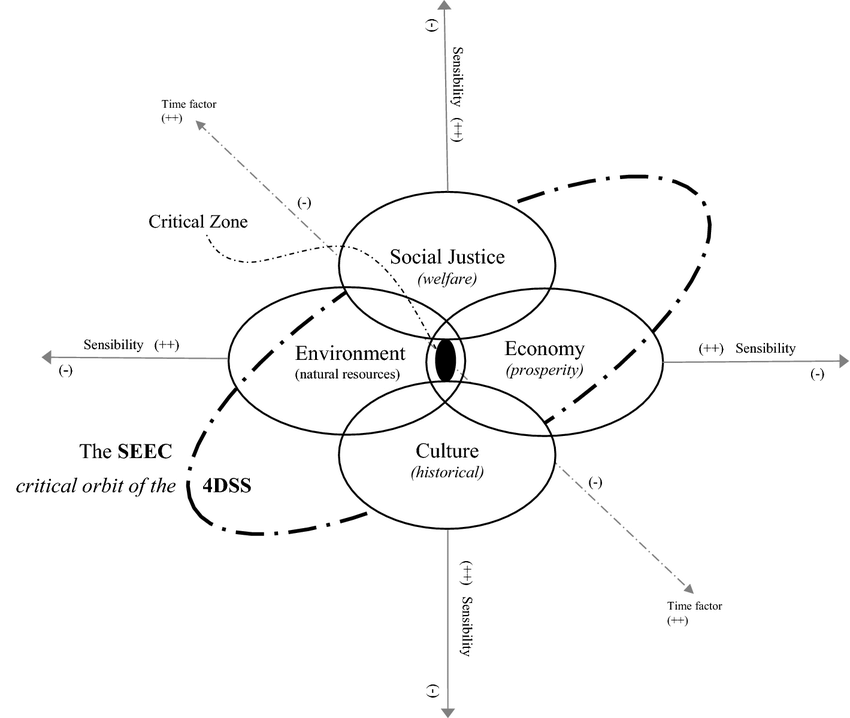
896. Conflict separation model for generating social driving force–short term initiation model (Najjar 2022)

897. Harmonized socially-driven economically centered 4DSS on global scale–medium term impact model (Najjar 2022)

898. Utopia (Najjar 2022)
Utopian Sustainability (UtS): Perfect standardized spatial sustainability (3S) resulting democratically by spatial participative sustainability (SPS) on global scale–long term impact model

899. Pathways towards Sustainable Industry 5.0 (Ghobakhloo 2023)

900. Regenerative business models (Konietzko 2023)
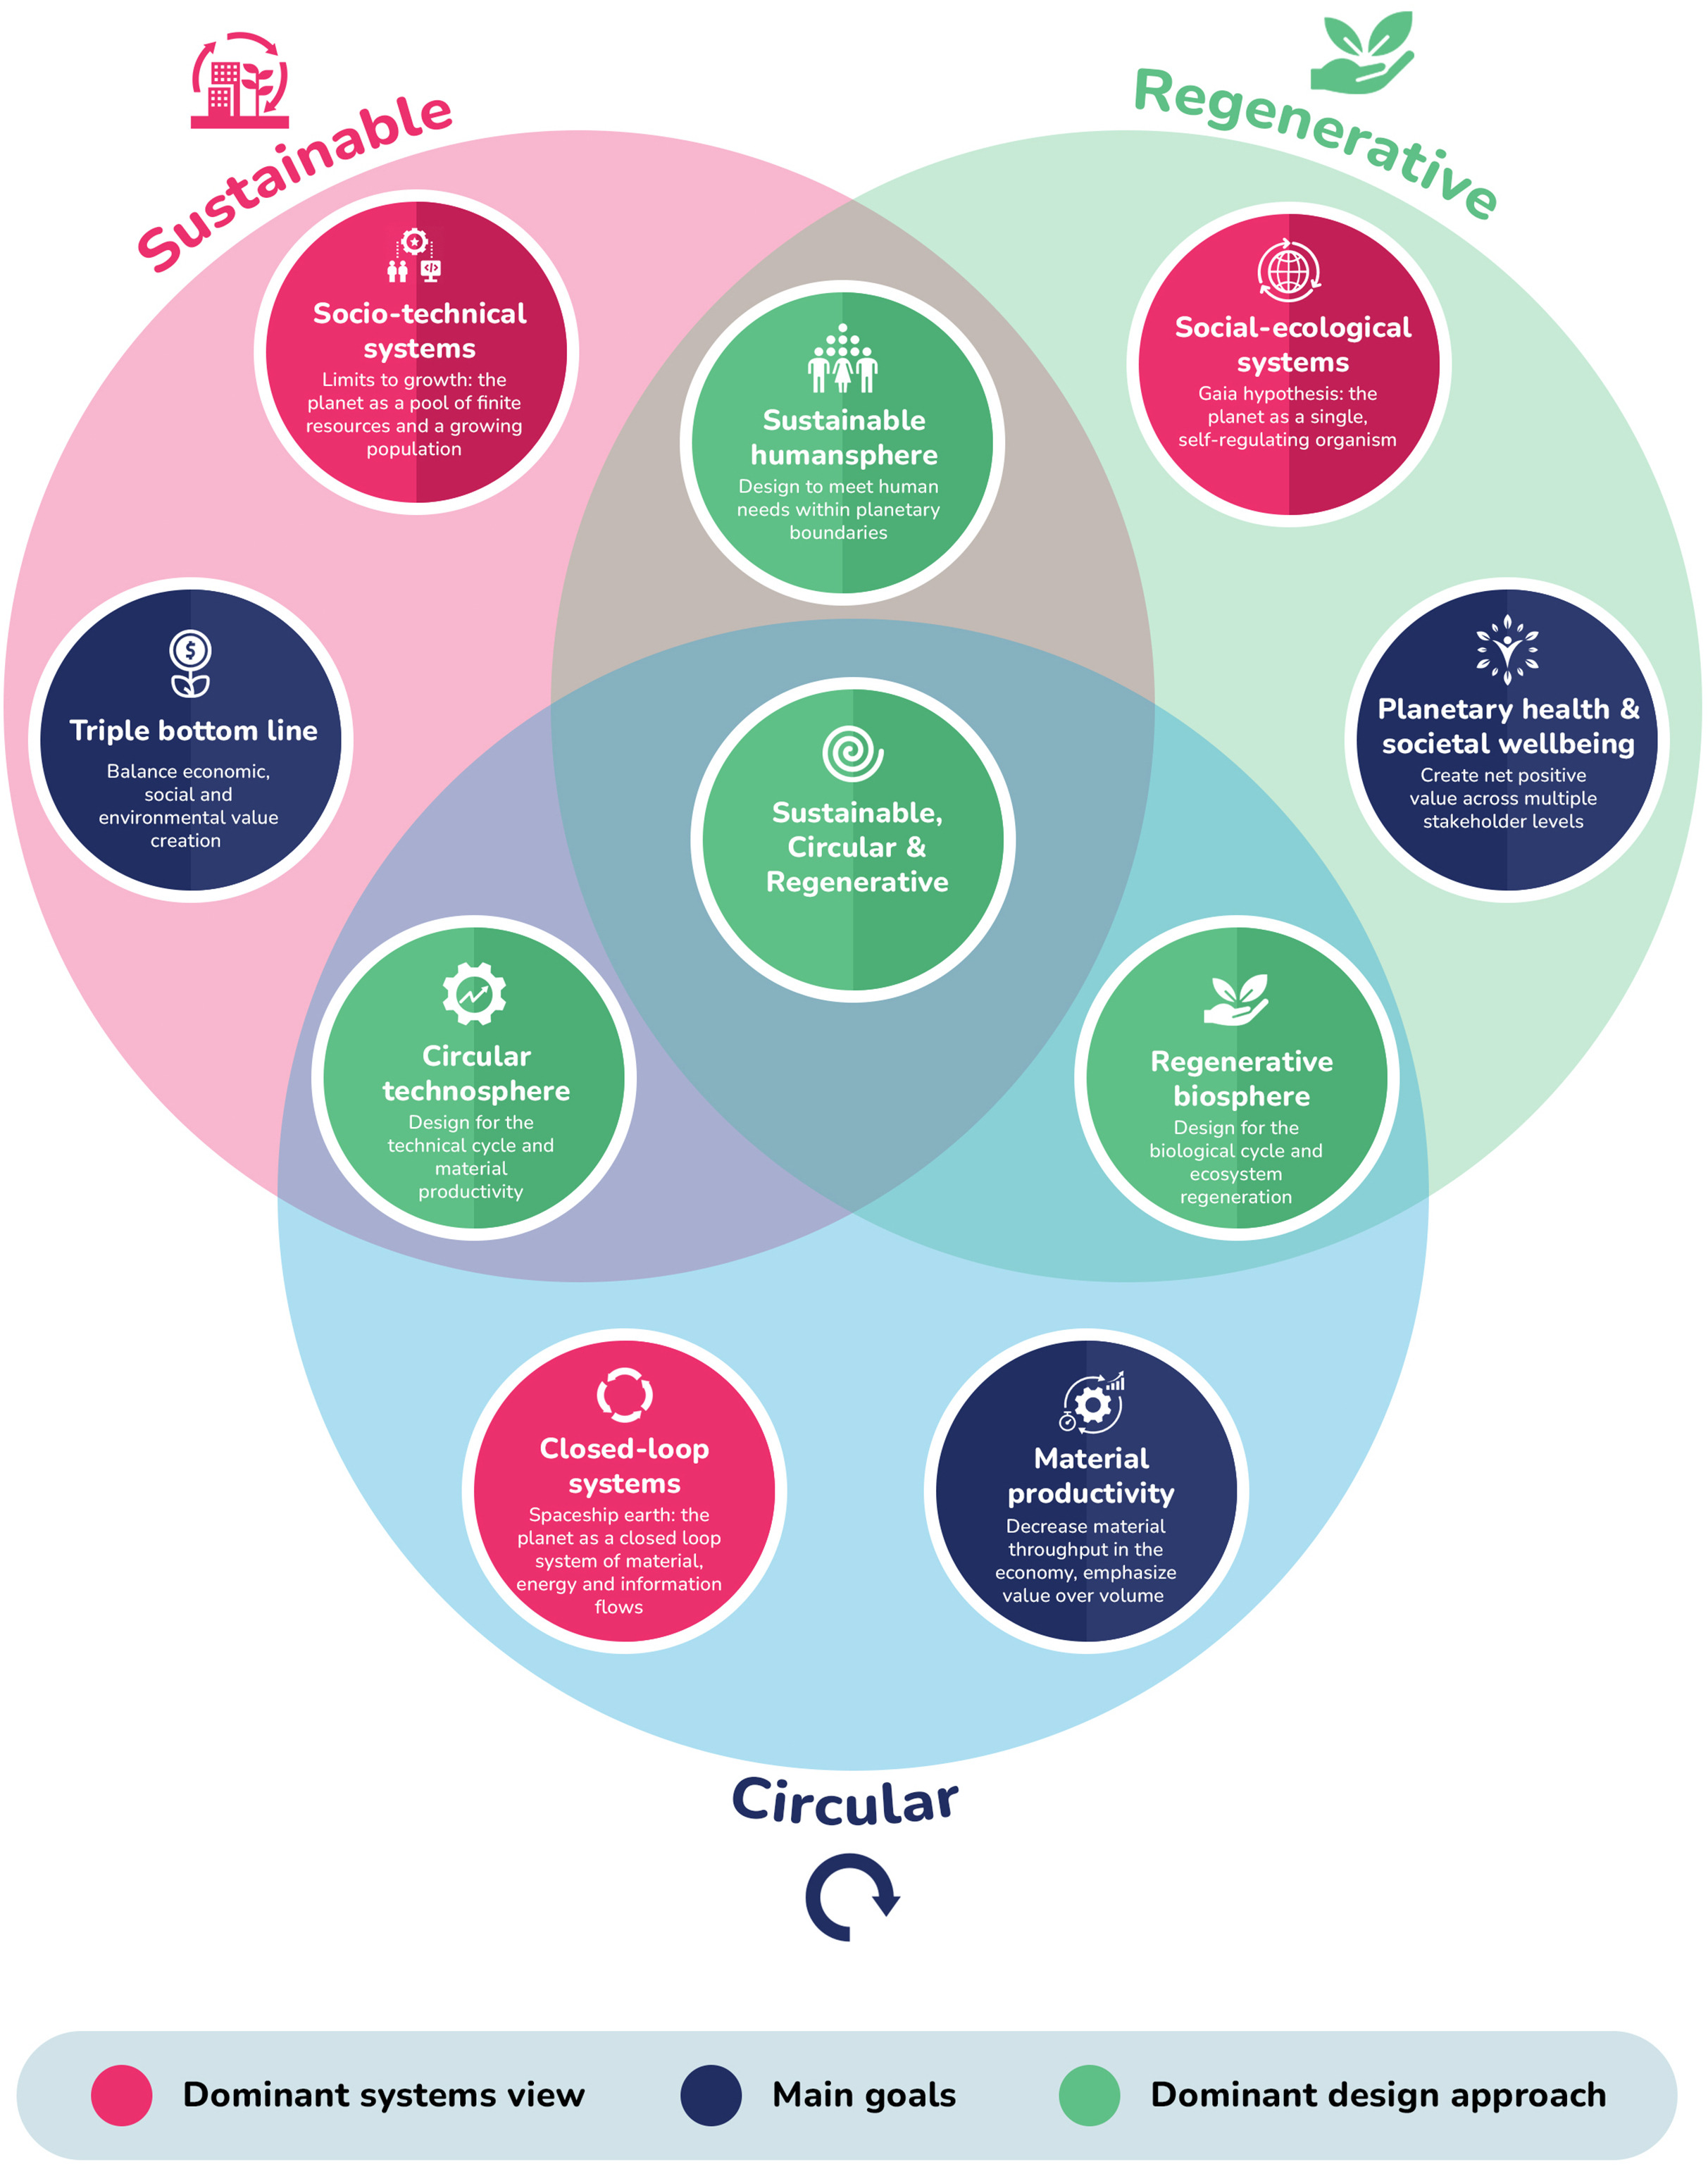
Bonus 1: Marshall Clemens for ShiftN Global Food System

Bonus 2: René Passet 1979 “L’économique et le vivant”
“As a system, I see nothing other than the bioeconomy”.

Bonus 3: Sustainable Transition In Which Nothing Changes (Foxon 2014)
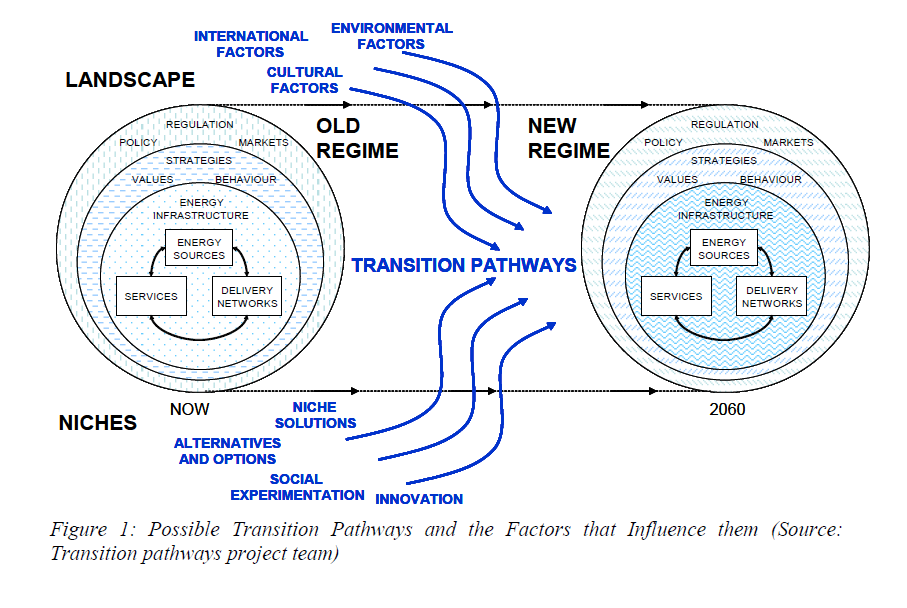
901. Four Urban Futures (Lombardi via Mykhnenko 2023)
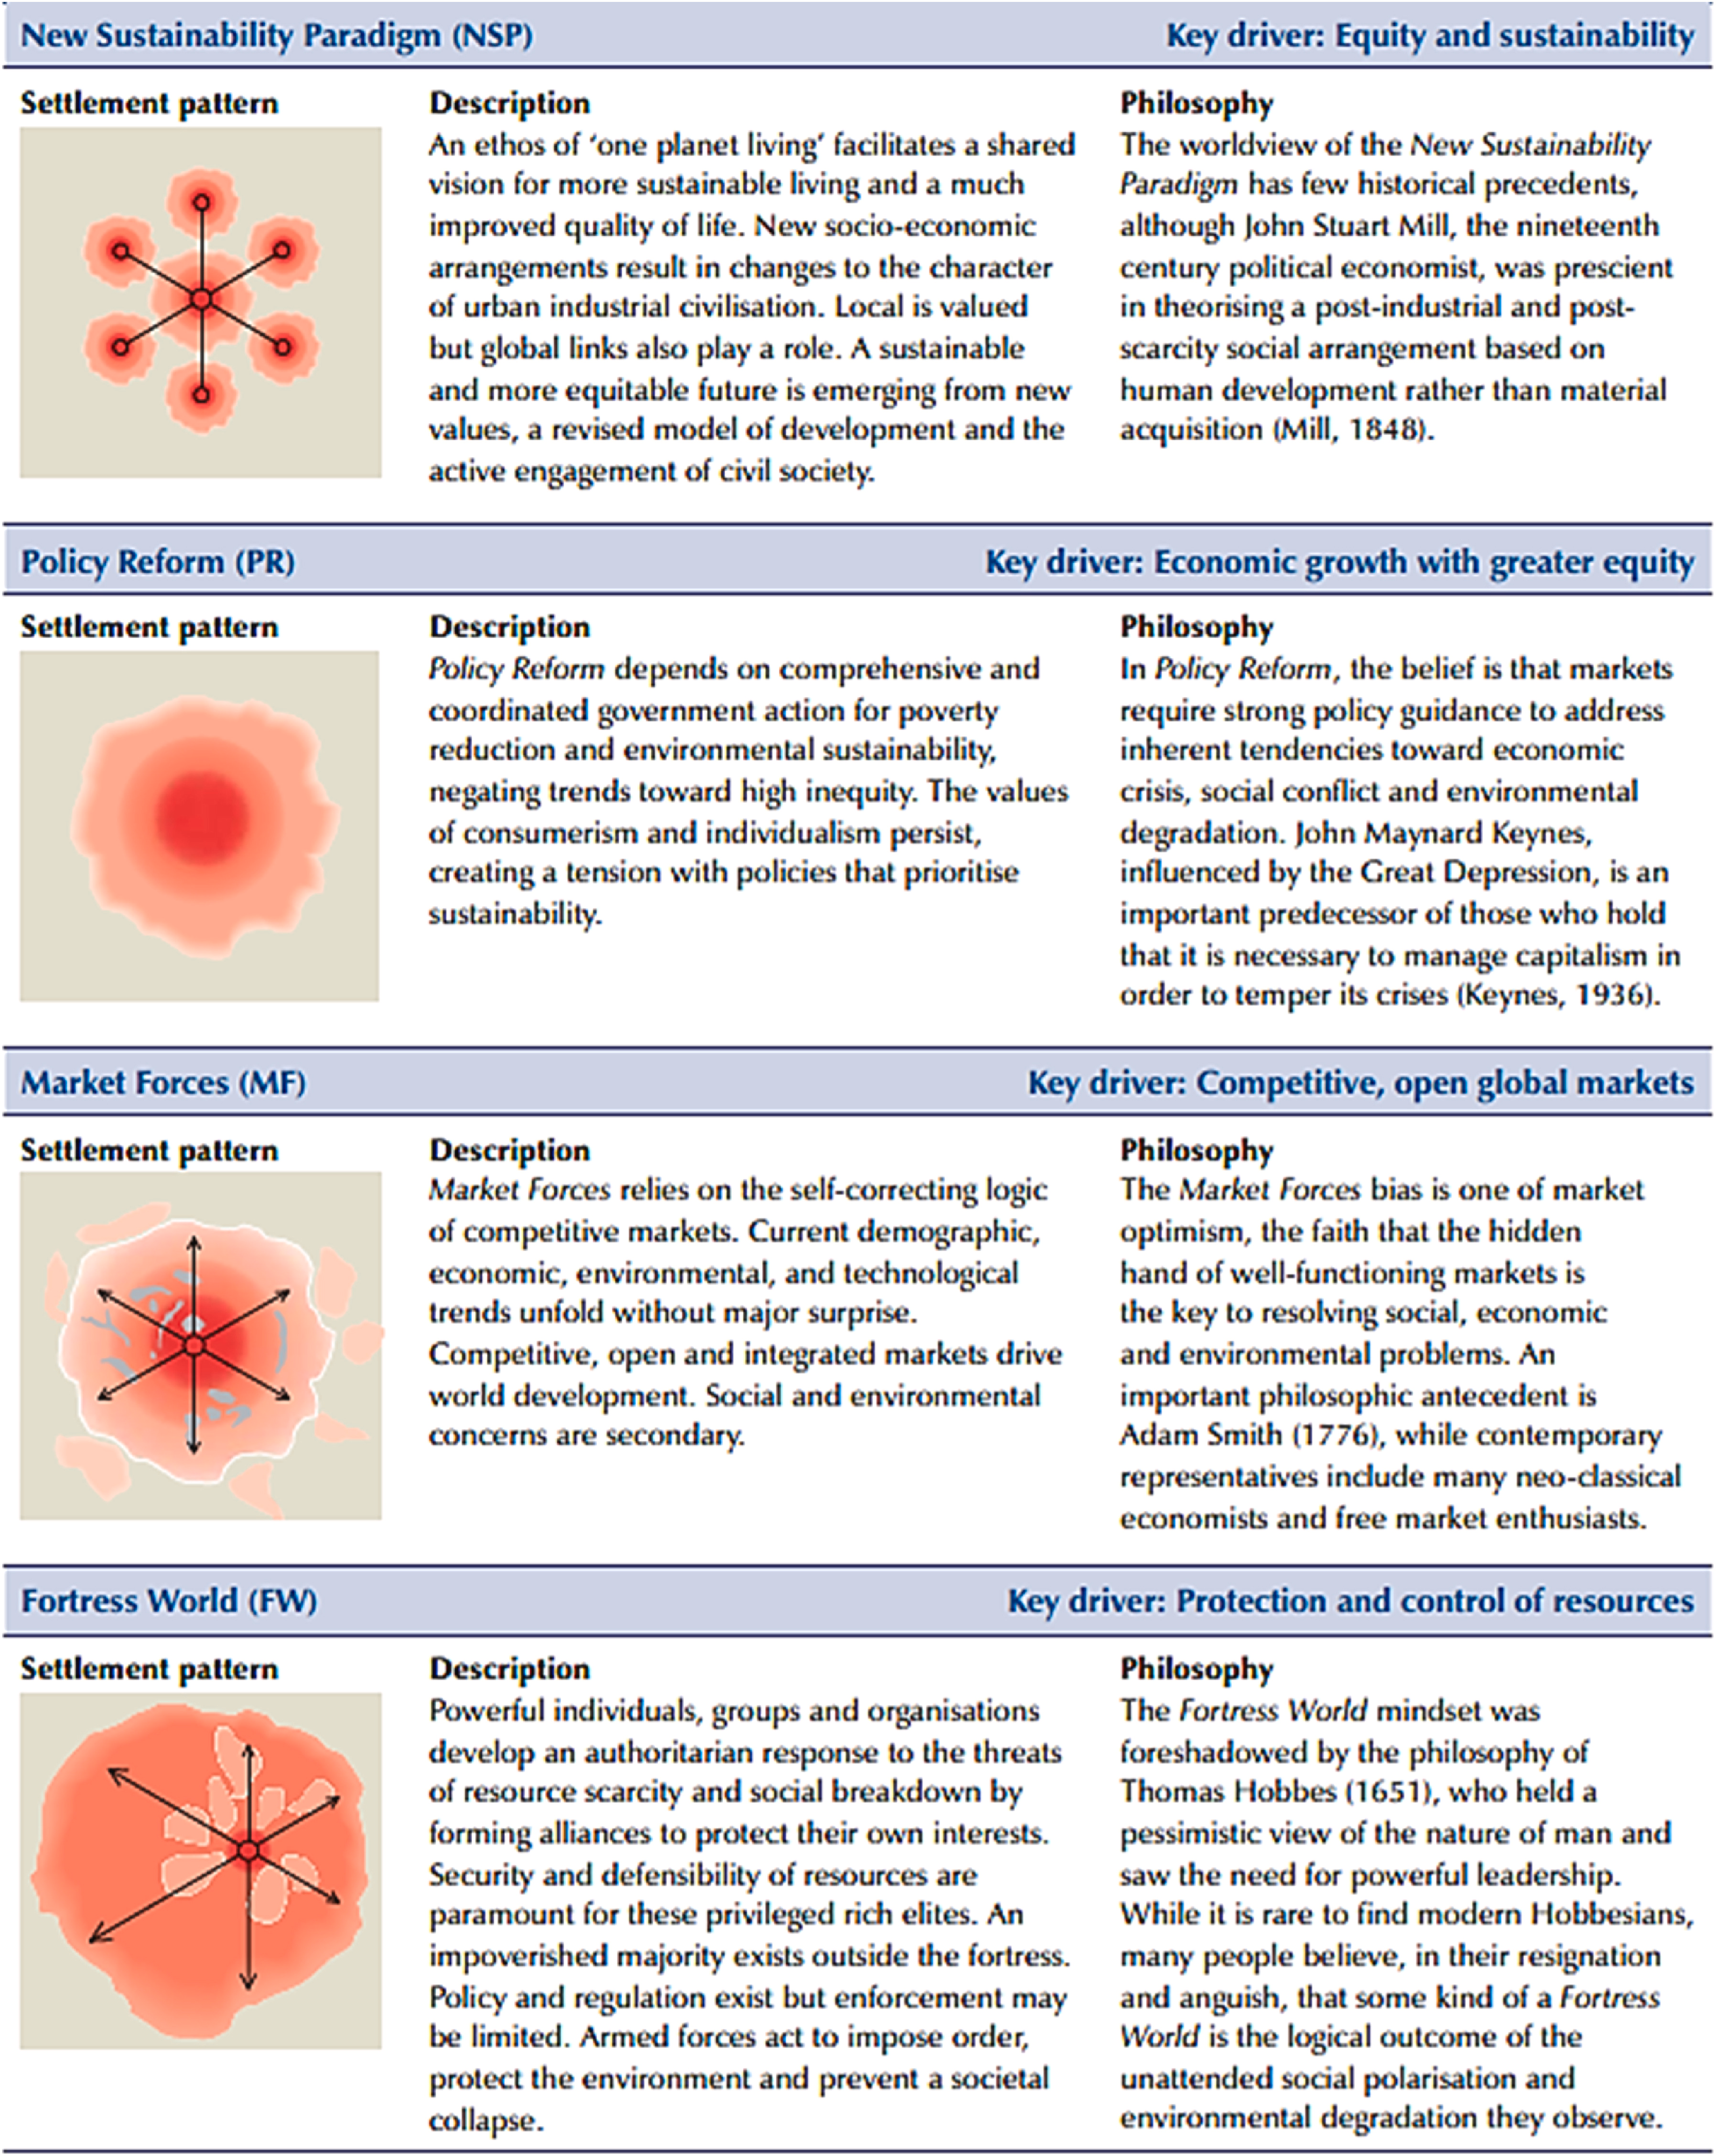
902. All the things (Graphical abstract from Ramakrishna 2022)

903. Six relationships (six wayfinder)

904. Capital Reproduction (Hautamäki 2010)

905. People-with-nature (González 2008)

906. Legacy (Schillebeeckx 2022)

907. Nature Tech (Schillebeeckx 2022)

908. Sustainable Rubik’s Cube – Setup (Liu 2020)
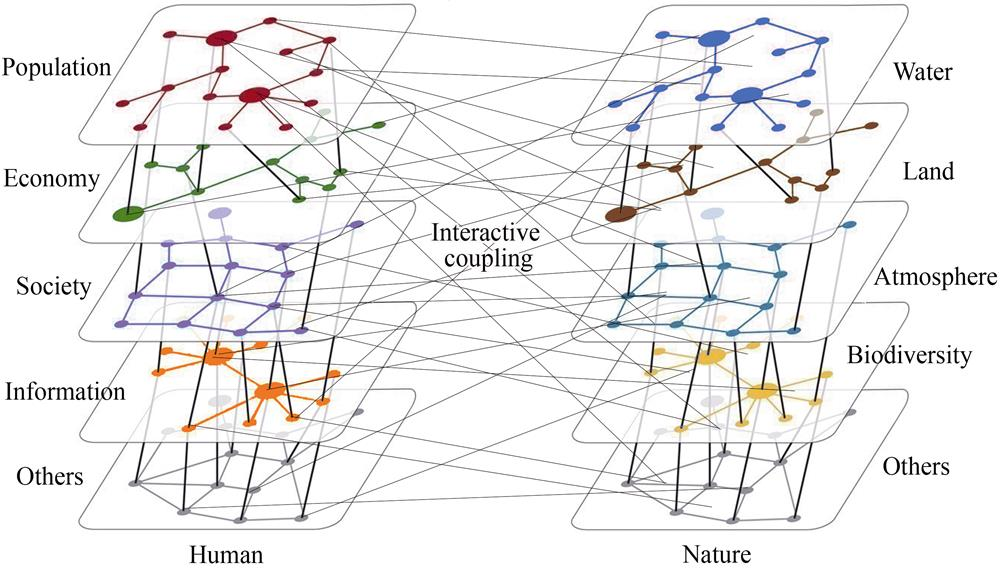
909. Sustainable Rubik’s Cube – Magic (Liu 2020)

910. Sustainable Rubik’s Cube – Payoff (Liu 2020)

911. Coupling and a yin yang marble run (Sorry, I didn’t follow how to get from the cube to here, something about syncoupling and lagcoupling) (Liu 2020)

912. SOLA (Pieper 2019)

913. From triple-bottom-line to multienvironmental scanning. (I don’t know what it means either) (Roth 2020)

914. Salmon circles (Connors 2023)

Another version has mismatched puzzle peices

915. Desirable and meaningful in multidimensional social-ecological space (Leach 2018)

916. Equitable Sustainability (Leach 2018)

917. Health (Alvarez 2018 via sSahely)

918. Restorative Roots (Tedesco 2023)
(yes OK, a stretch to call this one sustainability, but i couldn’t seriously leave it out).

919. . Restoration as a holistic, iterative, social-ecological process (Tedesco 2023)
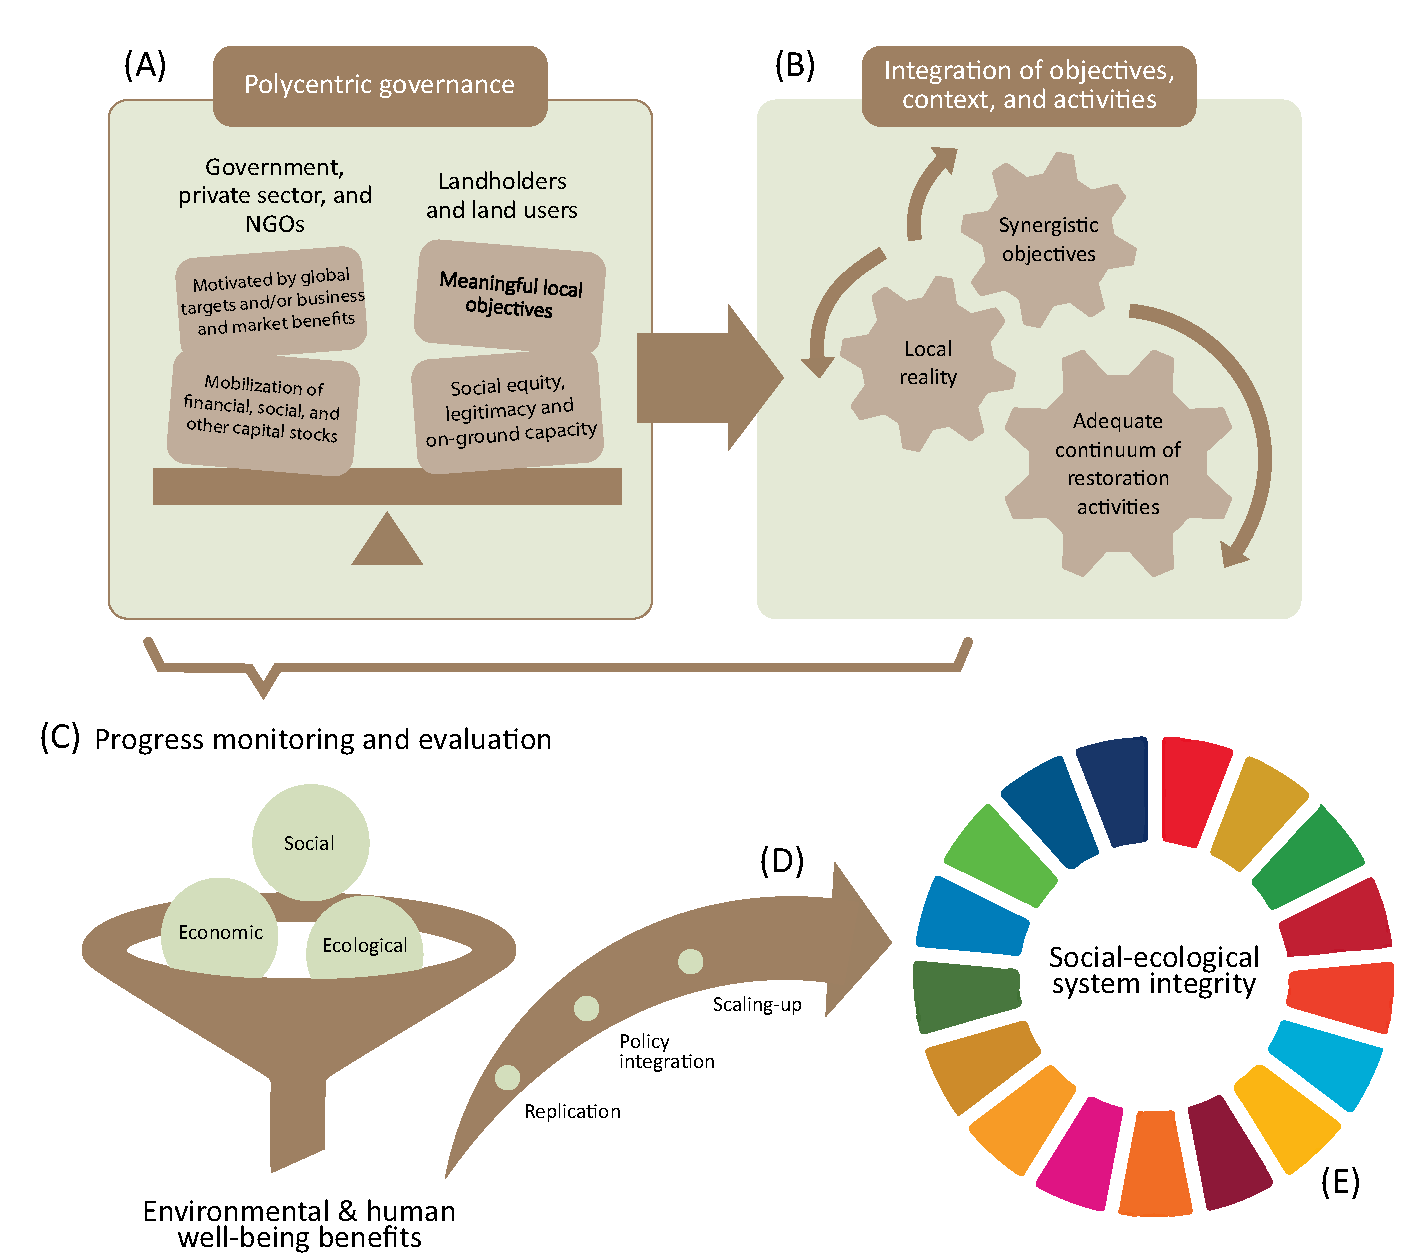
920. Noise without irritation (Integrating Sociological Risk Theory) (Peter 2020)

921. Grid-group typology (Peter 2020)

922. God, Perfect Human, Nature, Materialistic Human. Got it. (Taghvaee 2017)

923. Technology spiraling out of control (Bakshi 2017)
“methods must satisfy to guide technological development toward sustainability is still quite limited”

924. Dialectic (Fuchs 2017)
I argue for a third model (M3) that is a further development of M2. It besides the economy also foregrounds the political and the cultural system as parts of society and is based on a dialectic of nature/society and a dialectic of the economy/the non-economic (the political and the cultural). In model M3, society is made up of the economy, politics and culture and these 3 interacting realms of society are grounded in nature, with which society interacts.
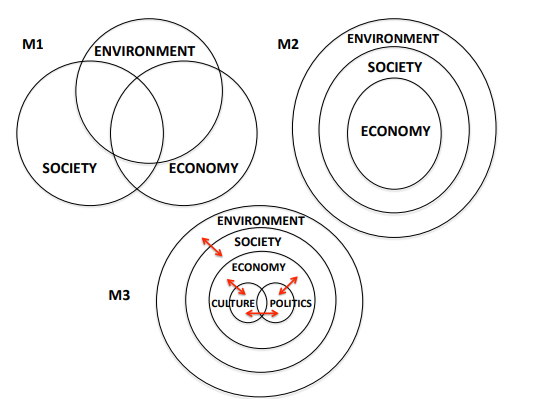
925. Dialectic of dynamically reproducing subsystems (Fuchs 2017)

926. Critical Sustainabilitiy Studies (Ferreria)

927. Sustainalism (Hariram 2023)


928. Harmony (Chen 2021)

929. Pillars, meet knowledge. Knowledge, Pillars. (Sabau 2010)

930. Unifying the opposites (The Eristic-Dialectical model of sustainable conflict resolution) (Ganoulis 2023)

931. Dialectical tensions (Rice 2022)

revised to promote communication

932. Nature based solutions (Palomo 2021)

933. Alluvial flow connecting cultural ecosystem services and well-being (Huynh 2022)
(flows represent frequency of these connections in literature)

934. Telecoupled (Liu 2013)
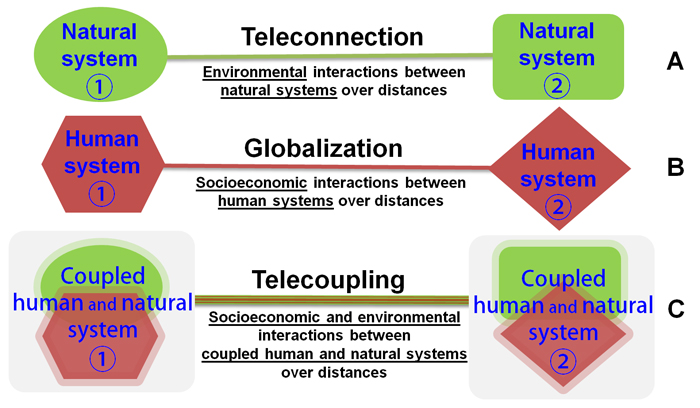
935. Gandhi’s “square of swaraj” into a sustainability cube (Saravanamuthu 2017)
Saravanamuthu translates Gandhi’s “square of swaraj” into her sustainability cube. Her cube explains how the swaraj methodology informs Risk Society’s journey toward sustainability amidst complexity, uncertainty, and diffused responsibility.

936. Tika Transitition (Bargh 2023)
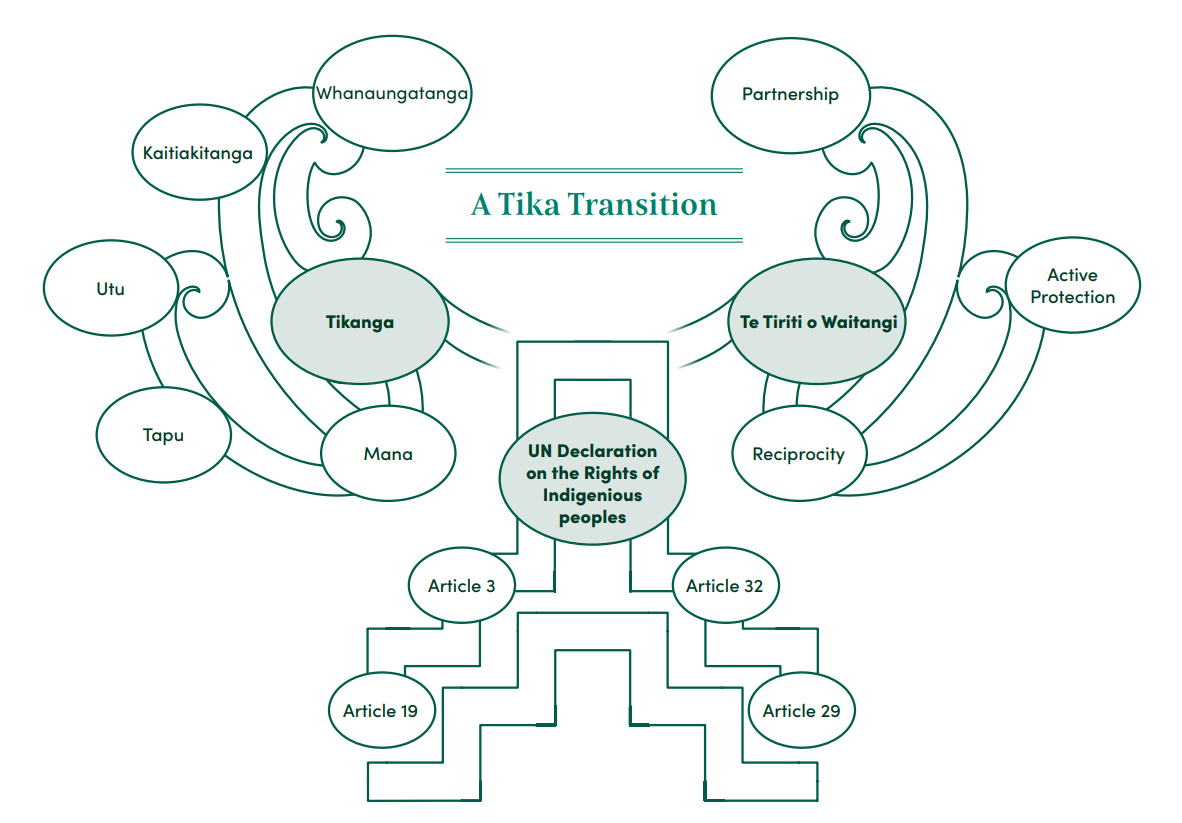
937. Landscape Sustainability (Musacchio 2011)
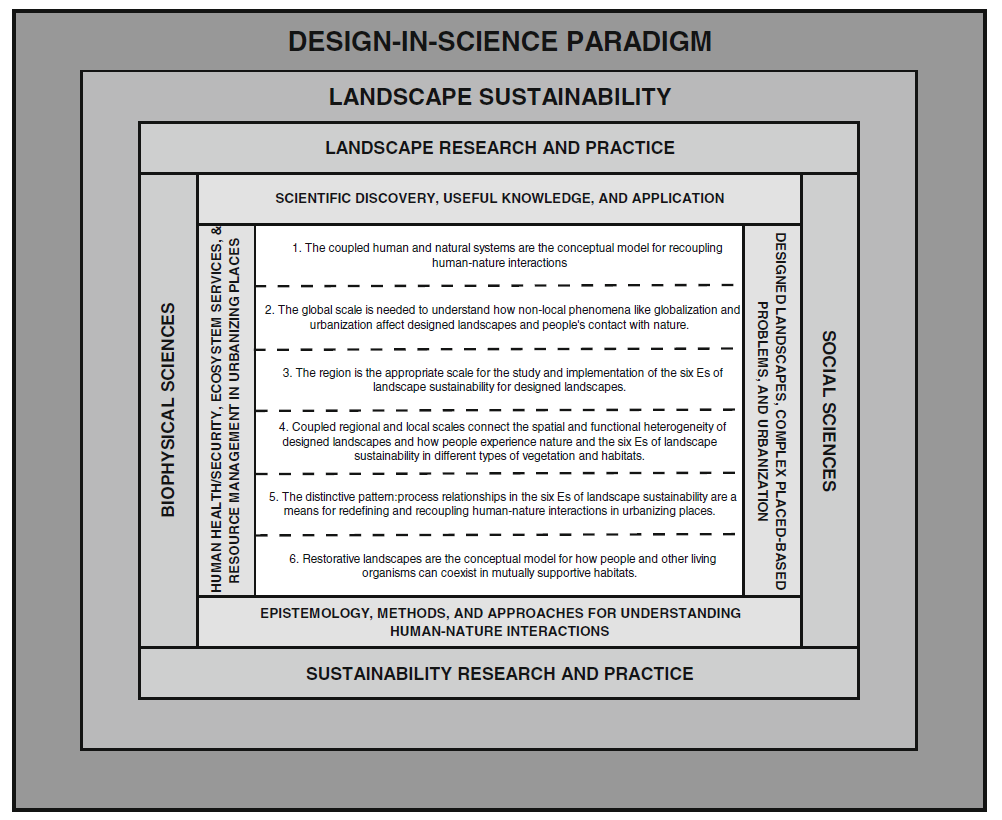
Six Es of landscape sustainability
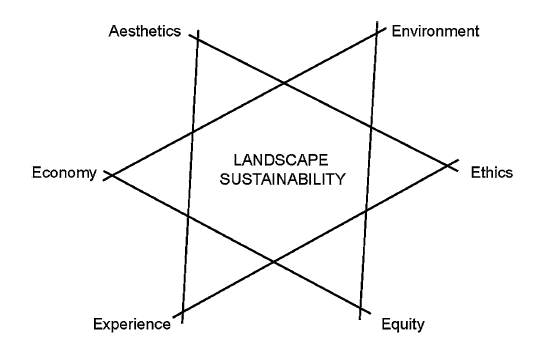
938. Role of urbanisation as key driver in un/sustainability (Wu 2014)

939. Sustainability in Communal Socio-Ecological Systems (McHale 2013)

940. Focal-scale system change and environmental justice claim-making (Xu 2021)

941. Phases of change (Hagen 2013)

942. Designed or tipped (Brunckhorst 2023)

943. Landscape Loopholes (Brunckhosrt 2005)
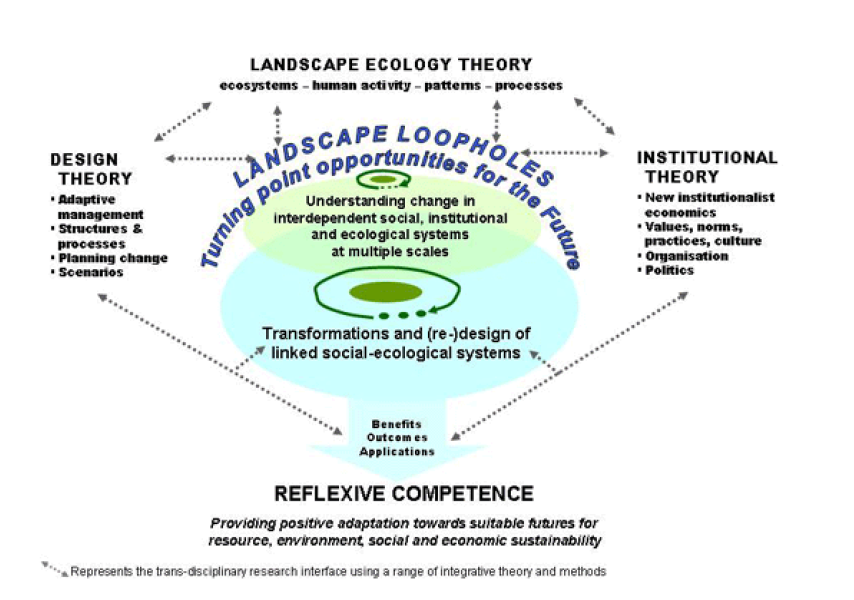
944. Daly’s (and Meadows’) triangle (Wu 2018)

945. Landscapes (Wu 2018)

946. Fair, Scaled, Efficient (Ulman 2022)

947. Knotted paradox of coopetition (Manzhynski 2023)

949. Literacies (Göpel 2016)

950. Materiality of old ideas (Göpel 2016)
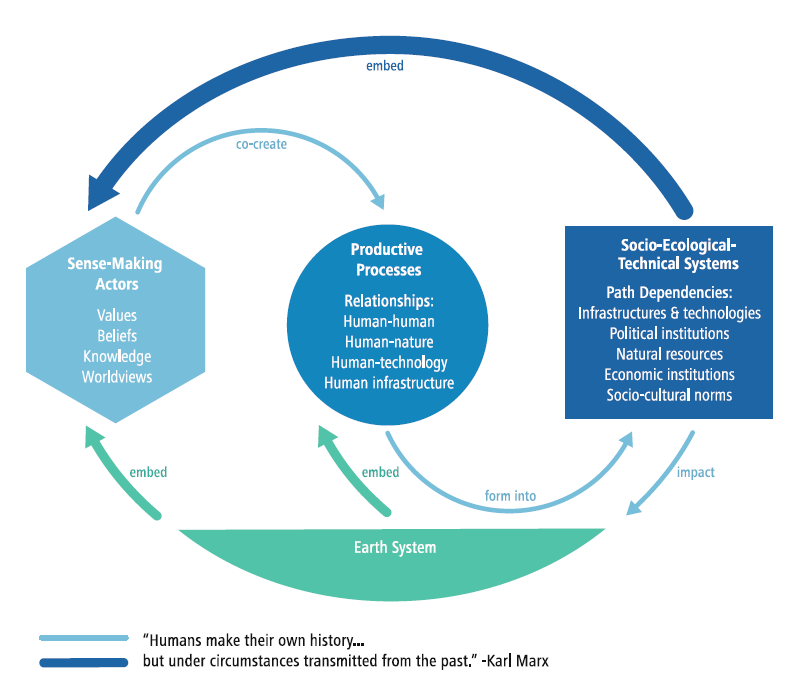
951. Why mainstream economics fails sustainability (Göpel 2016)

952. New paradigm of well-being and happiness (Bhutan NDP Steering Committee 2013 via Göpel 2016)

953. Typology of business change (Jablonski 2016)
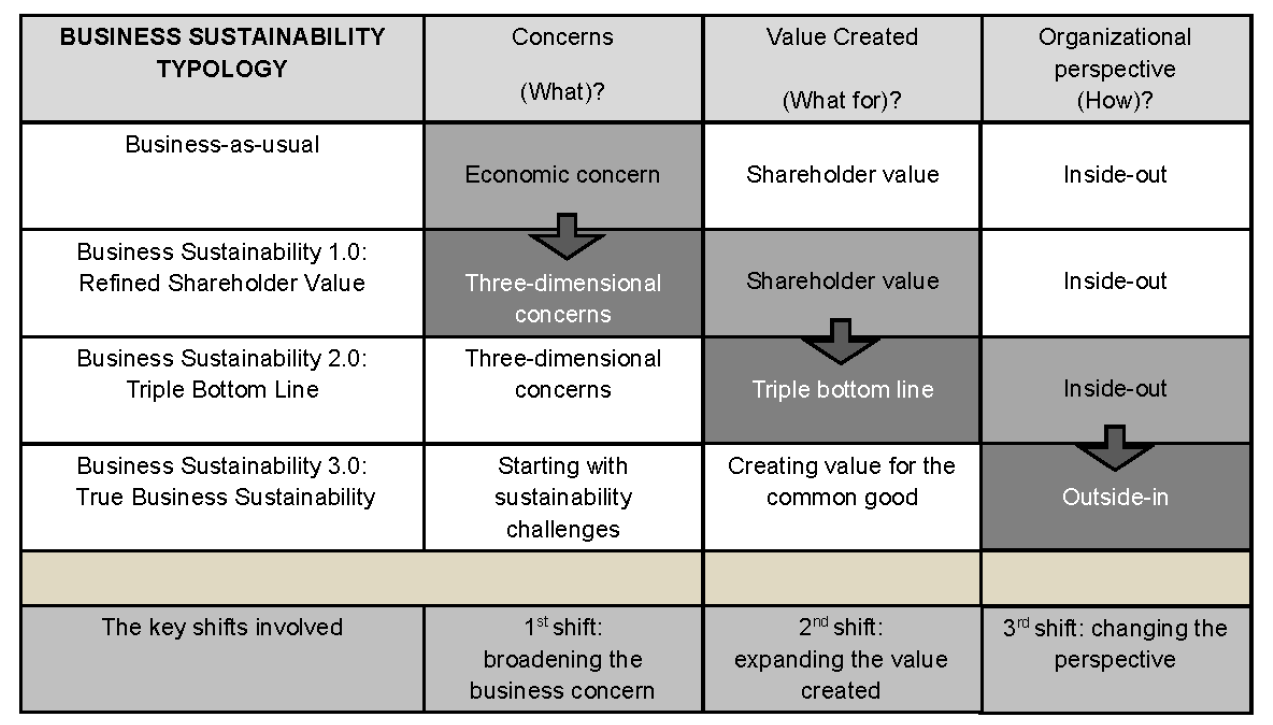
954. Quality multifunctional capitals (Mino 2016)

955. Practices across scales and dimensions (Bejtullahu & Morishita-Steffen 2021)


956. Snuitroinamenπl (Ariza-Colpas 2023)
(no explanation in text for strange spellings. Variables for sustainable cultural tourism through augmented reality).
957. Normative landscape is not a subset of space alone (Berr 2023)

958. Conceptual world apprehension (Berr 2023)
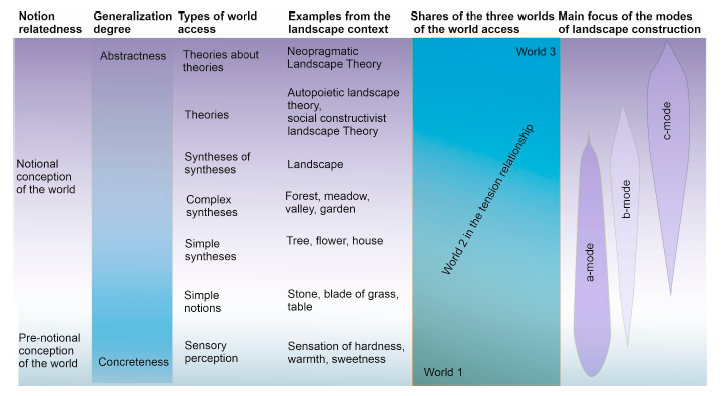
959. Pedagogy of entanglement (Wessels 2022)

960. Closed loops in autotrophic organism (vs heterotrophic organism). (Rizzetto and Hooimeijer 2022)

961. Beyond closed loops (Rizzetto and Hooimeijer 2022)

962. System aliveness principles (Kuenkel 2019, Kuenkel & Ragnarsdottir 2022)
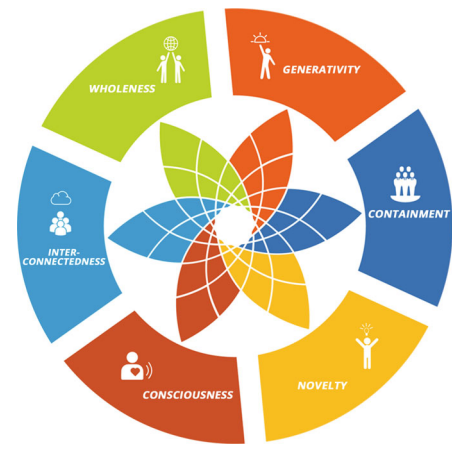


963. Sad planet, happy planet (Ragnarsdottir 2022)

964. Sustainability Gap (Nnoli-Edozien 2022)

965. All Change! (Wamsler 2021)

966. Leadership transformation for sustainability (Wamsler 2024)
They involve: 1) how we see the world, 2) how we get to know, 3) how we engage, and 4) how we ensure quality and equity considerations across all aspects. Together, they support flourishing across scales—by covering all key contributions of inner-outer transformation.

967. Ways we understand and ways we dwell (Rozzi 1999)
Reciprocal influences between evolutionary-ecological sciences and environmental ethics. (a) The ways in which humans understand the natural world (sciences) and dwell in it (environmental ethics) are intimately linked by reciprocal influences (broad gray arrows) that take place within two broader environments: the cultural world and the natural world. The short double arrows crossing the borders of each circle emphasize the openness of each domain to influences occurring among all domains. The arrowheads in each of the circles indicate the dynamic character of each domain. (b) This concept can be elaborated based on the case of Darwin’s evolutionary theory.

968. Science, technology, society, and a tape measure (Voulvoulis & Burgman 2019)

969. Intrinsic, Instrumental, Relational values (Chan 2016)

970. Human versus everybody and everything (including himself) (Wu 2023)
UAV = Unmanned Arial Vehicles

971. Sustainable diet dimensions (Parsons 2019)

972. 4Principles (Tavanti 2013)

973. Freedoms!! (Tavanti 2013)

974. Meetings and Claimings (Tavanti 2013)

975. -isms and -obias determining health. (Devakumar 2022).
I really like this representation, but it the focus is negative, would be fun to try turn it around.
(The Earth seems to have borrowed something from Saturn)

Cutaway version Deivanayagam 2023)

976. Living Standards, Contributions to People, and Living Standards again (Ausseil 2022)

977. Networks of resource ecologies (Narayan 2021)

977. Western life-world affected by social-ecological crisis (Artmann 2021)
(yes, another negative framing, but it sets up the next one)

978. Efficacious parterships (Artmann 2021)

979. Is it a diamond, is it a square? No, it’s a pentagon. (Tan 2023)

980. Actualised power in vanilla production (Neimark 2019)
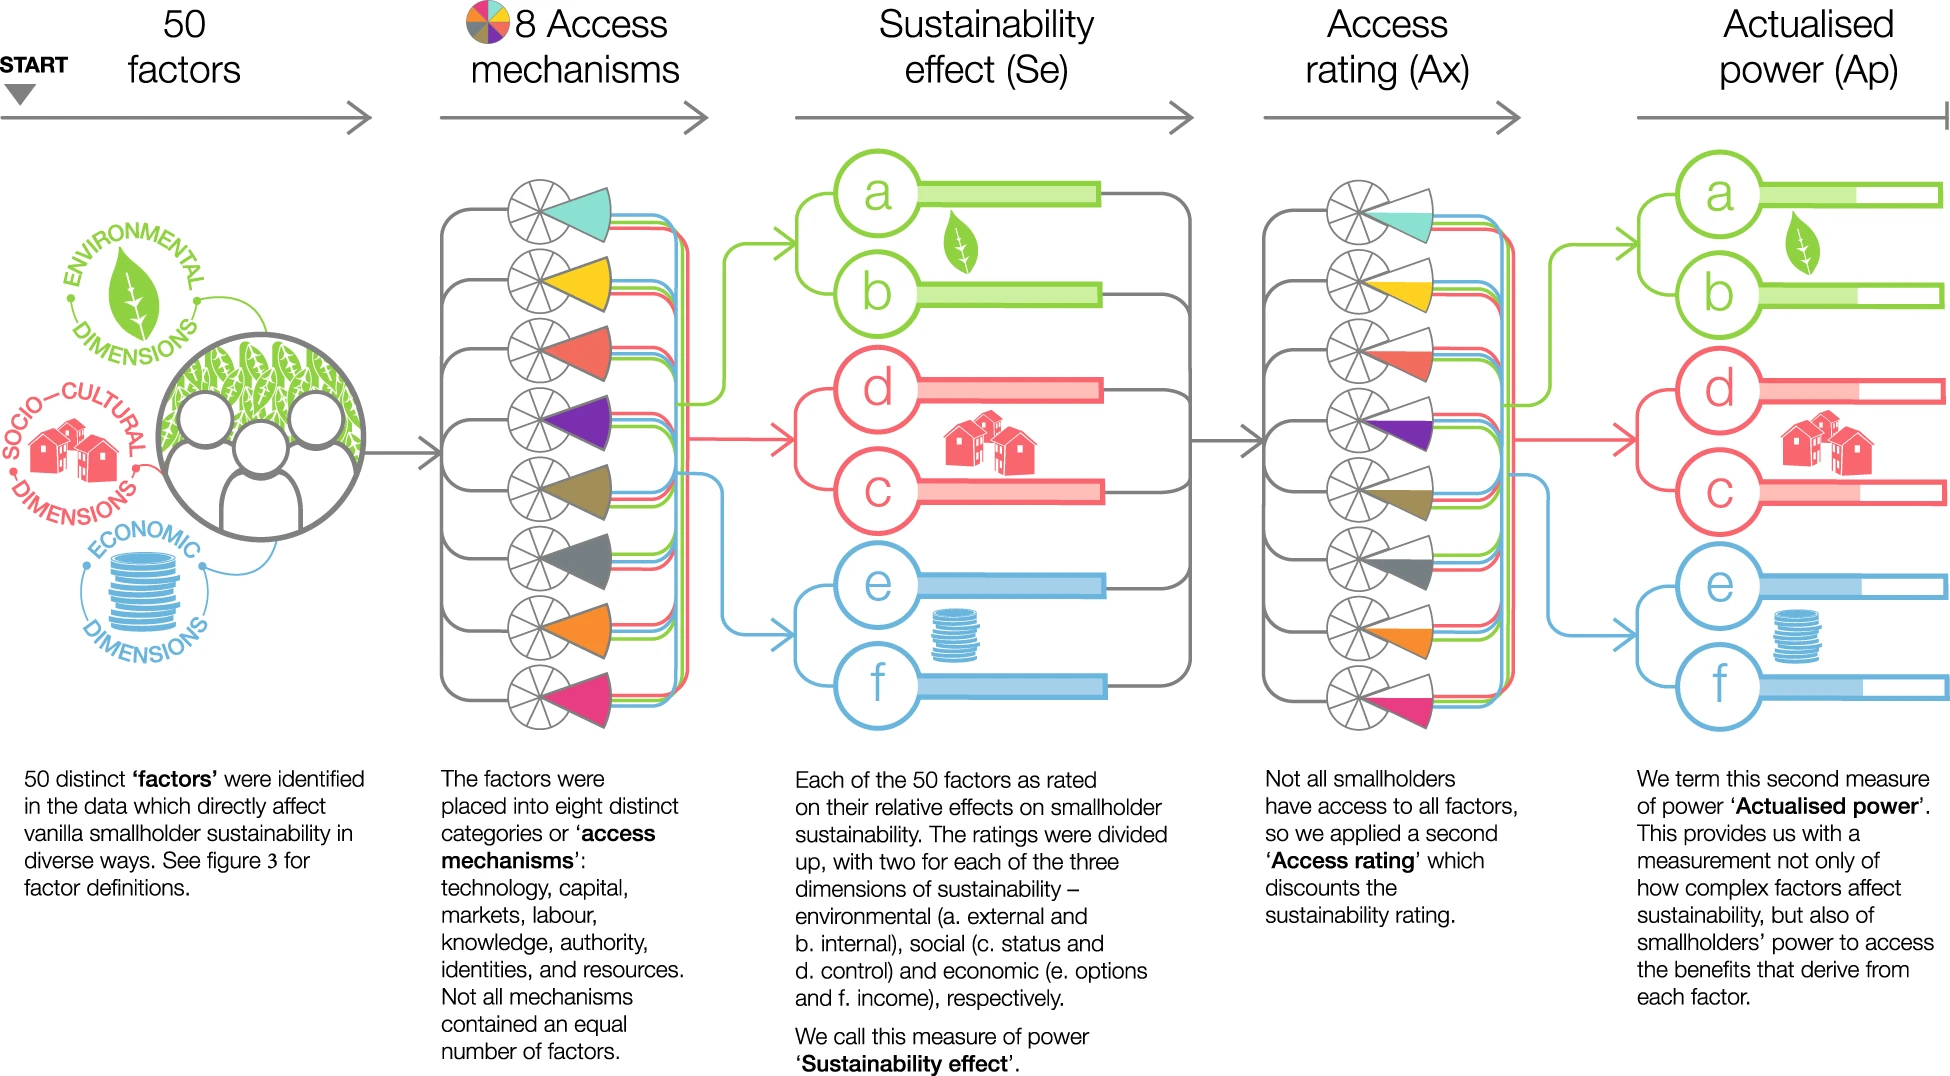
981. Bottom-up view of subsistence farmers (Viswanathan 2014)
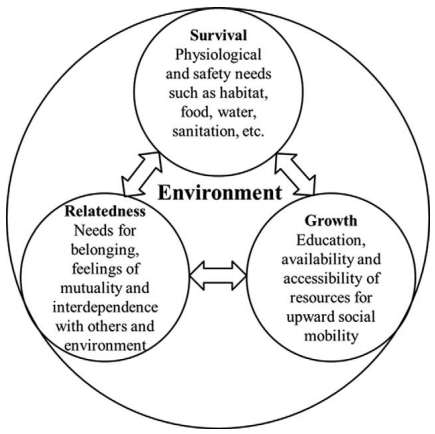
982. Relational (Helne 2015)
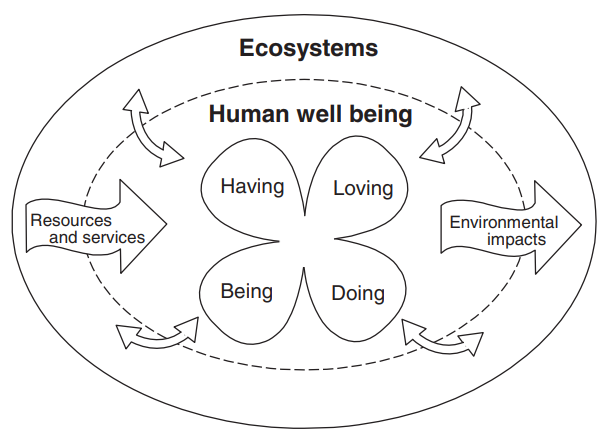
983. Relational leadership, ethic of care (Nicholson 2016)

984. Sustainability of AI Societies (Lucivero and Samuel)

985. Minimising Ecosystem Services Tradeoffs (Le 2023)
The analytical framework for minimizing ES trade-offs and maximizing positive ES synergies (E) from the relationships with the ES types (A), demand types (B), drivers (C) and approaches (D) for the win-win outcomes (F), and sustainability (G). (A) Adapted from MA (2005), Haines-Young and Potschin (2010), TEEB (2010); (B) classified by ES involvement, by human want and need, and by stakeholder (adapted from Wol et al., 2015; Chen et al., 2019, and Zheng et al., 2019, respectively); (C) adapted from Wol et al. (2015), Dade et al. (2019); (D) classified by governance type, by direct and indirect driver (adapted from Sattler et al., 2018; Zheng et al., 2019, respectively) and by other [e.g., Two-Eyed-Seeing (Buxton et al., 2021), Actor-Network theory (Ernstson, 2013), transdisciplinary research (TDR) (Quintas-Soriano et al., 2018; Auerswald et al., 2019; Aryal et al., 2022), etc.]; (E) adapted from TEEB (2010), Cohen-shacham et al. (2019); (F) adapted from Zheng et al. (2019); (G) adapted from Wu (2013).

986. 40 ways (Elrick 2019)
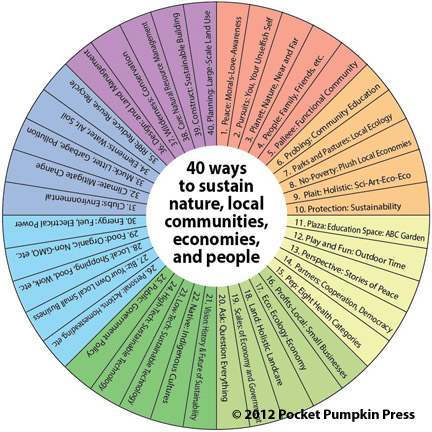
987. Healing for Stolen Generations (Muru Marri, Blignaught 2015)

988. Synergies and Challenges in Holistic Sustainability (Gasso 2023)
(I wonder if the problem might be related to starting with separate pillars as roots leading to a tree of three parts?)

989. Forgetting and Remembering the Once and Future World (Wyndam and Peters 2015 via HE Kucha website, not person).
A partial depiction of the leading role of the guild of biophysical remembrancers, intermittently supported by state-government institutions, issuing warnings of imminent ecological danger. In parallel, the ratcheted demographic-economic business-growth subsystem generates a more powerful array of information and propaganda barraging the individual consumer as a temporary (mortal) citizen of the planet earth. Information flows are indicated by the wavy lines and propaganda by the looping flow lines. The Ratchet is depicted to the left of the Growth gear. ‘Remembrancers’ (1455 CE, Oxford English Dictionary) are officials having the duty of bringing matters to the attention of the proper authorities; one who reminds. Here we broaden the concept to include rememberers, truth-sayers, and foreseers.
This Figure is the central panel of a conceptual model of shifting baselines of ecomyopia and social amnesia in the Anthropocene (Wyndham and Peters, ms 2015). This third instalment in the Ecomyopia Meets the Longue Durée Project continues the development of human ecosystems critical theory for New World industrial societies from an American anthropological perspective. The emphasis in this project is on the information ecology of human ecosystems.

990. Rappaport’s Cybernetic system of the Tsembaga Maring of New Guinea (1969, via HE Kucha website)
Rappaport’s functional model of a Tsembaga Maring ecosystem is the first known diagrammatic attempt at integrating supernatural beliefs and cycles of ritual practice with `local ecosystemic processes.’ His depiction is of a cybernetic system in which beliefs and ritual practices regulate the relative abundance of pigs, social harmony and ultimately, human population. Rappaport separates system components into horizontal panels. Each panel portrays a domain that is a critical part of larger interrelations between the spirit world, the practiced ritual cycle, extra-community relations and biological constraints and affordances. In the top panel, `The Spirit World,’ Smoke Woman mediates between the living, the dead, and other influential spirits in the system, effectively guiding the Maring (through their shamans) in a proscribed but delicate cycle of segregation and integration. Red Spirits (strong, dry, hot) exist in dialectical opposition to the Spirits of Rot (fertile, moist, deathly). Both harbor members who were once living Maring and are involved in Maring affairs at various levels. The management of these complex spirit relationships is accomplished through the processes delineated in the middle two panels which in turn are intrinsically related to the bottom panel of local subsistence processes. In `The Ritual Cycle’ panel, a simplified outline of the Maring ritual cycle is given, showing the (supernatural) obligations incurred in daily living (triggers, `T’) and the rituals (`R’) that satisfy them (taboo, pig sacrifice, planting of rumbim, etc.). The cycle starts over with the rituals that signify the end of a year-long festival, after which taboos are lifted and maximum integration is achieved both in the Spirit World and in the local social system. The next panel, `Inter-Group Relations,’ depicts social events such as inter-group homicide and warfare, truces and festivals. Throughout the ritual cycle, pigs are killed. This effectively regulates the local pig population (bottom panel, `Local Subsistence’), which reduces garden invasions and labor obligations (primarily for women). This model can be seen as a benchmark in the move towards synthesis of the major components of human ecosystems. It integrates cybernetic systems principles with the humanistic and informational depictions of socio-cultural-spiritual systems.

991. Sustainable Inclusive Development in Africa (Emyimba 2019)
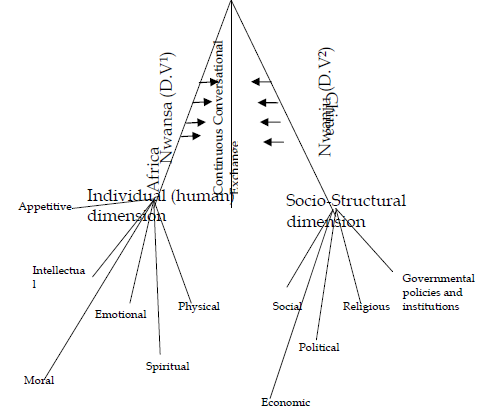
992. Modelling Nature Futures (Kim 2023)
(O ra well-set spinnaker despite the tangled sheets).
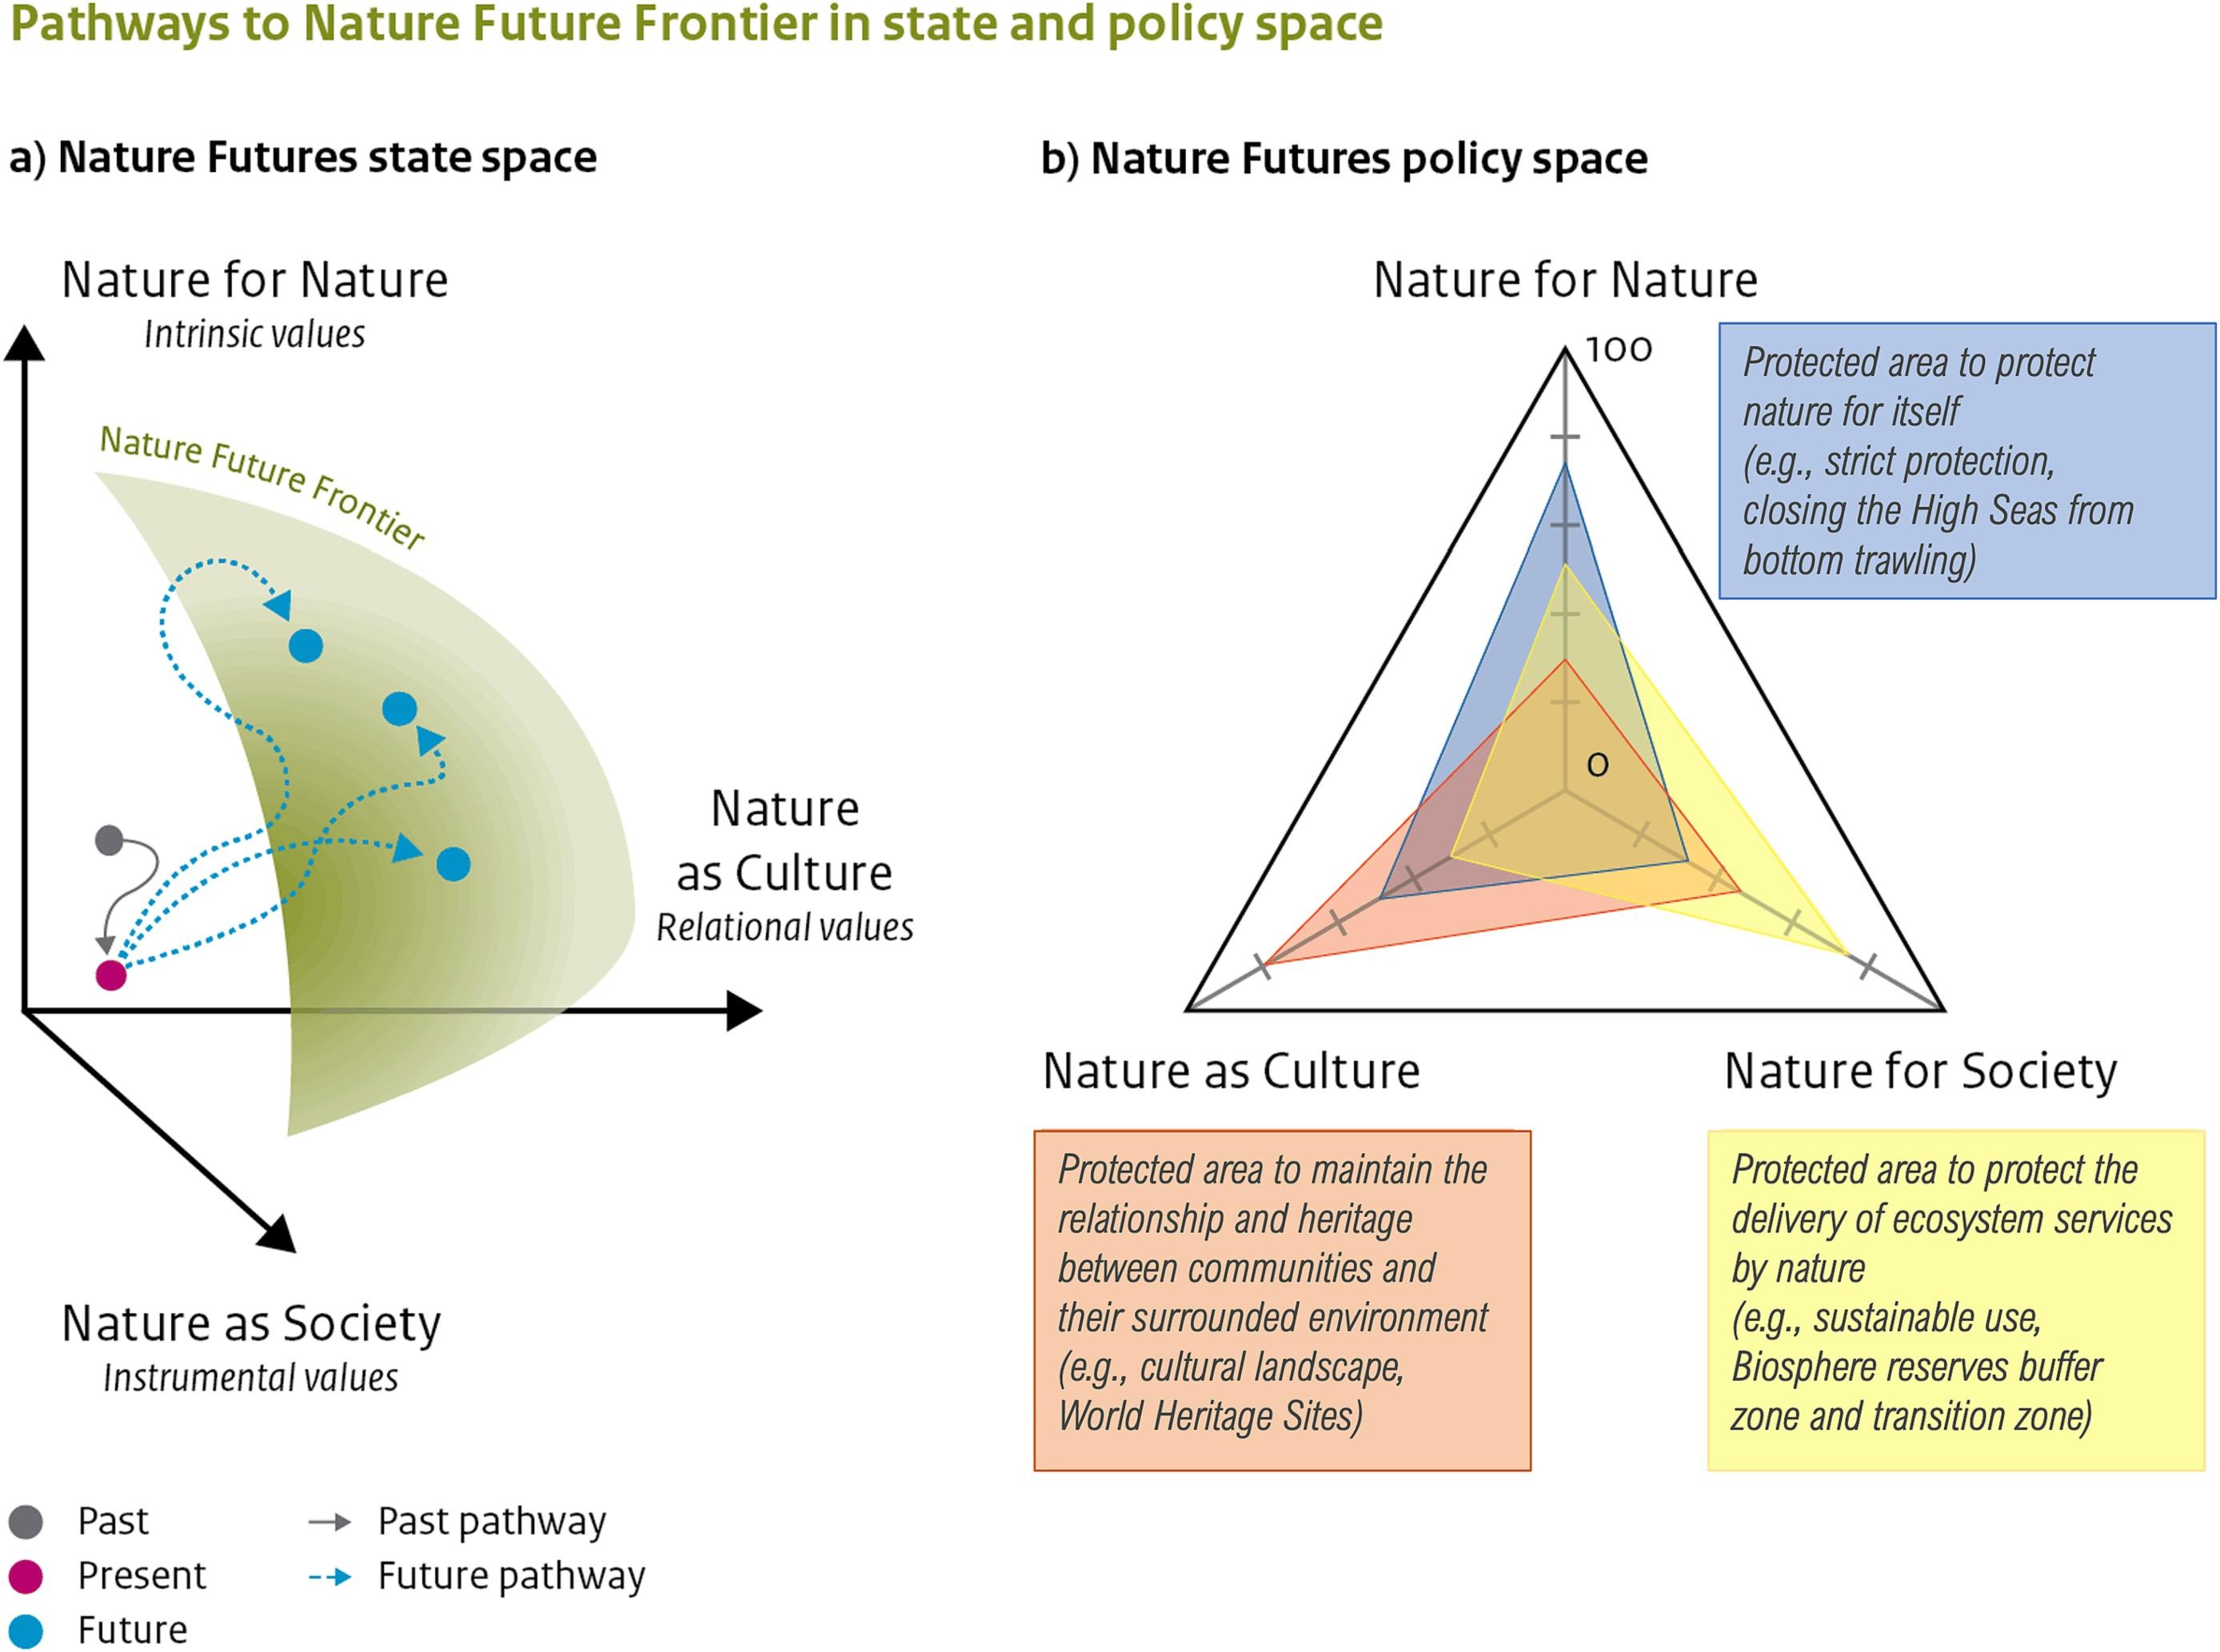
993. Modelling Nature Futures (Kim 2023)

994. Nature Futures Framework (Kim 2023)

995. Technology and ideology (Kozinets 2008, colour version)
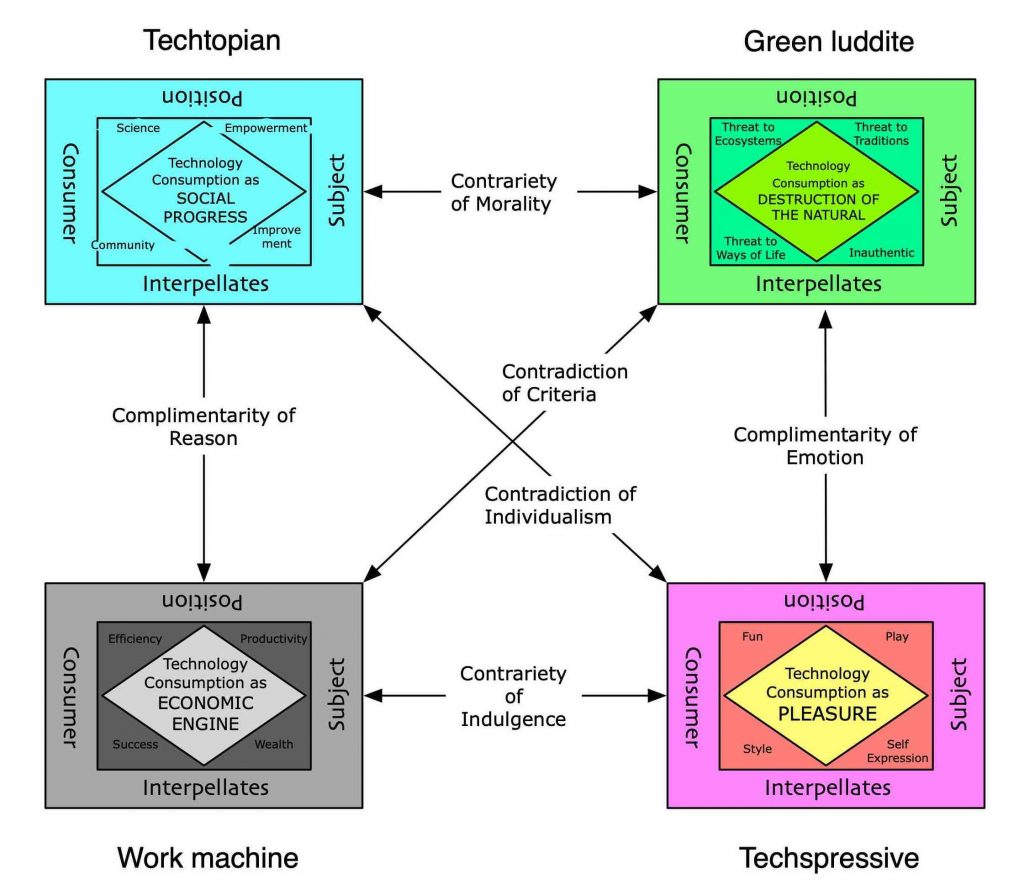
996. Coupled systems (Pörtner 2023)
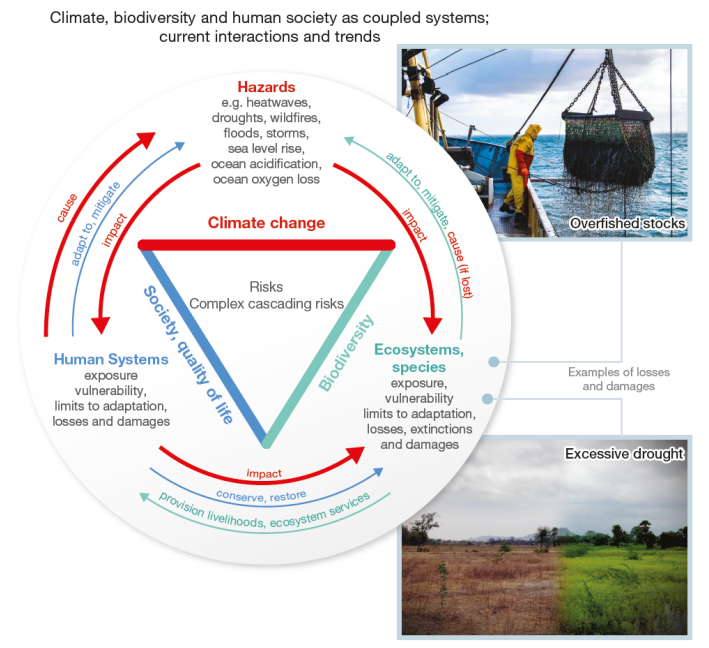
997. Sketchnoted SFG action (Marsha Dunn via UN 2023)

998. Pillars, SDGs and Peace (Haghighi 2024)

998. Institutionalisation of Positive Peace (Haghighi 2024)

1000. Boom. Nature Futures Framework (IPBES Decision 9/1 2022)
The nature futures framework presents three value perspectives of nature in a triangle. In the “nature for nature” perspective, people view nature as having intrinsic value, and value is placed on the diversity of species, habitats, ecosystems and processes that form the natural world, and on nature’s ability to function autonomously. The “nature as culture”/“one with nature” perspective primarily highlights relational values of nature, where societies, cultures, traditions and faiths are intertwined with nature in shaping diverse biocultural landscapes. The “nature for society” perspective highlights the utilitarian benefits and instrumental values that nature provides to people and societies. The coloured circles associated with each value perspective blend together where they intersect, indicating that they are not mutually exclusive. The specific value perspectives that define the corners of the triangular representation of nature futures emerged through numerous stakeholder consultations with a focus on providing a framework for scenario development. According to other knowledge systems and world-views, as portrayed in the right-hand part of the figure, human-nature relationships may be perceived in different ways. The examples in the right-hand part of the figure are taken from the IPBES conceptual framework but are not an exhaustive list of knowledge systems and world-views. The bands and dots indicate that the right-hand part of the figure and the left-hand part of the figure are intimately related, but in complex ways that cannot be described in a one-to-one relationship.

For several years now, my approach to my summer reading has centred around looking for diagrams of sustainability. The collection, now of 1100 diagrams is here. This year the search got harder, not because the images are harder to find, but the opposite, the field is exploding, and it is becoming quite challenging to find genuiely novel approaches. I continute to exclude diagrams of sustainable mechanisms (solar panels etc) but include the burgeoning work on transisitions and transformations where the model tells us something about the nature of sustainability itself.
There is also a trend to name the ideas something other than sustainability, and often described in contrast to sustainability, despite it bein, to my mind at least, clearly sustainability. So I have included diagrams of regenerative approaches as counting as sustainability – if if they contrast themselves against an absurdly narrow “nothing changes” definition of sustainability.
I’m only about 2/3rds of my way though the notes I took over the holidays, but I’ve reached a milestone, so here they are.
1001. Green new deal (War on Want, 2025)
A new set of pillars?
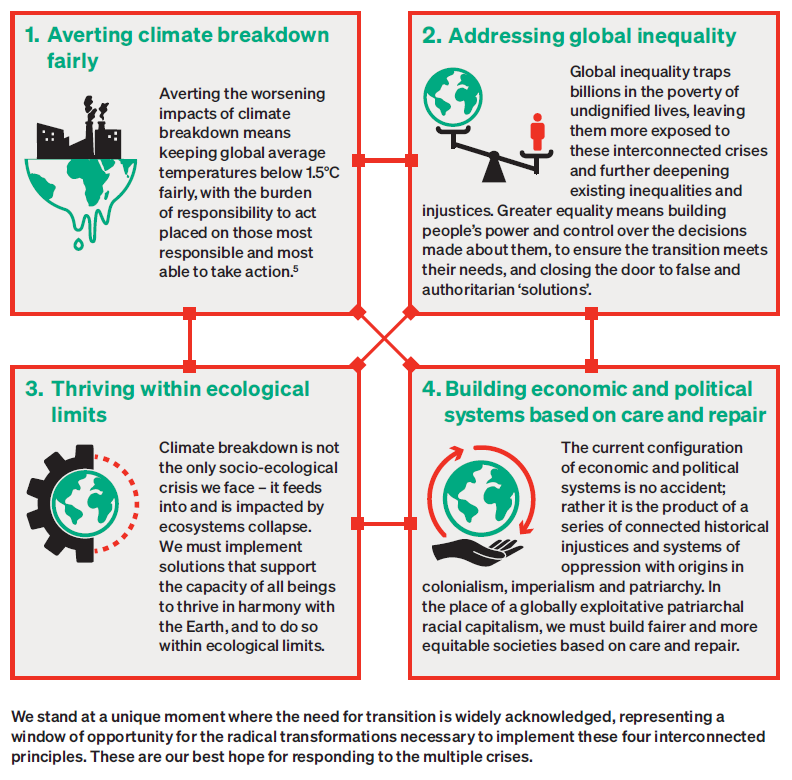
1002. Mina Prosperity (Relief Centre 2020)
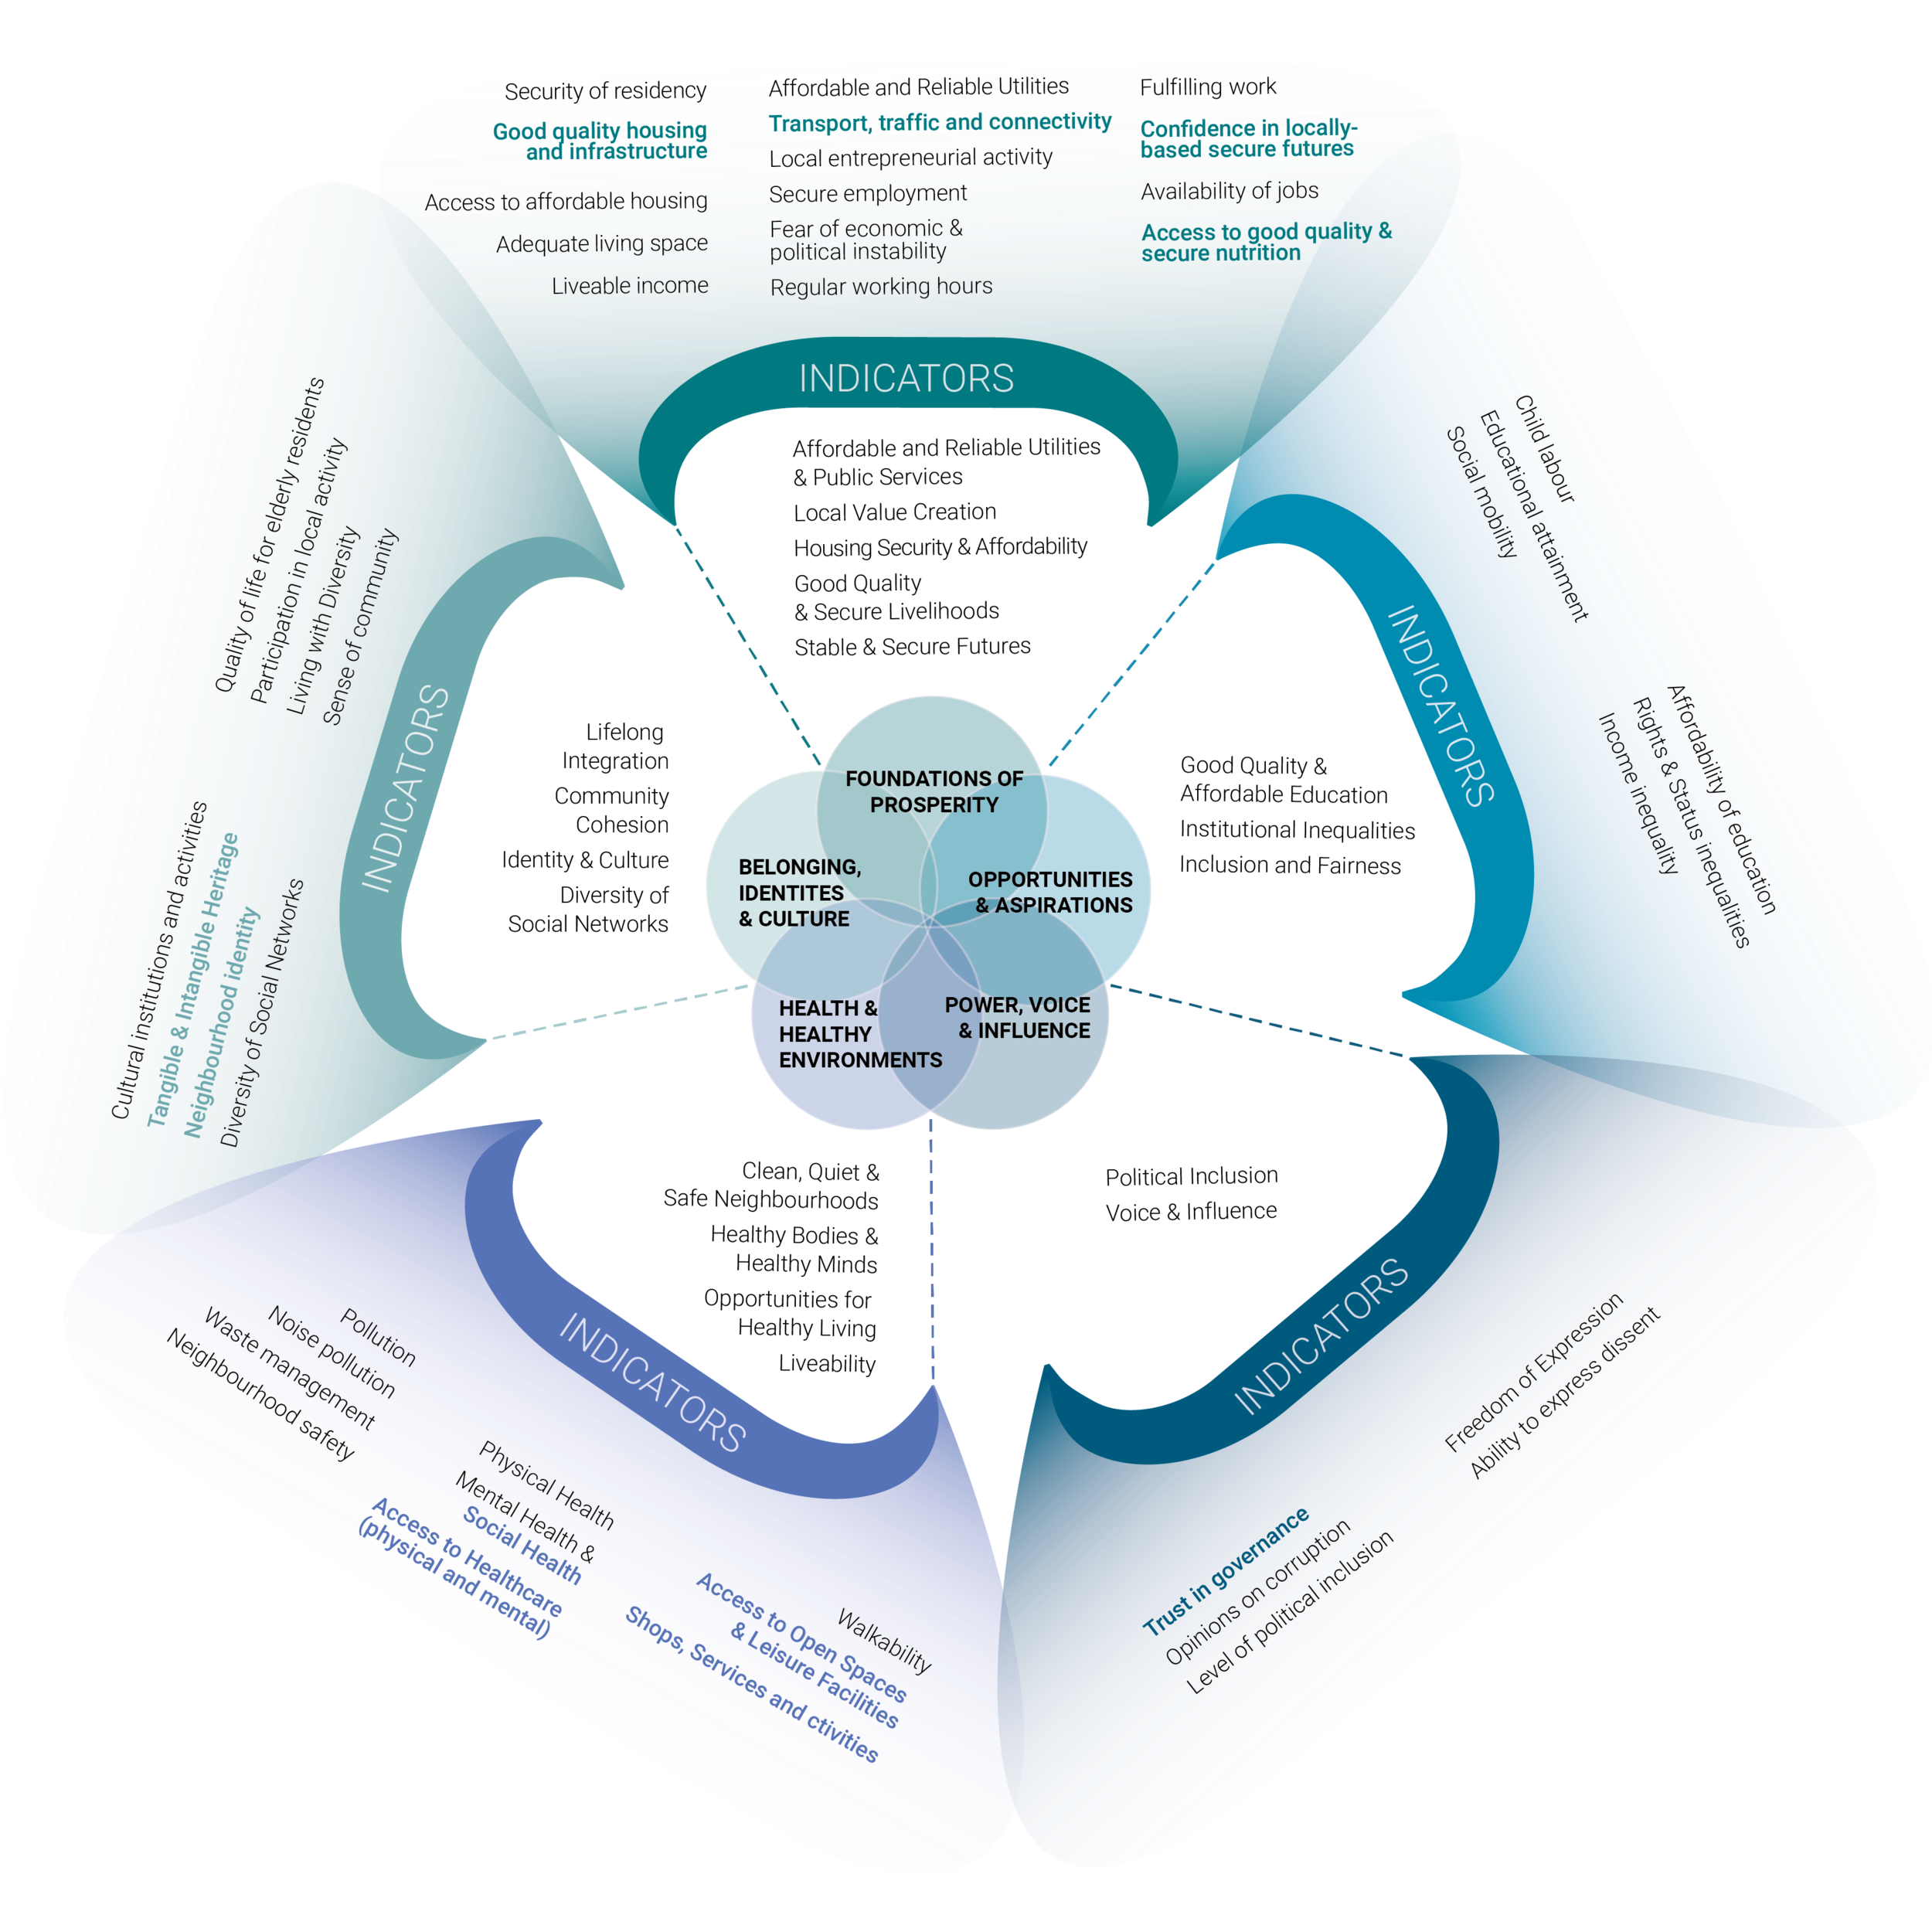
1002. Surface in a bigger space (Open Risk Management 2021)
The vertical axis captures environmental strain (defined holistically).
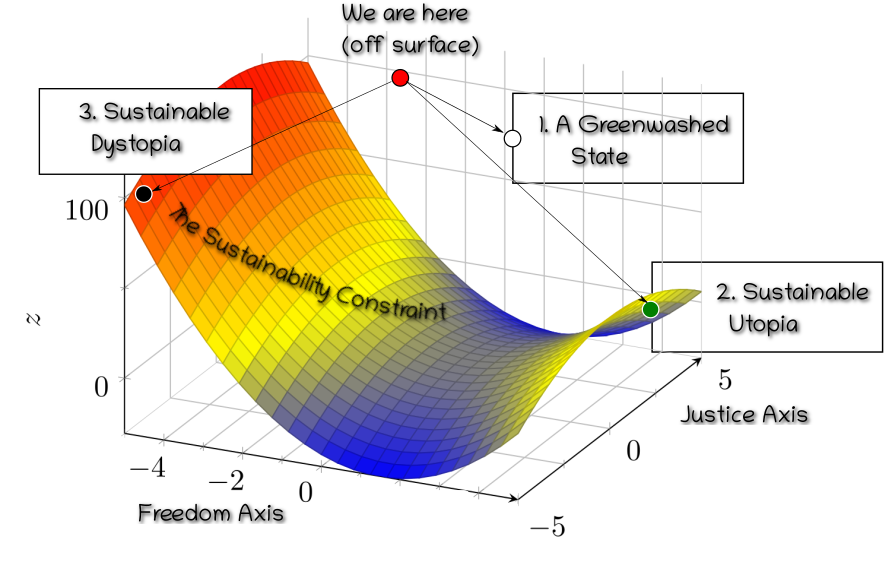
1003. Flourishing economies with inverted Maslow (Open Risk Management 2021)
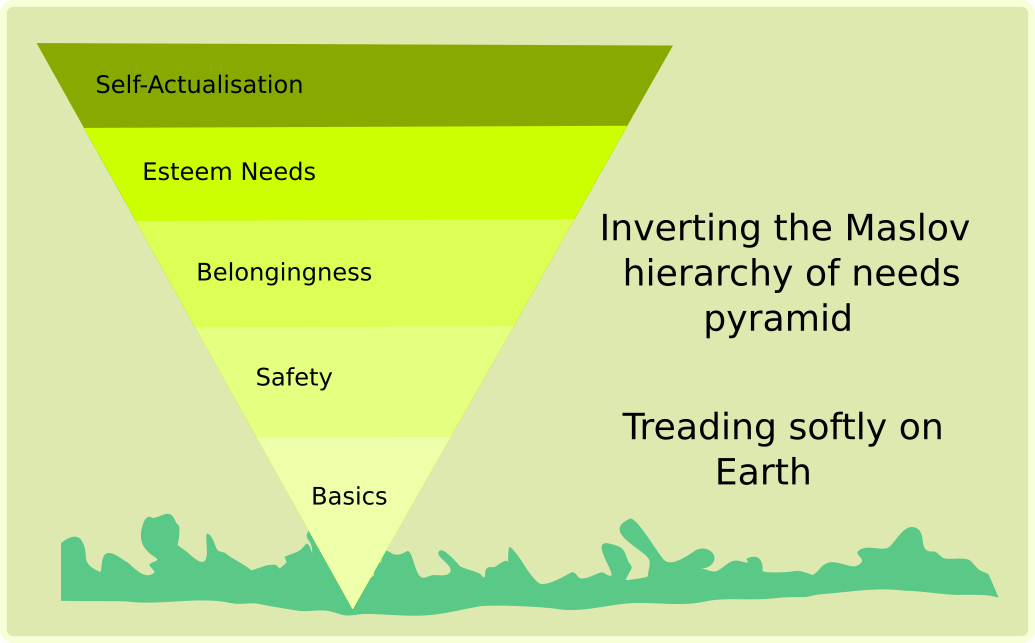
1004. Accountability (Zyznarska-Dworczak 2020)
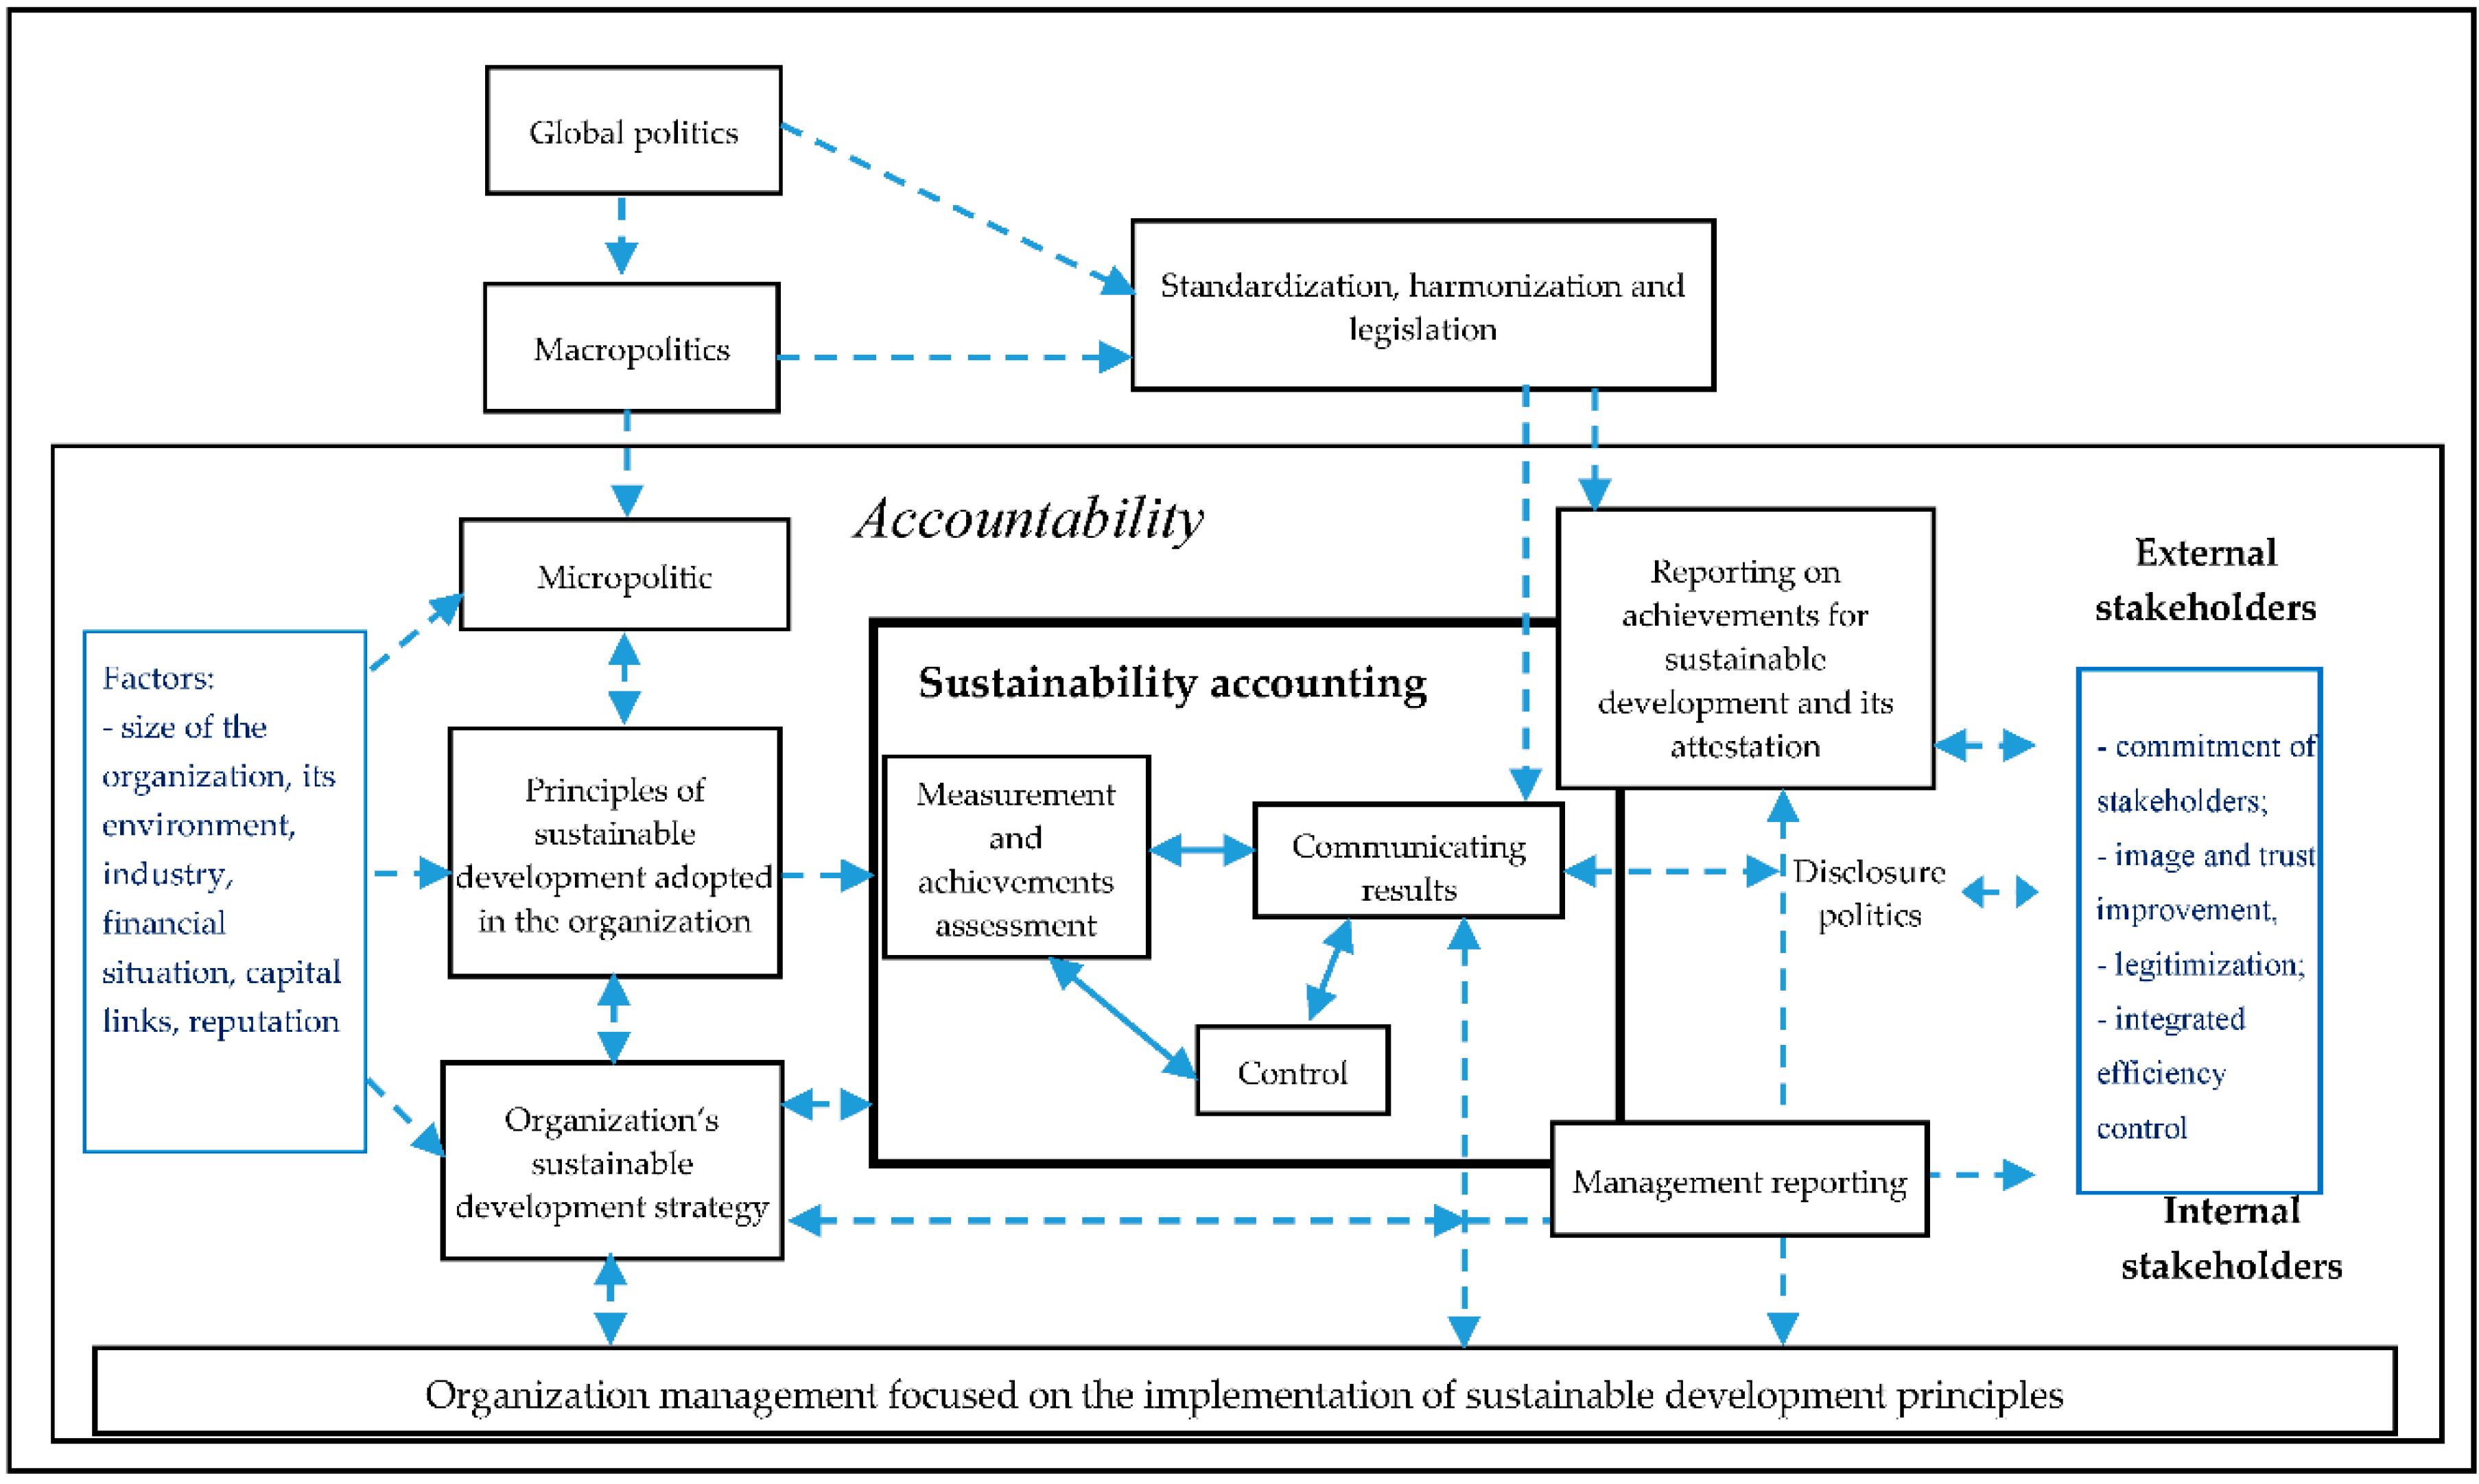
1005. H/V I-C sustainable consumption model (Rahman 2021)
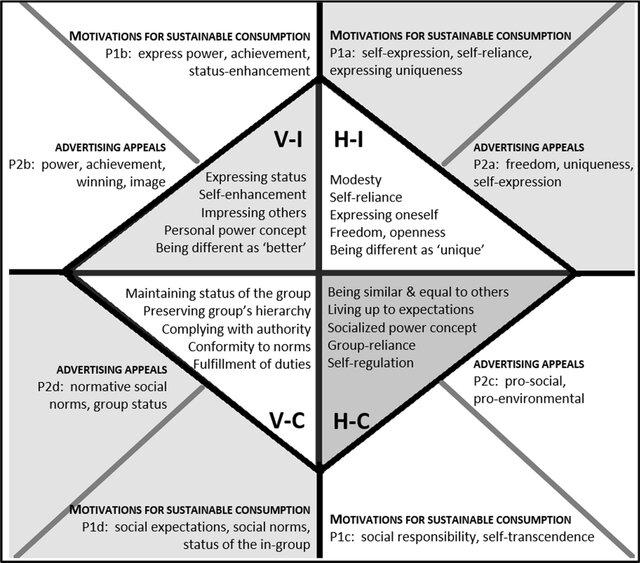
1006. Sustainable performances imply that interactions between socio-ecological components satisfy specific standards (Scammacca 2022)
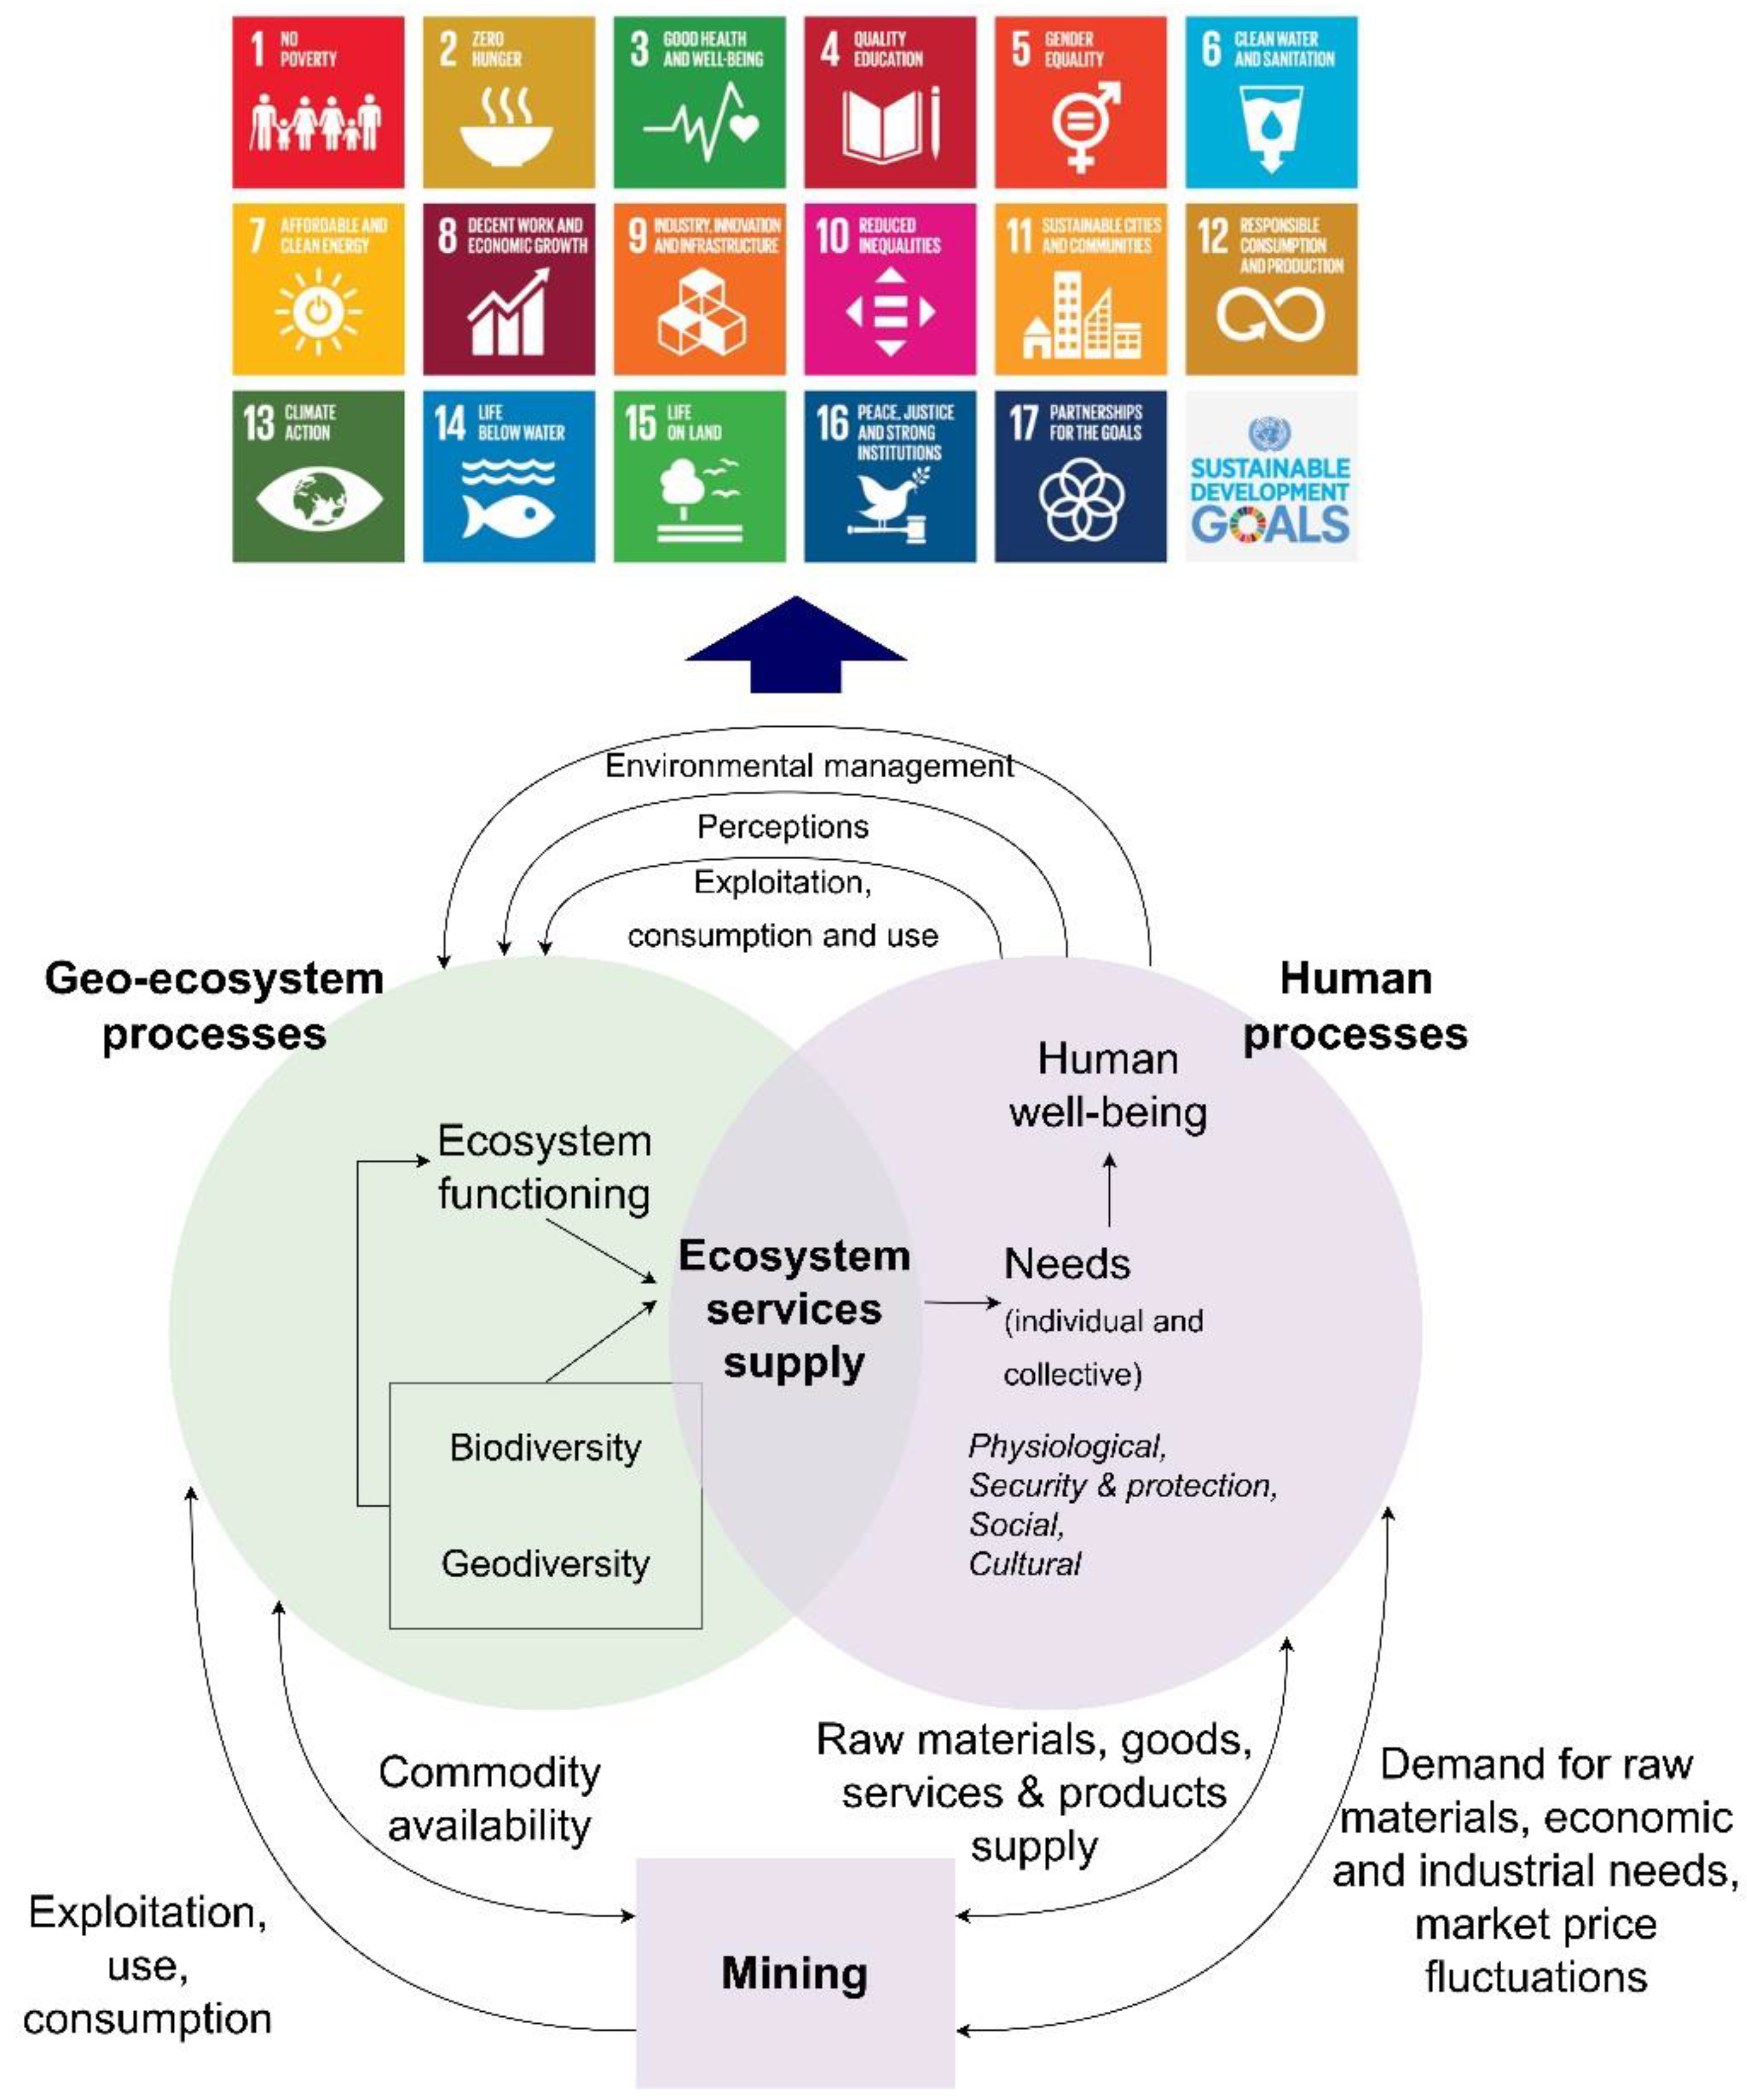
1007. Weighted pathways (Moallemi et al. 2022)
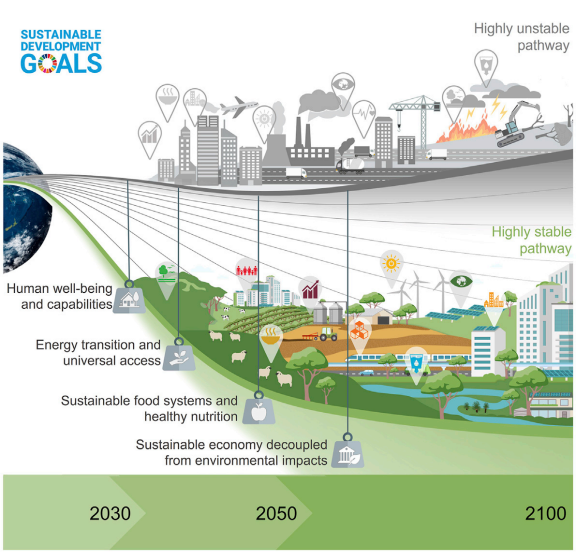
1008. Felix model (Moallemi et al. 2022)
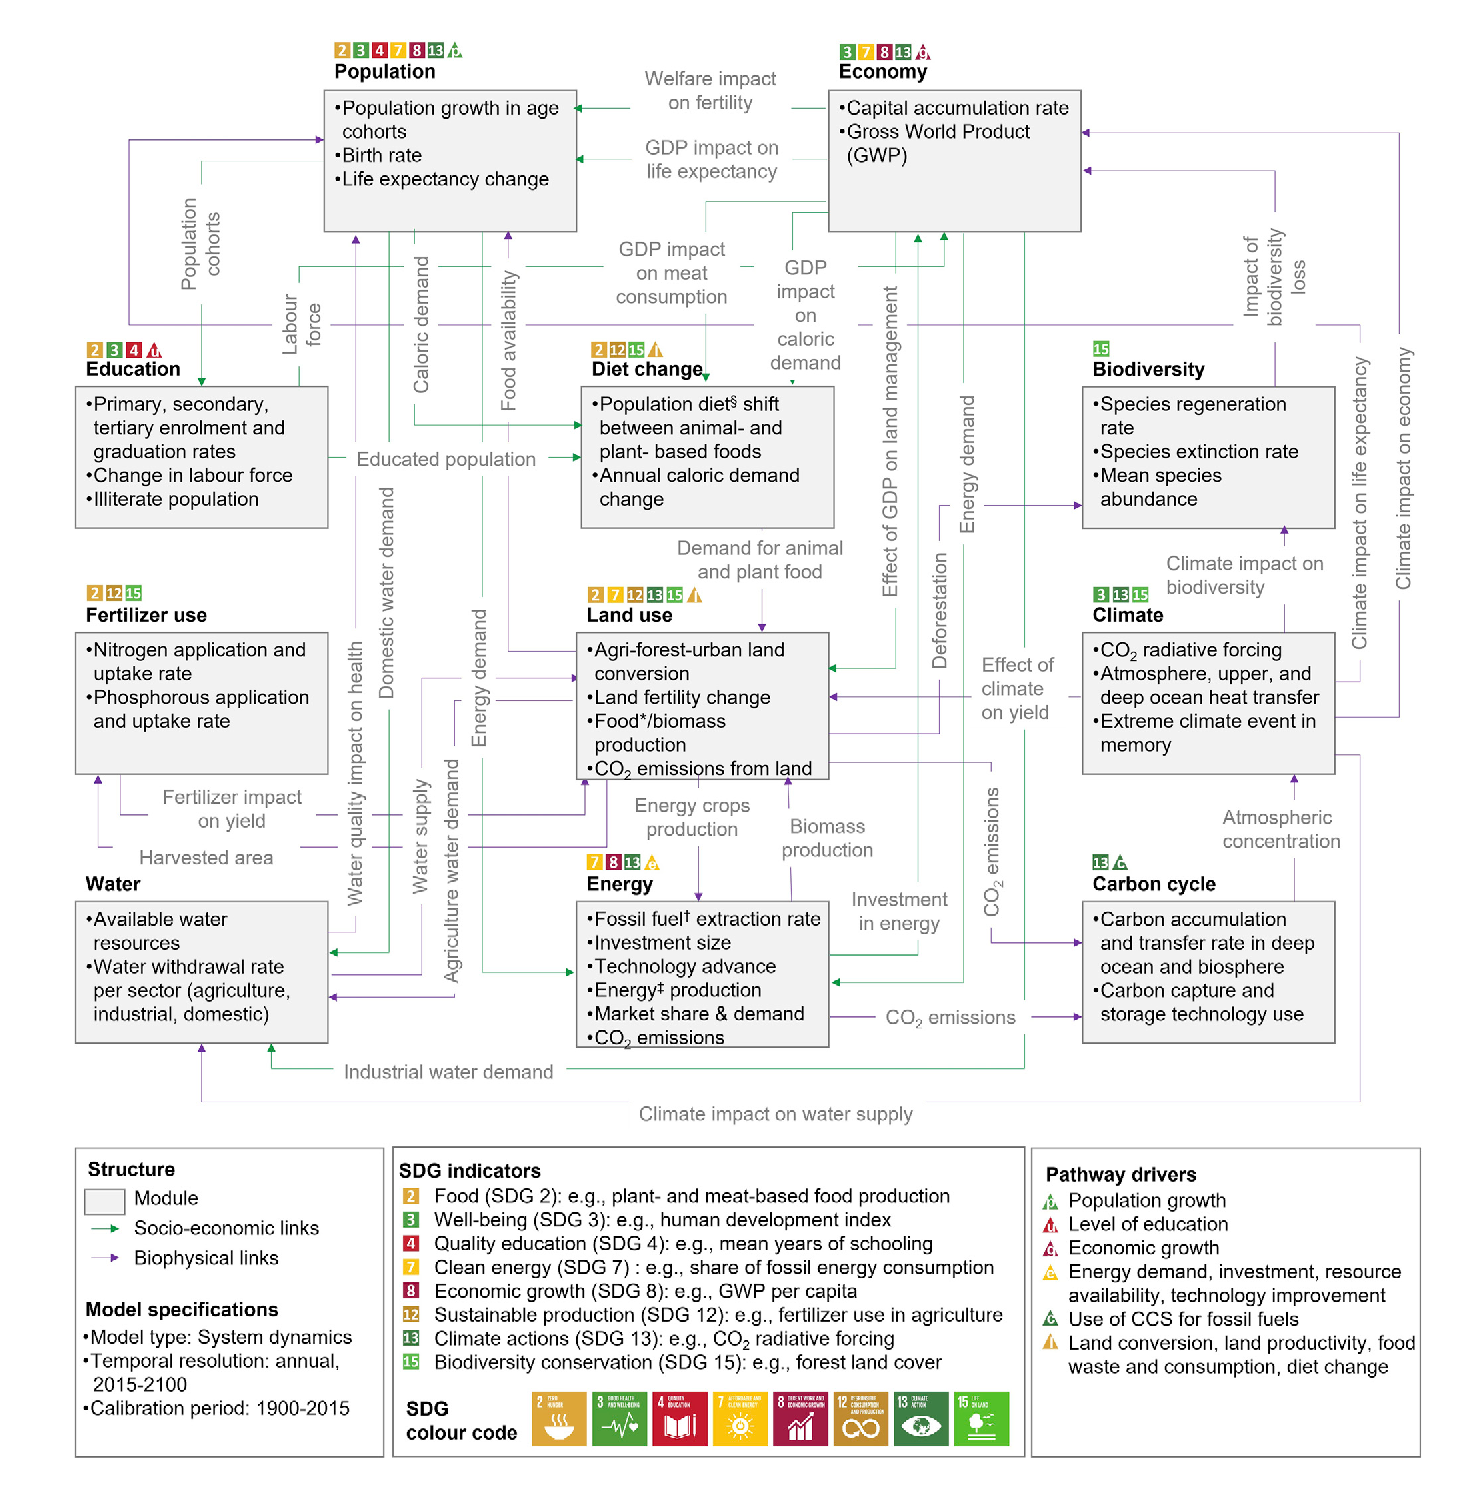
1009. Transformation via complementary systems change (Moallemi et al. 2022)
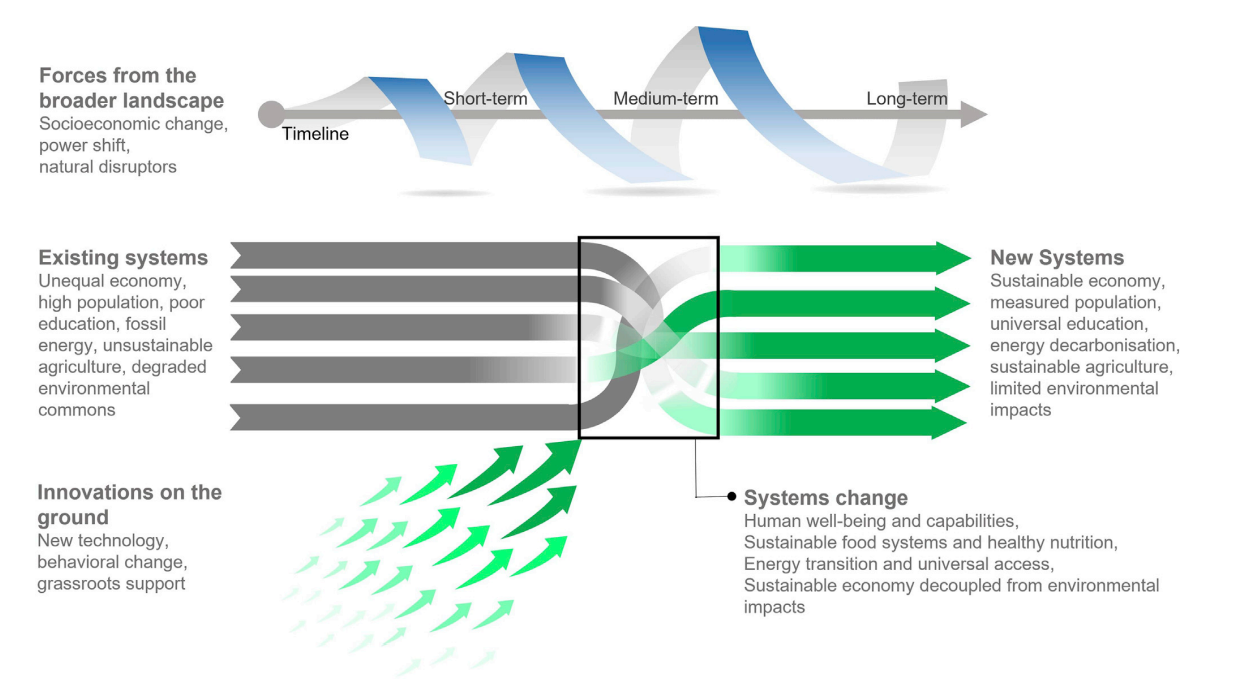
1010. Liquid modernity (Bowman & Yaxley 2021)
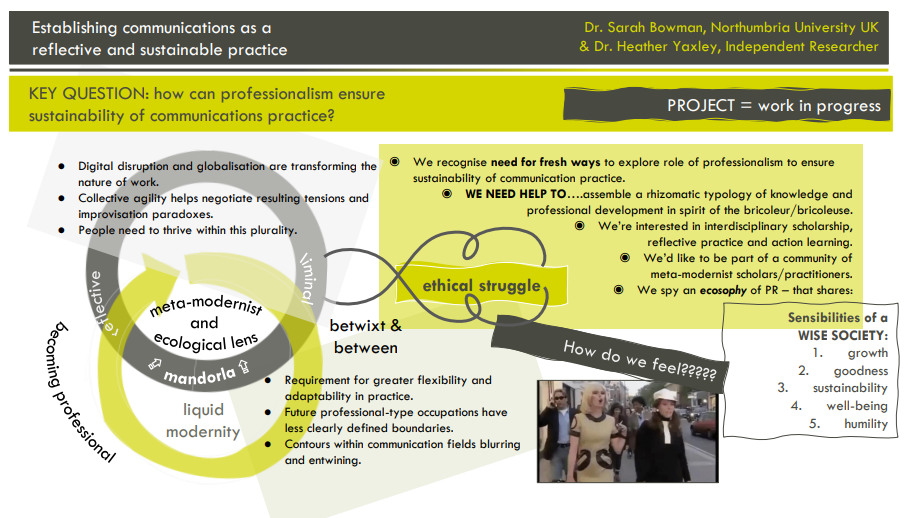
1011. Ethical business initiatives (Ethical Design)
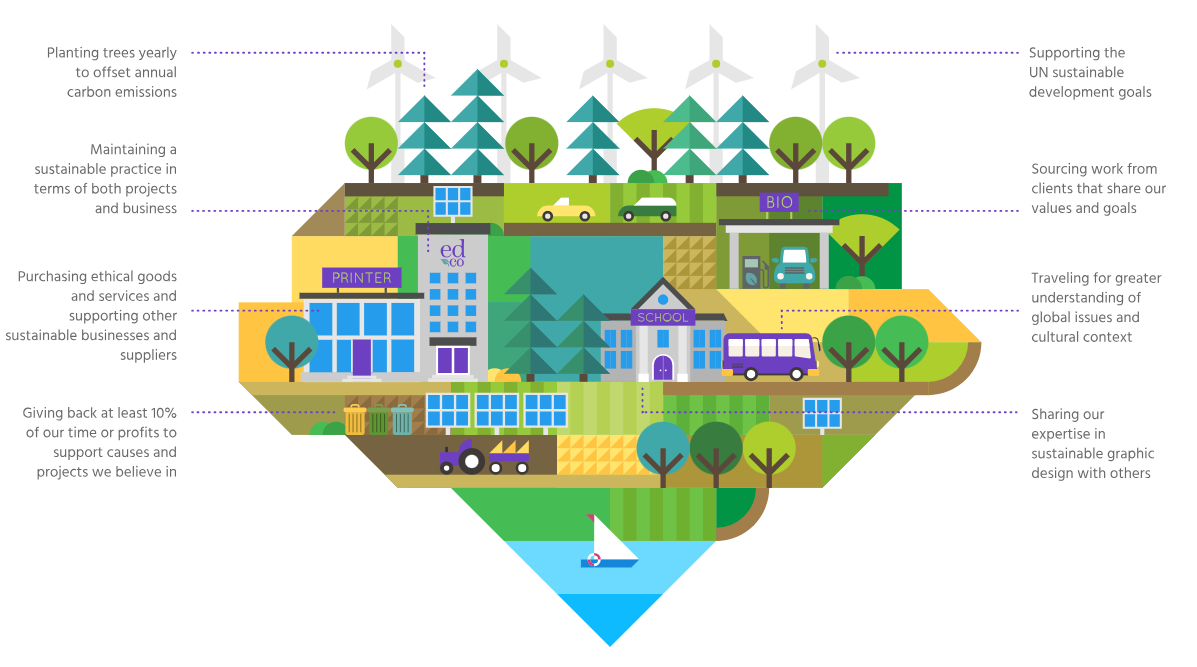
1012. Values frames (van Noordwijk 2023)
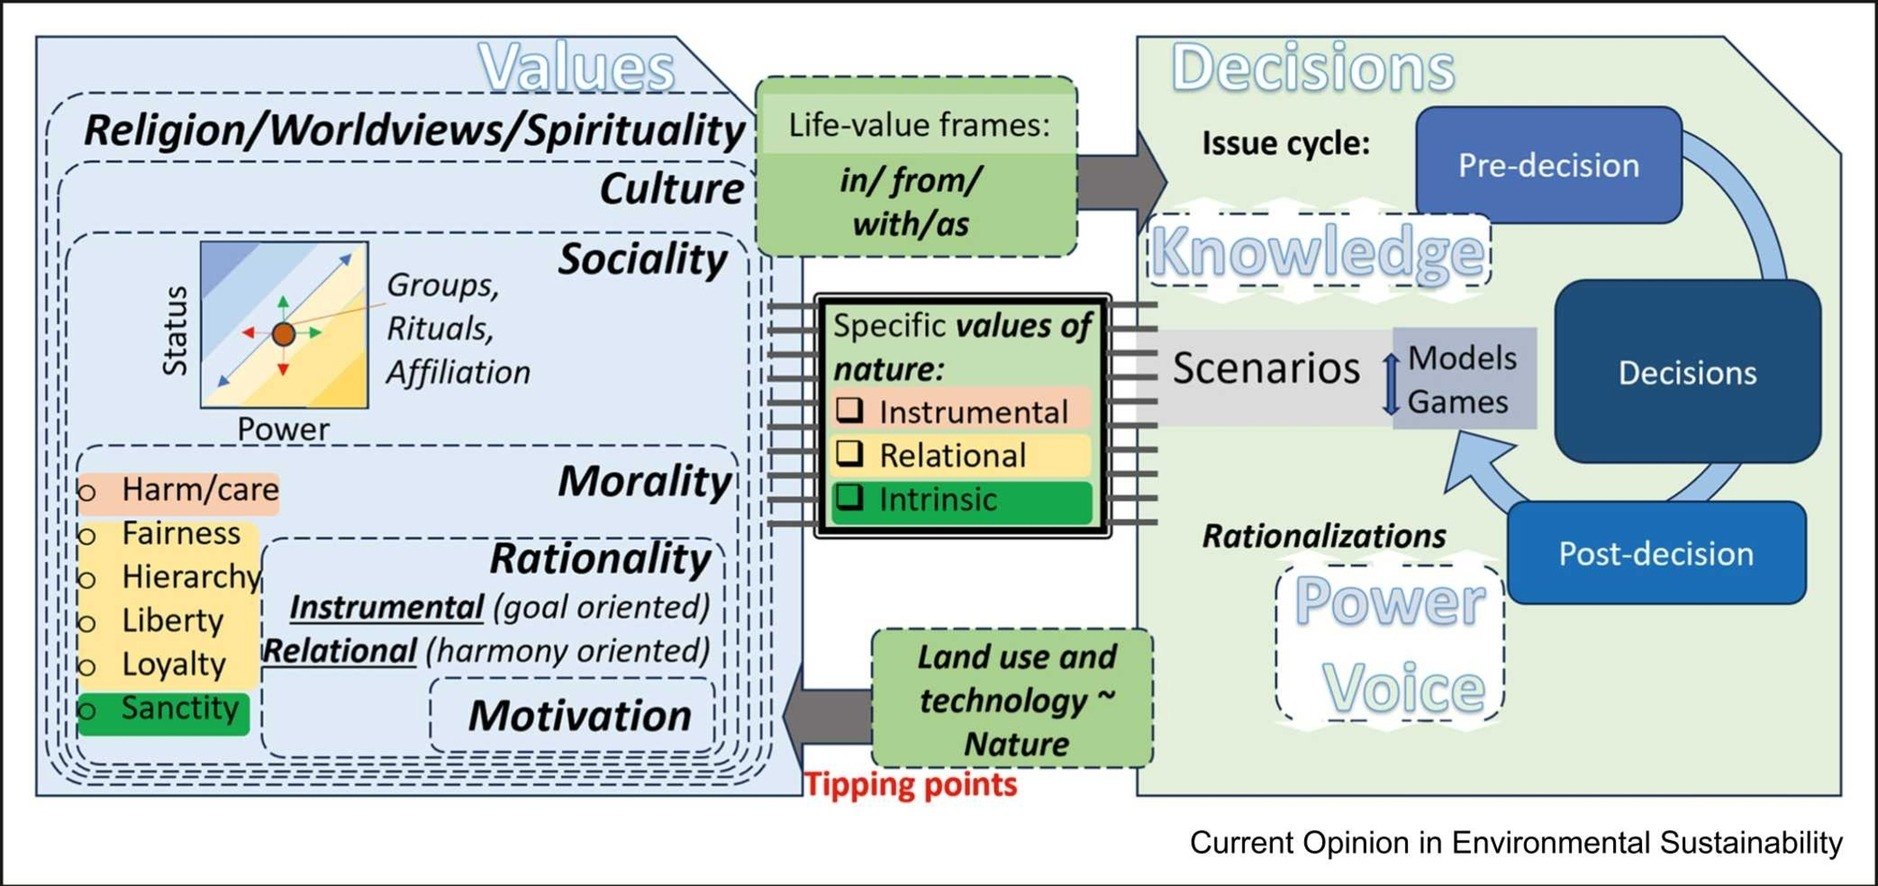
1013. Realization of a “prosperous” society where people can live with peace of mind and a spiral increase in corporate value (Toyobo 2023, pdf)
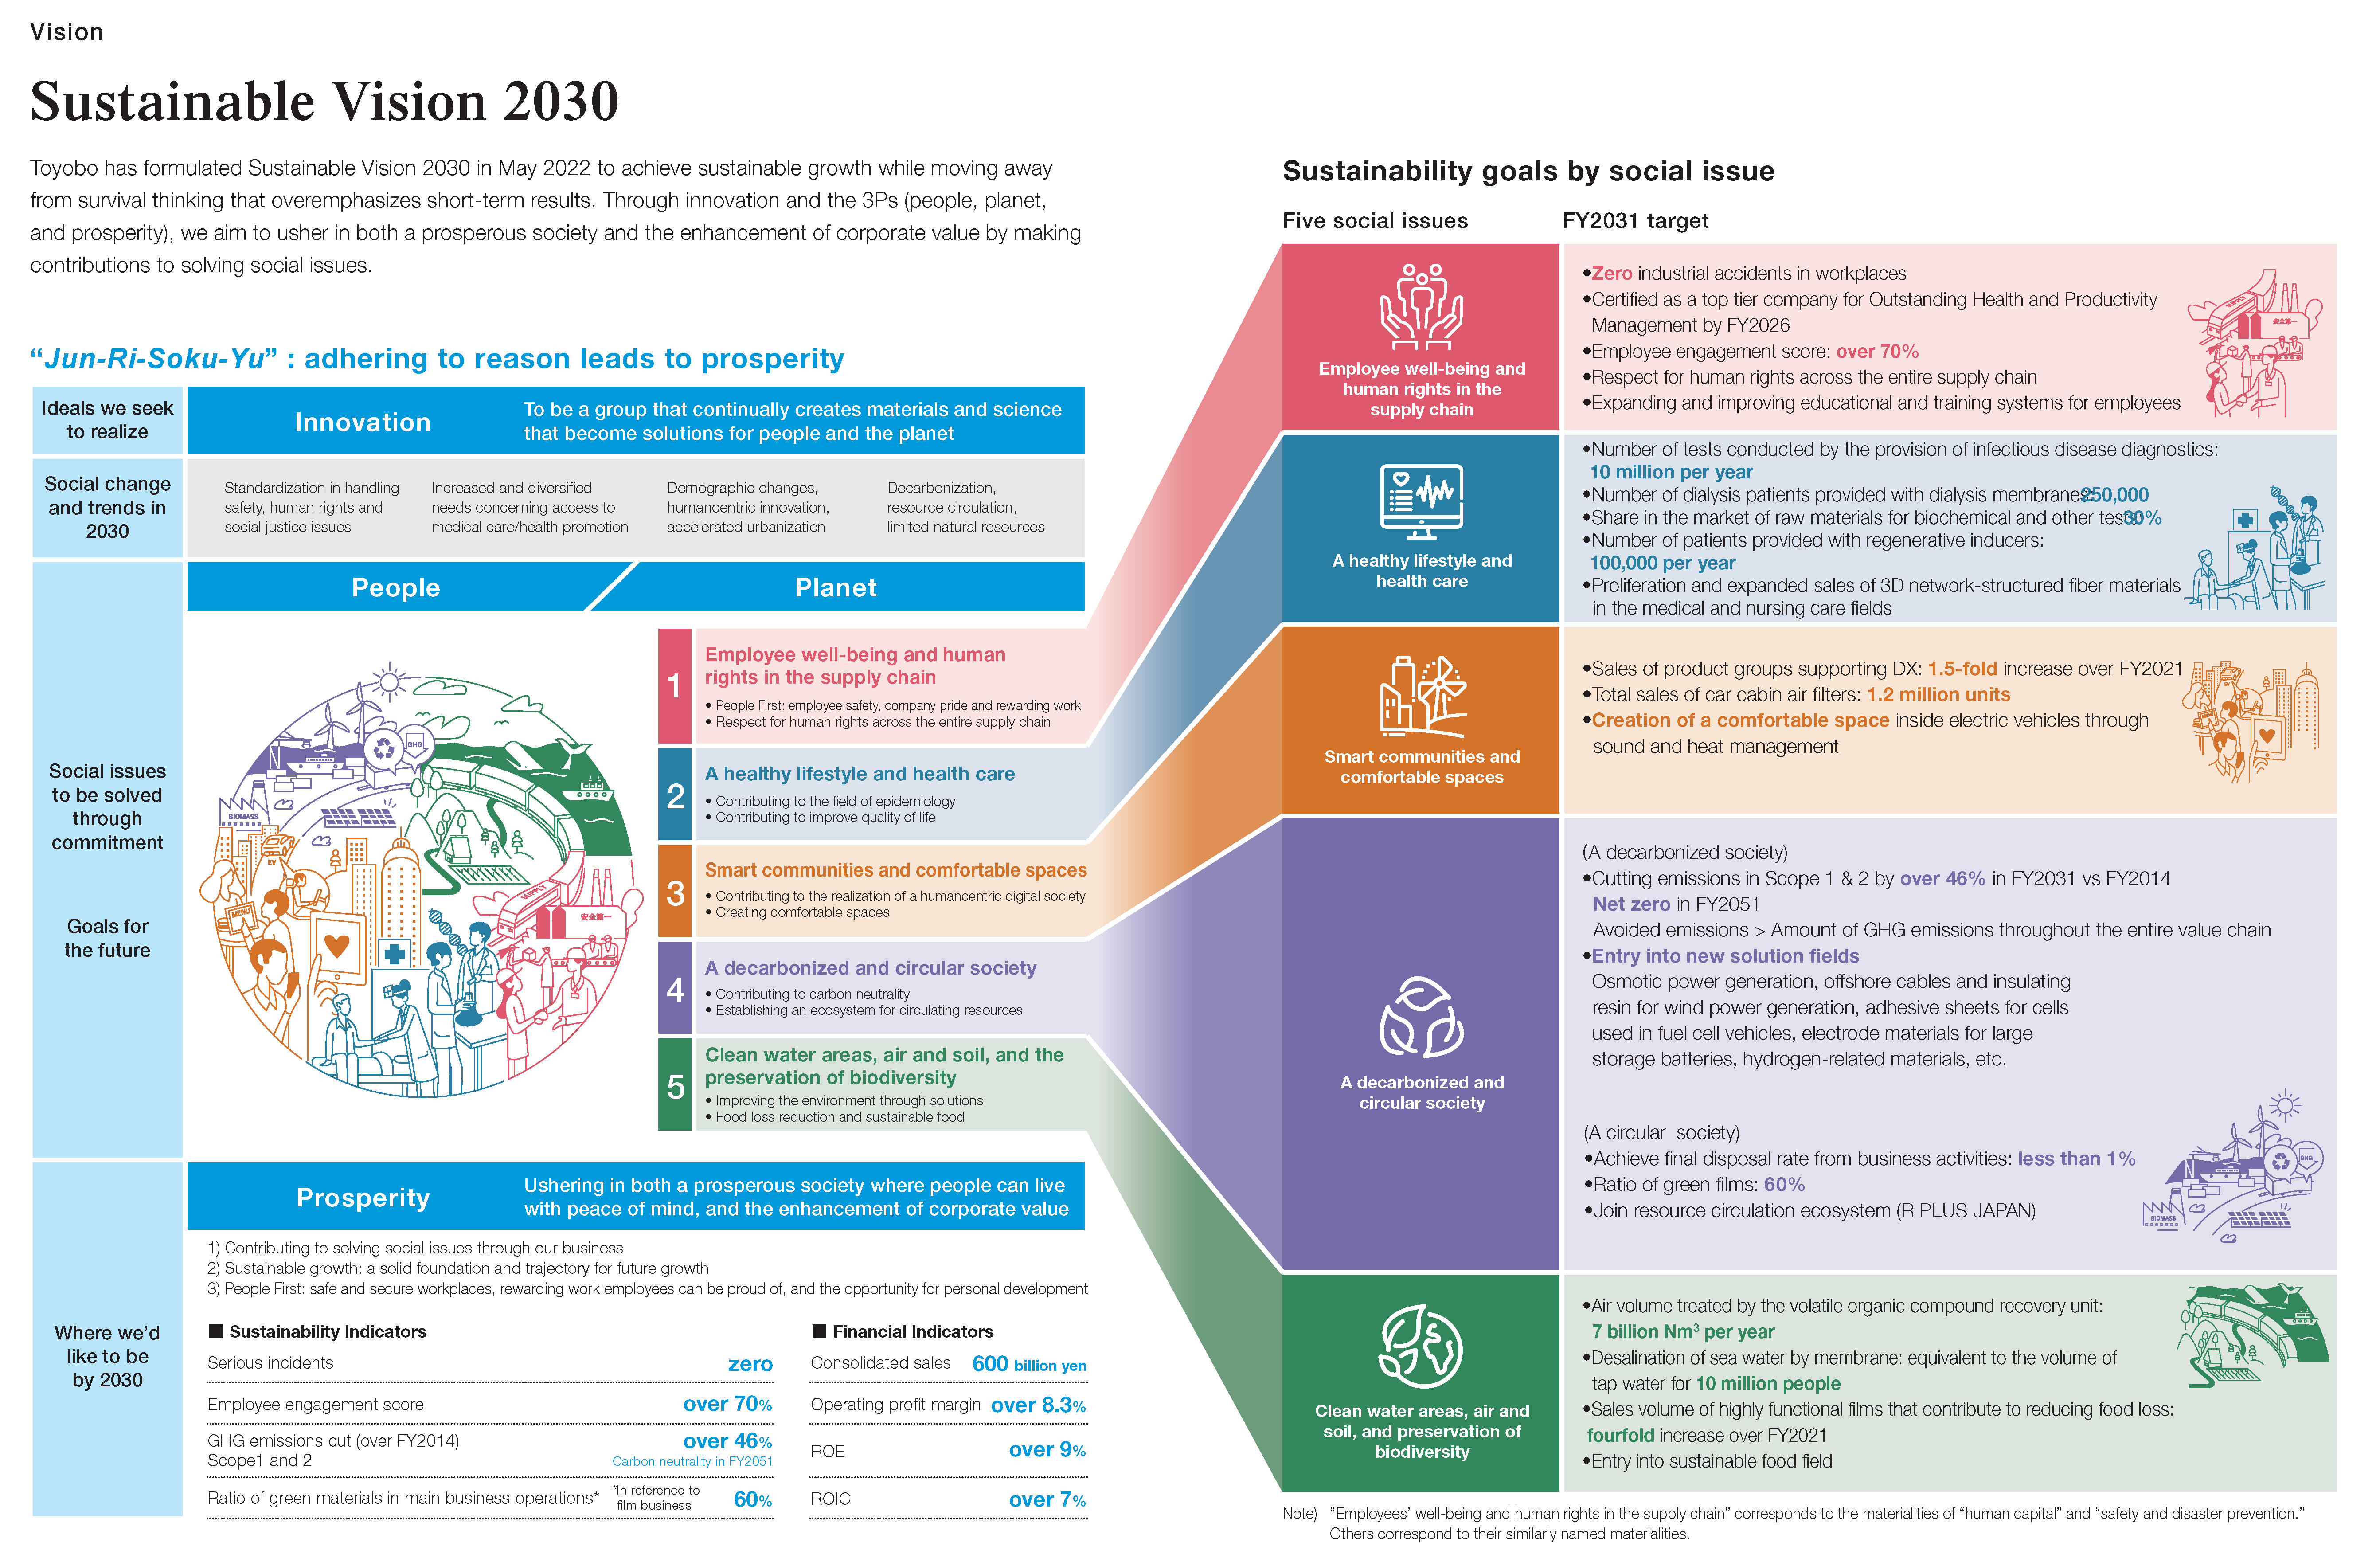
1014. Sensemaking for entangled urban social, ecological, and technological systems in the Anthropocene (Chester et al. 2023)
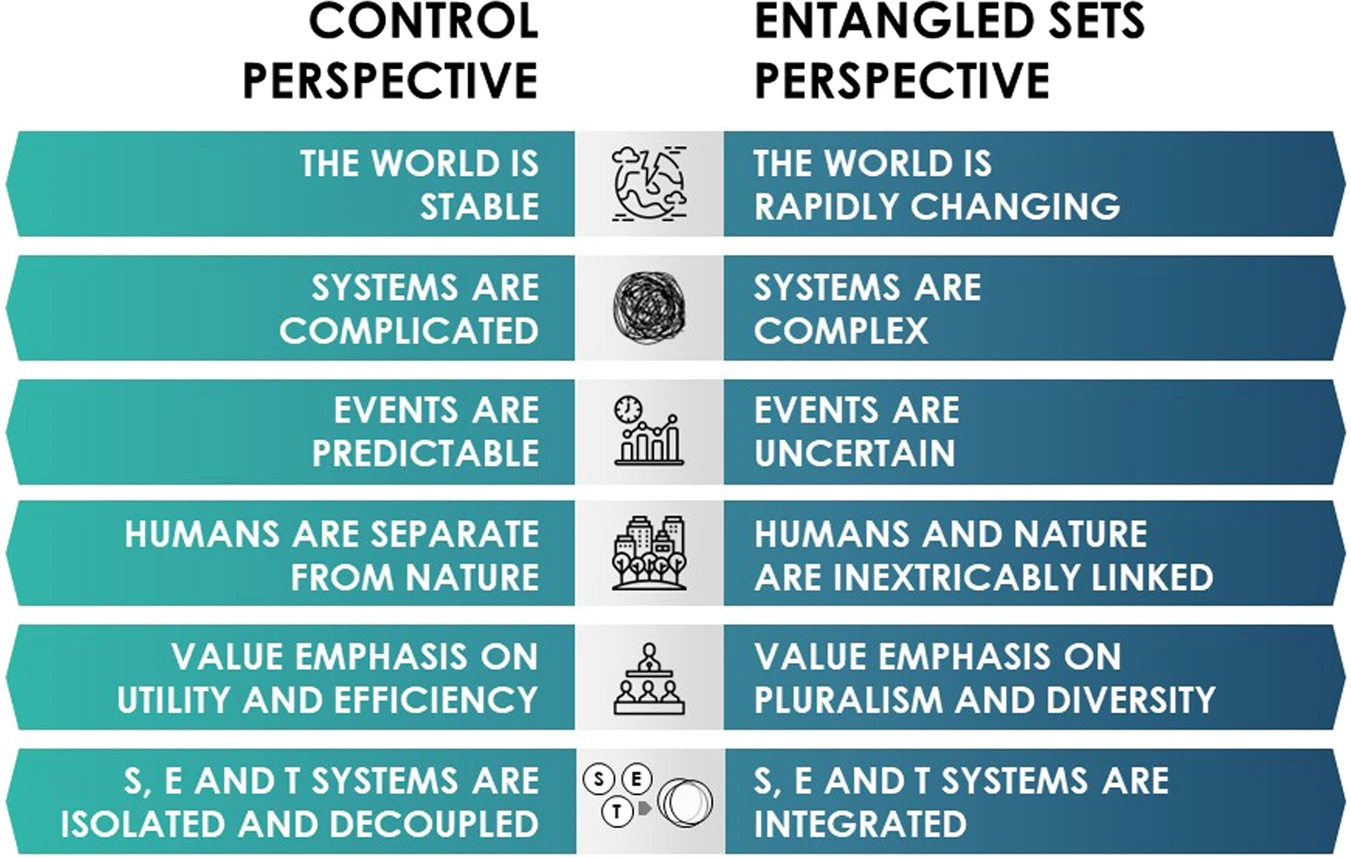
1015. Entangled Sensemaking (Chester et al. 2023)
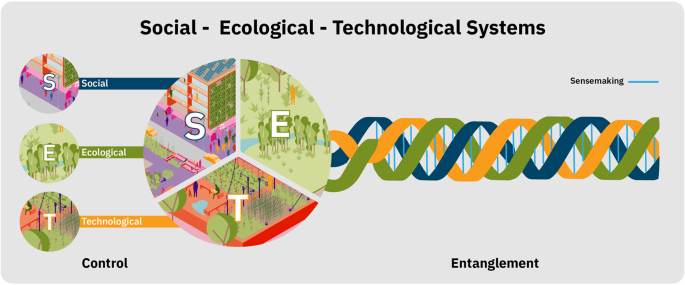
1016. Relational turn (Himes and Dues 2024)
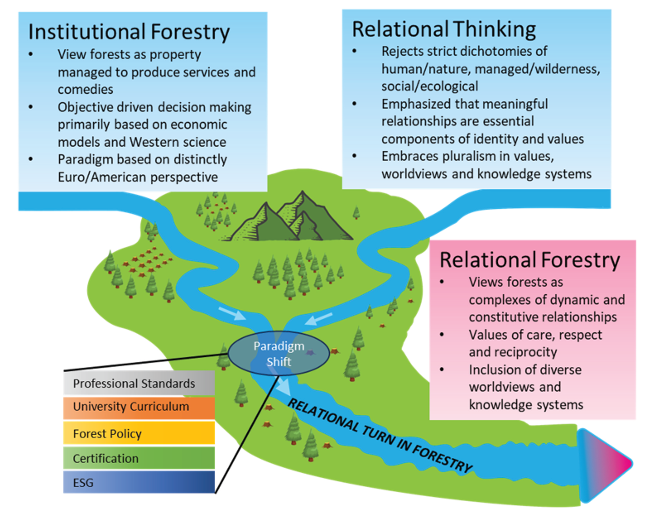
1017. Terminal (Osberg 2024)
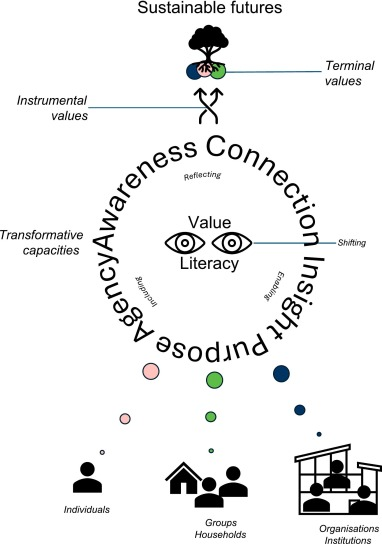
1018. Peas in our time? (Harmáčková 2023)
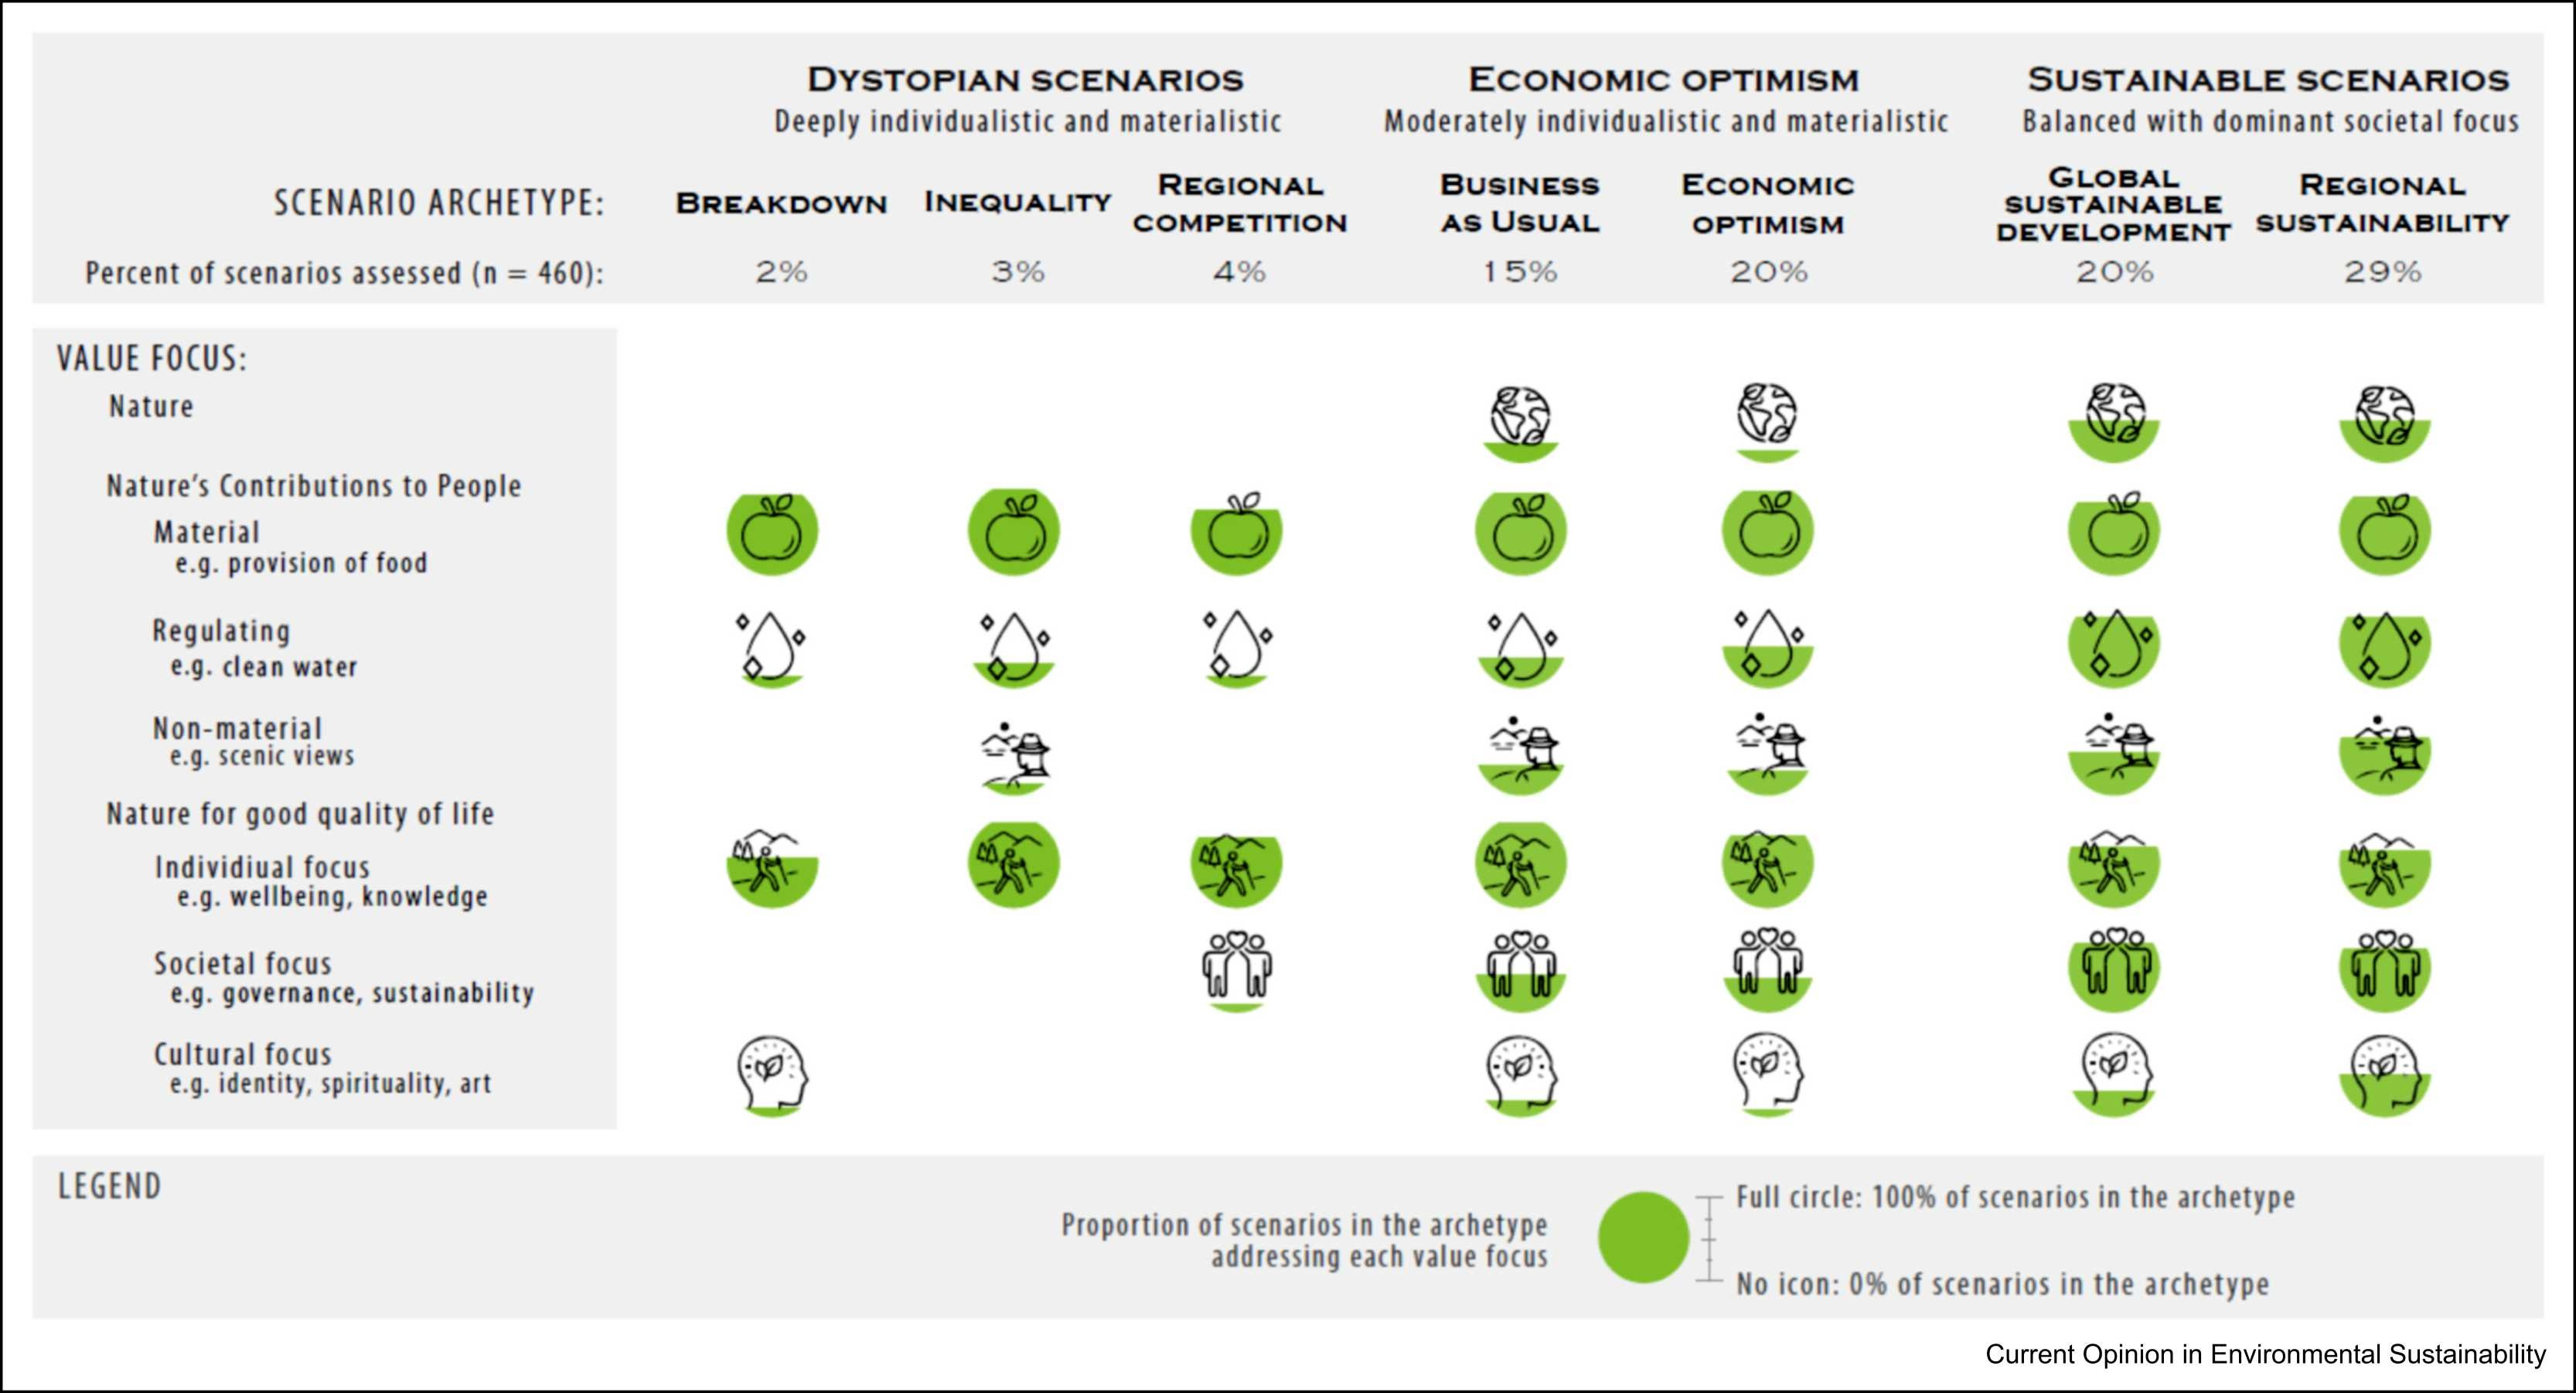
1019. Relational sustainabilities relationships (West et al. 2024)
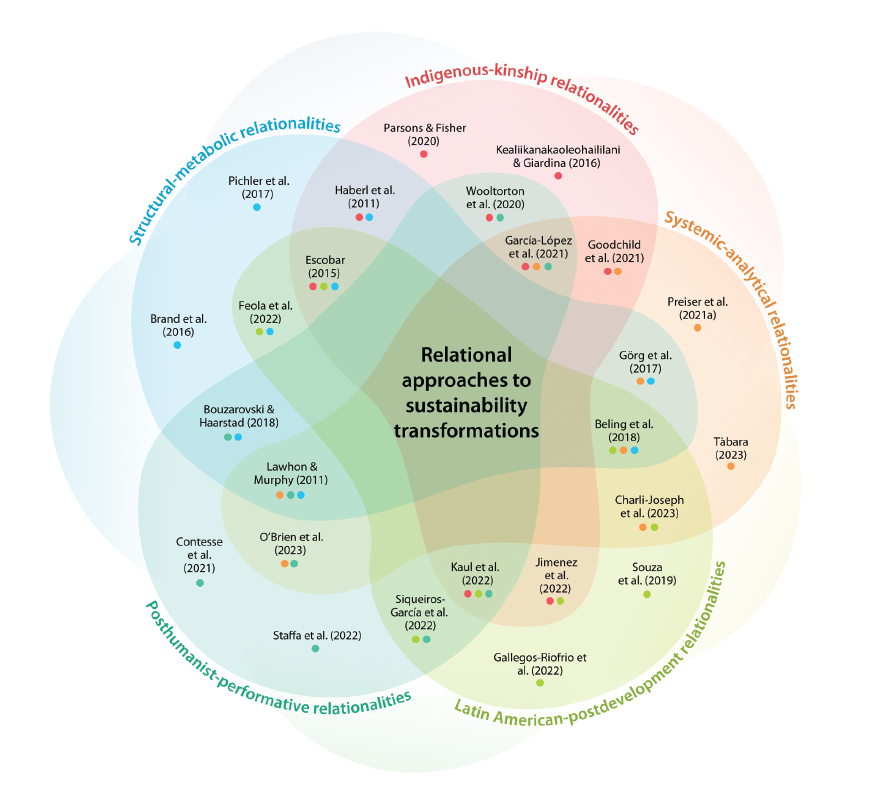
1020. Nature’s contribution to people (Locatelli et al. 2023)
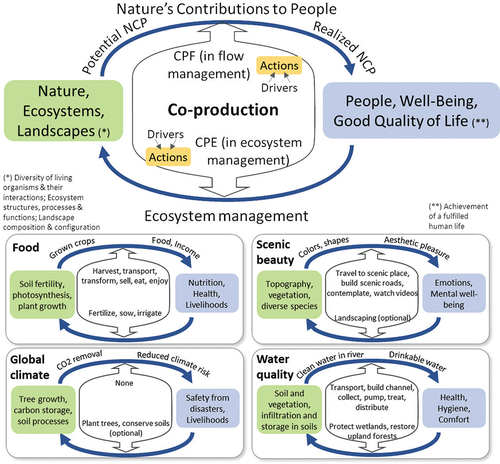
1021. Nature Futures (yes again, different diagram) (Oostvogels et al. 2024)
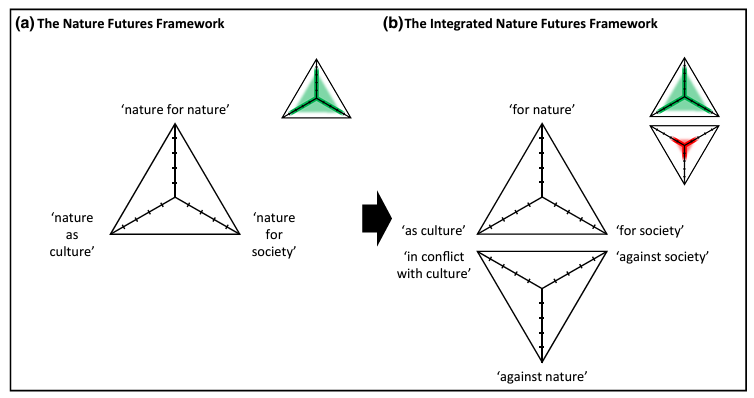
1022. Ecosystem Services Justice (Langemeyer et al. 2024)
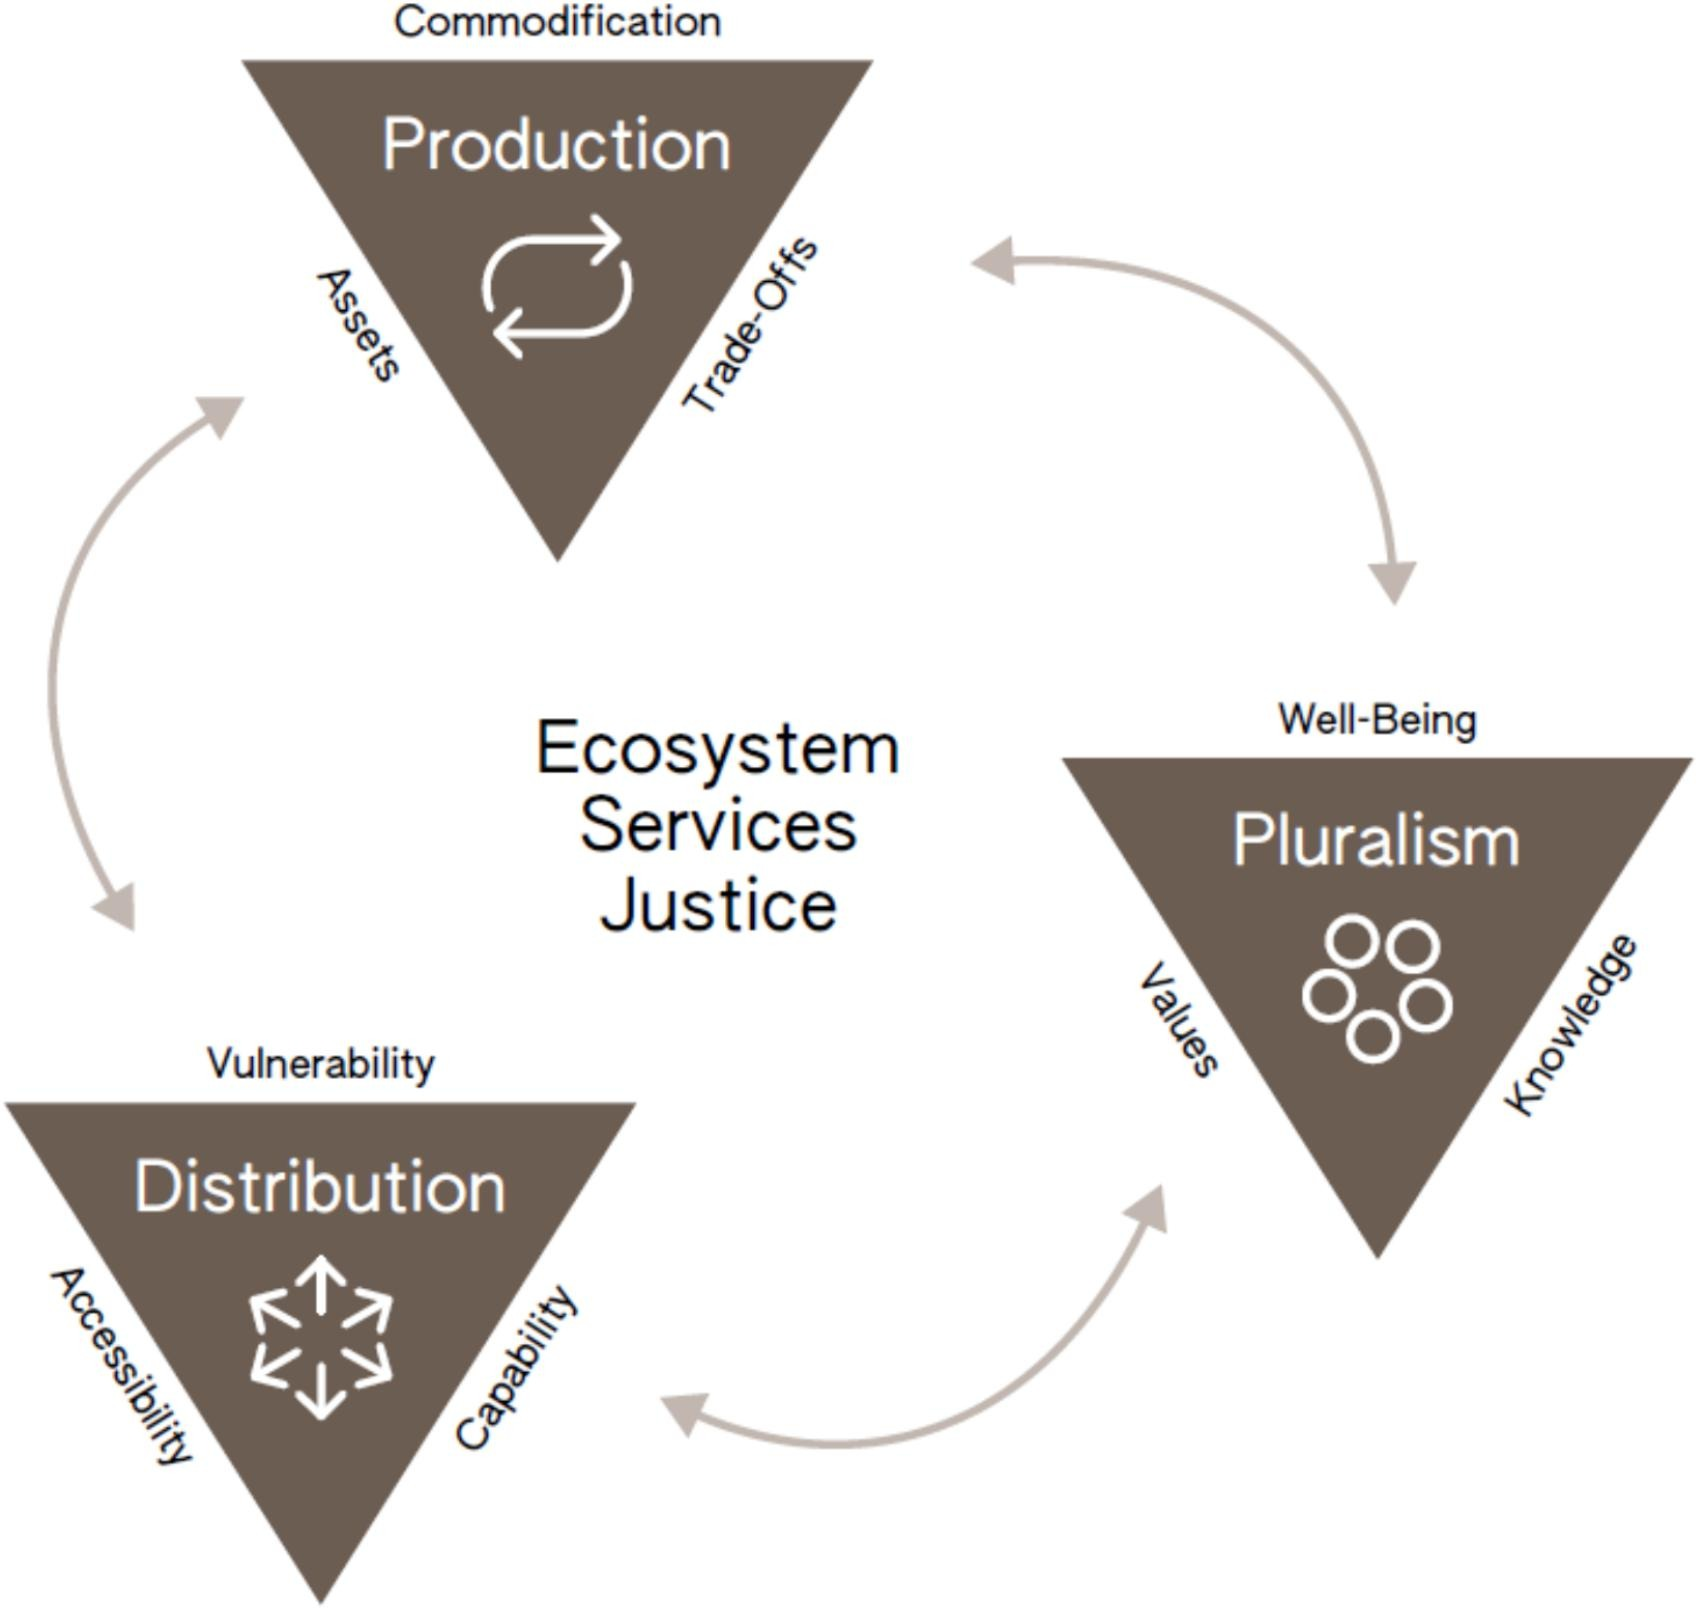
1023. Dreamcatcher – indigenous values (Menzies et al. 2024)
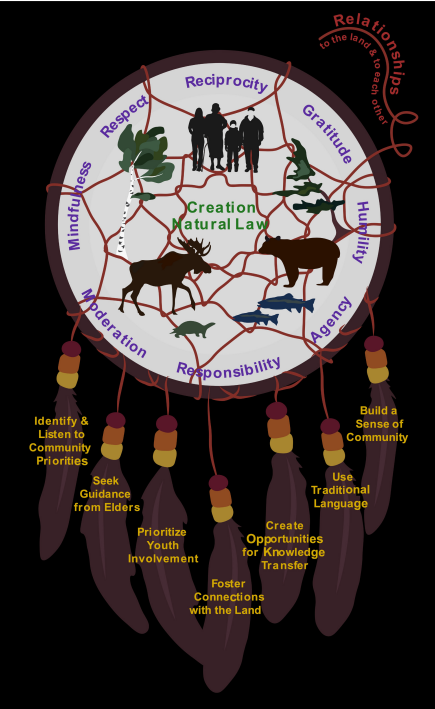
1024. Indigenous futures thinking (Cheok 2025)
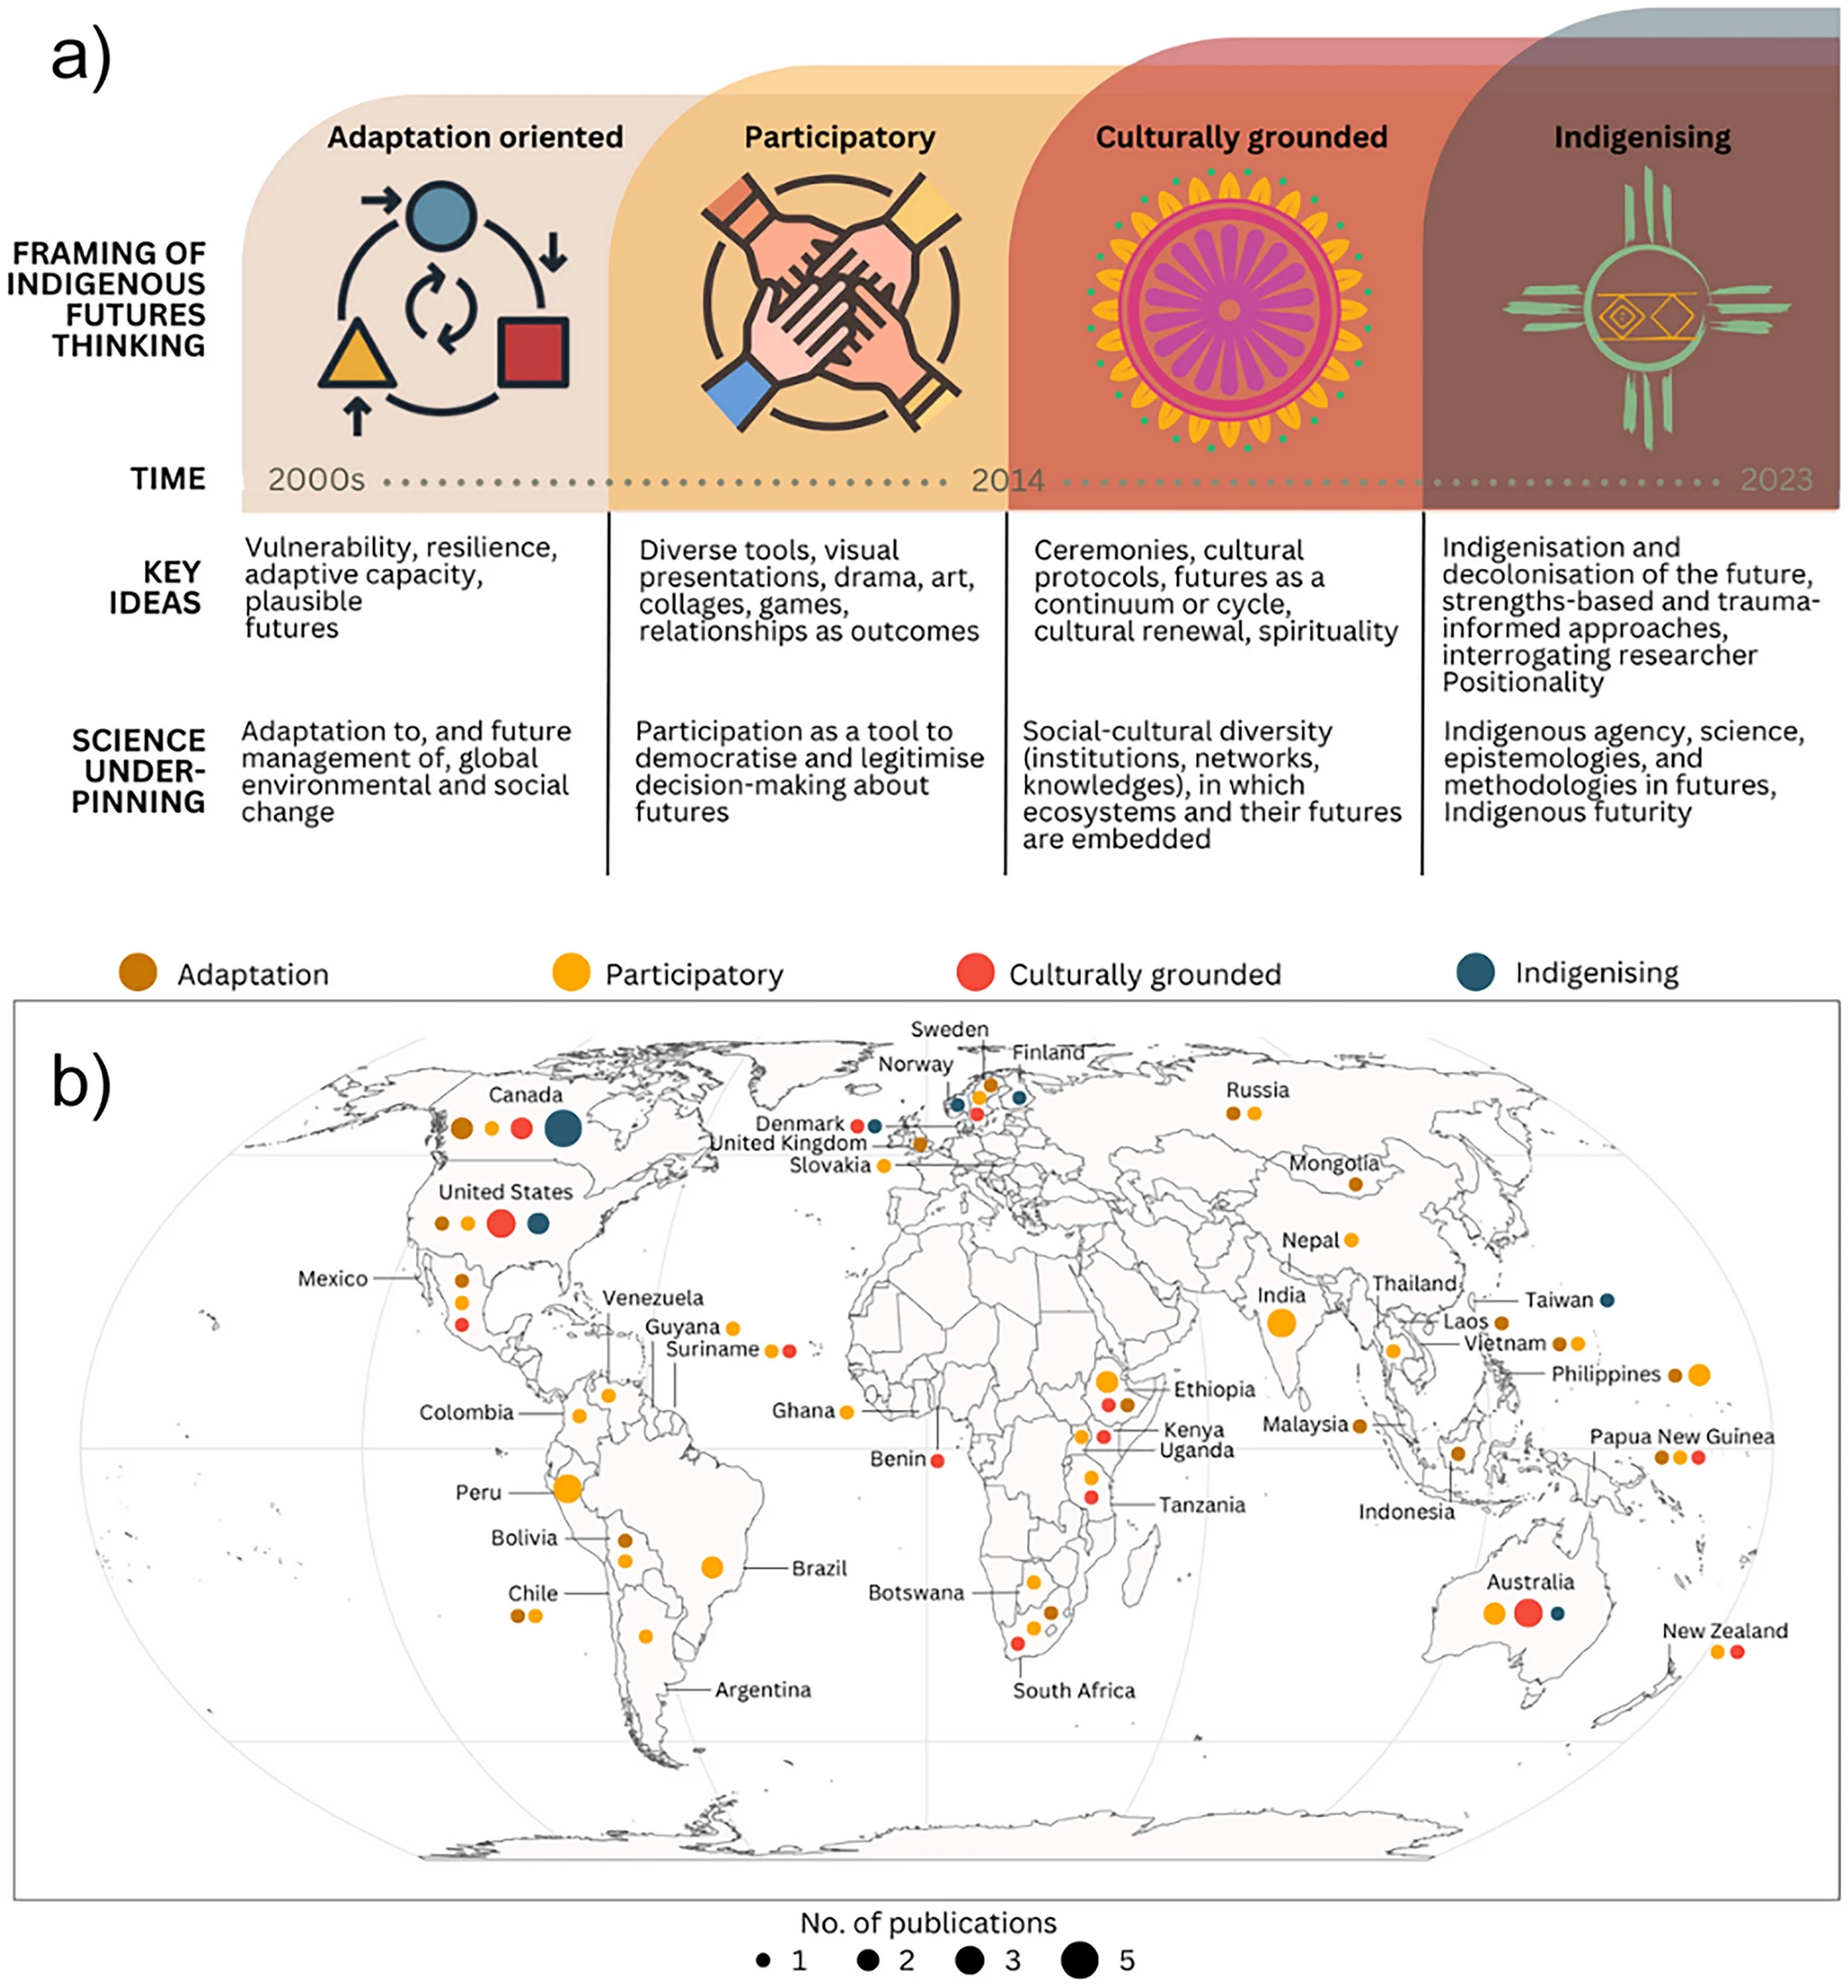
And bonus
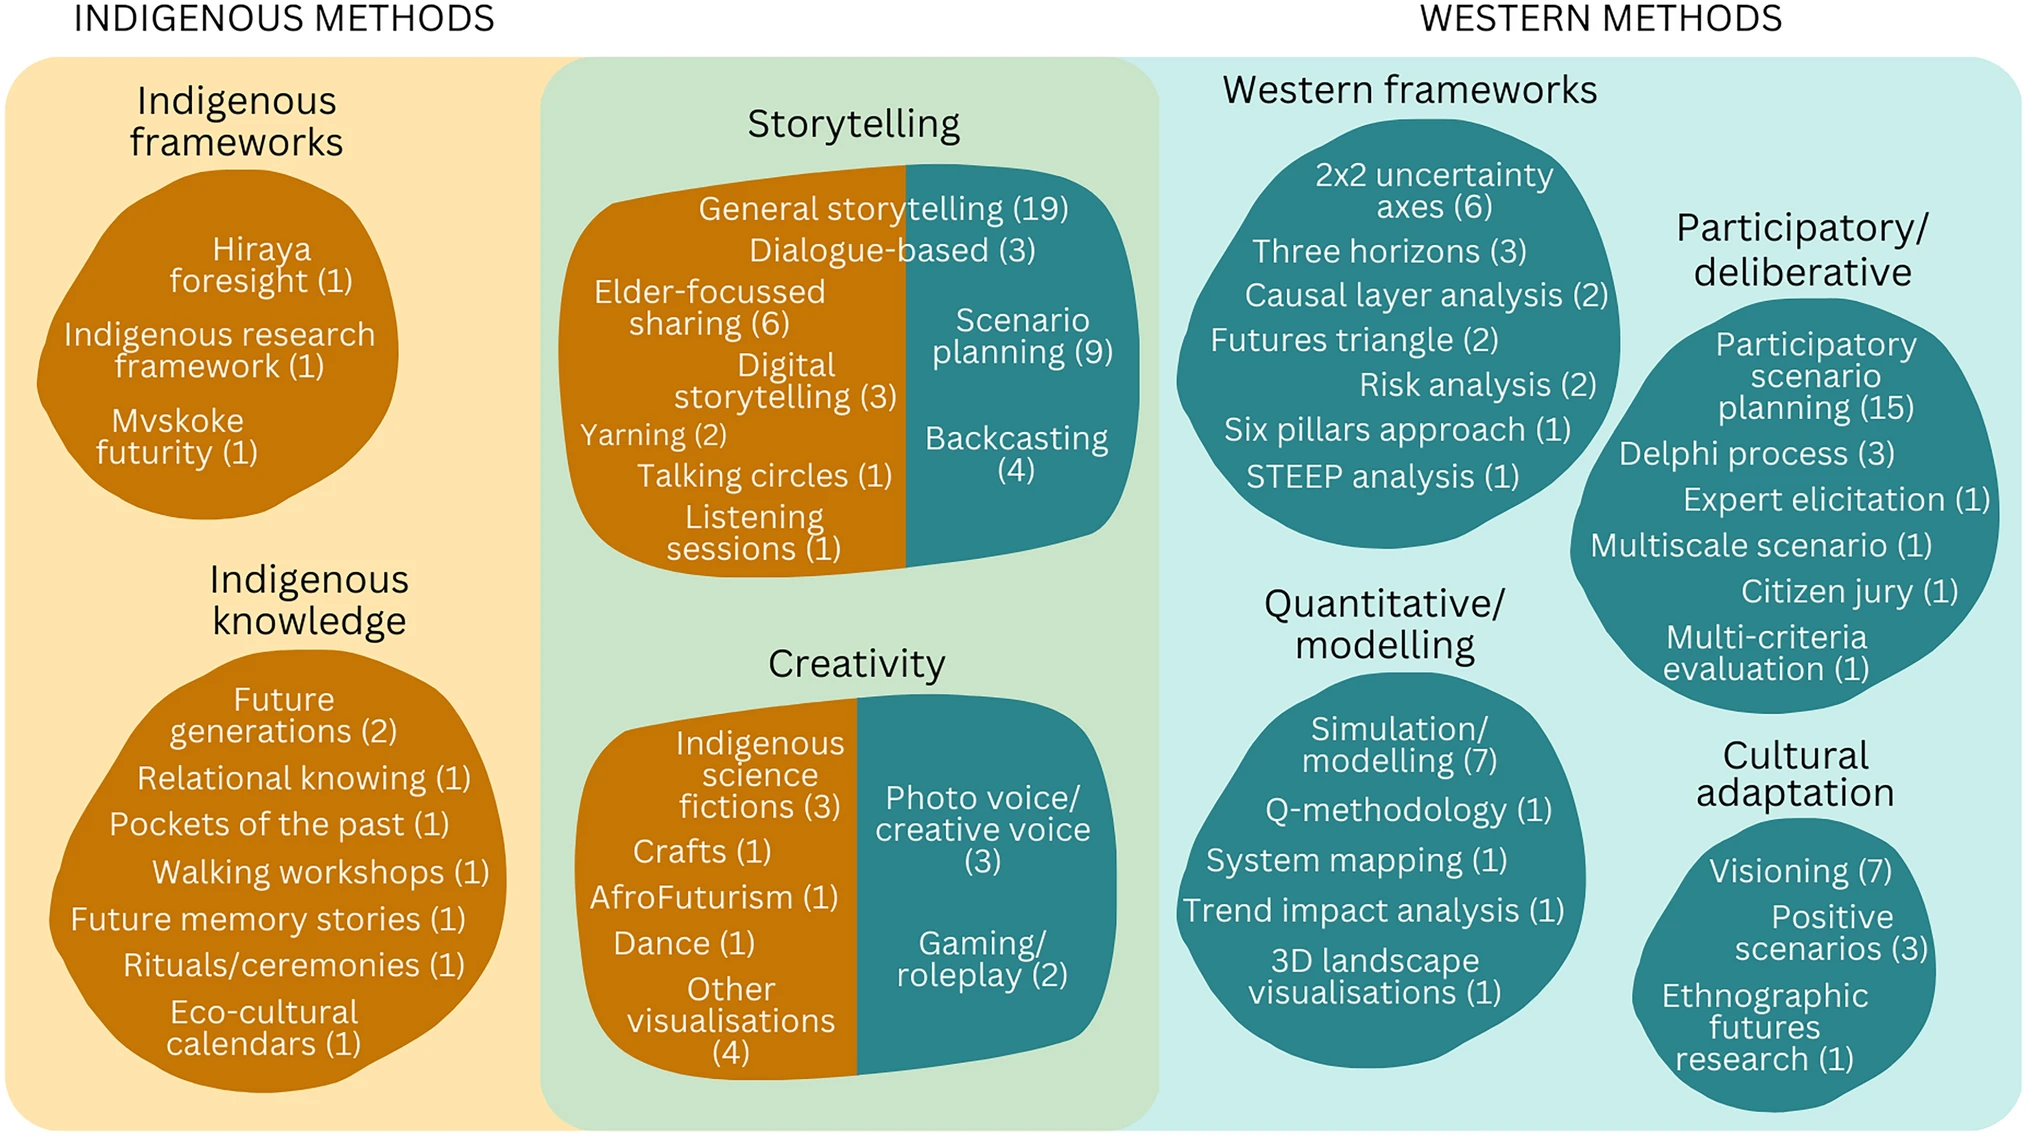
1025. Empathy for the planet through participatory ecological storytelling. (Talgorn and Ullerup 2023)

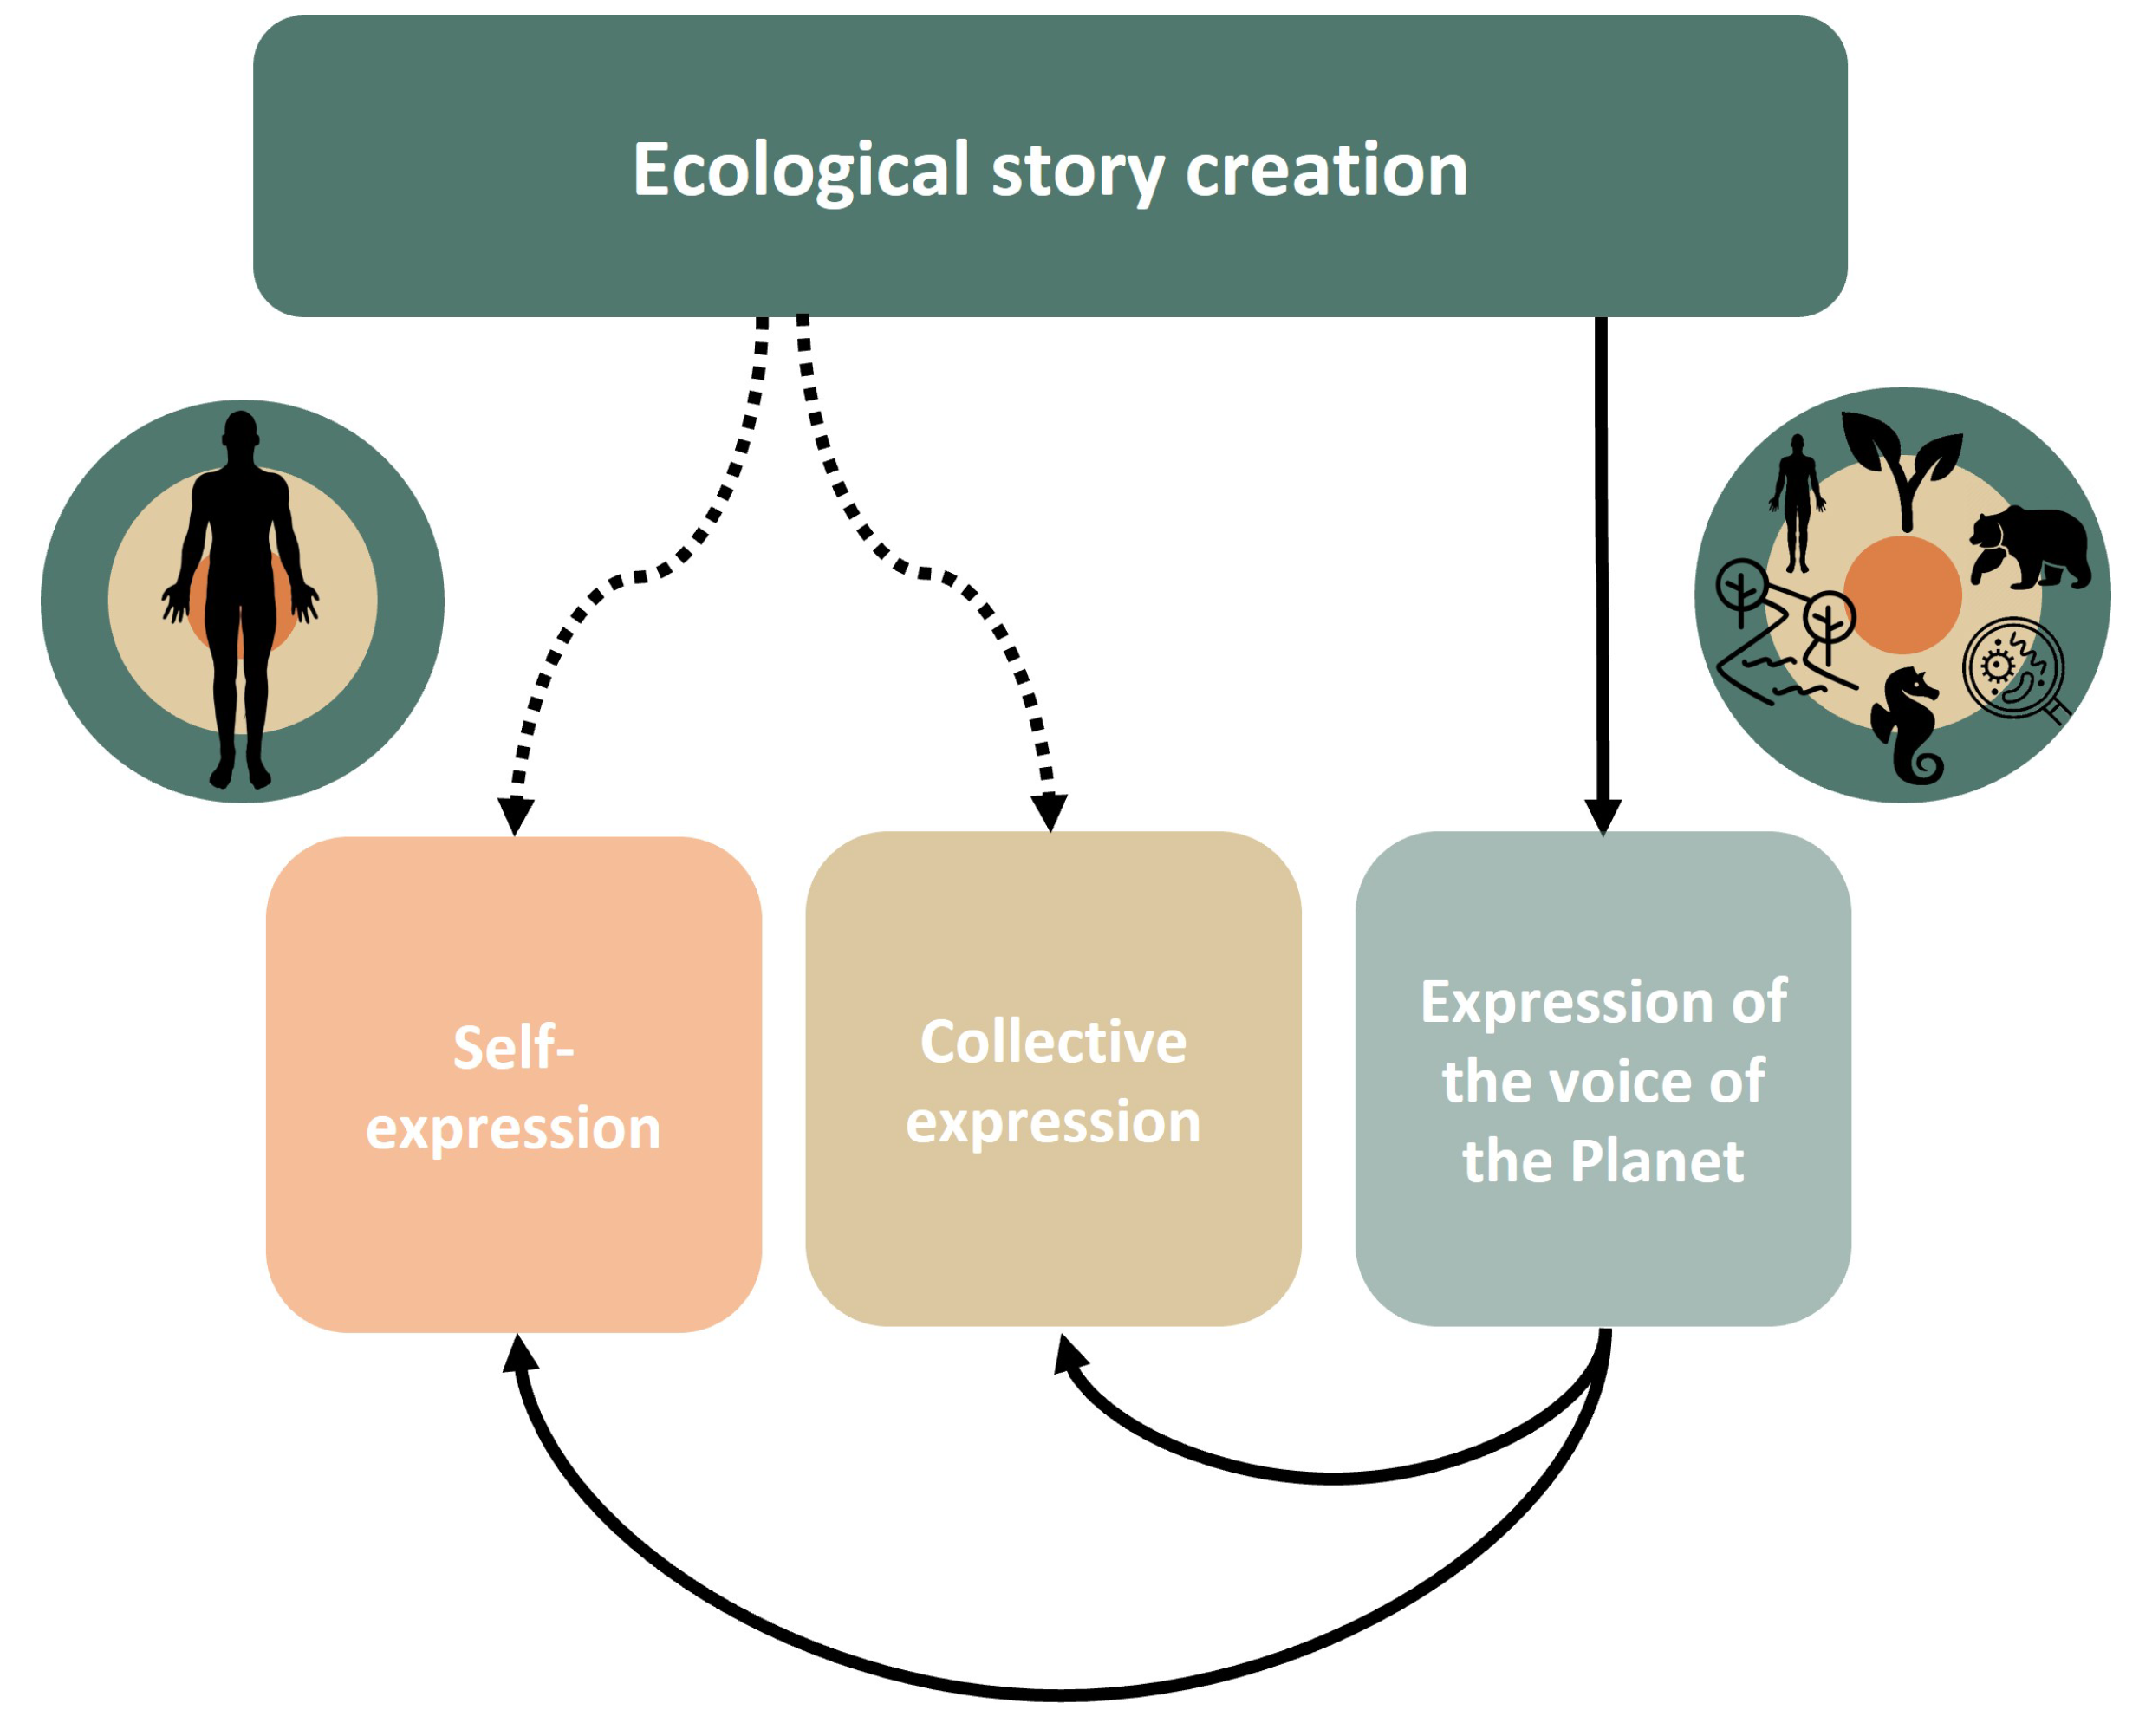
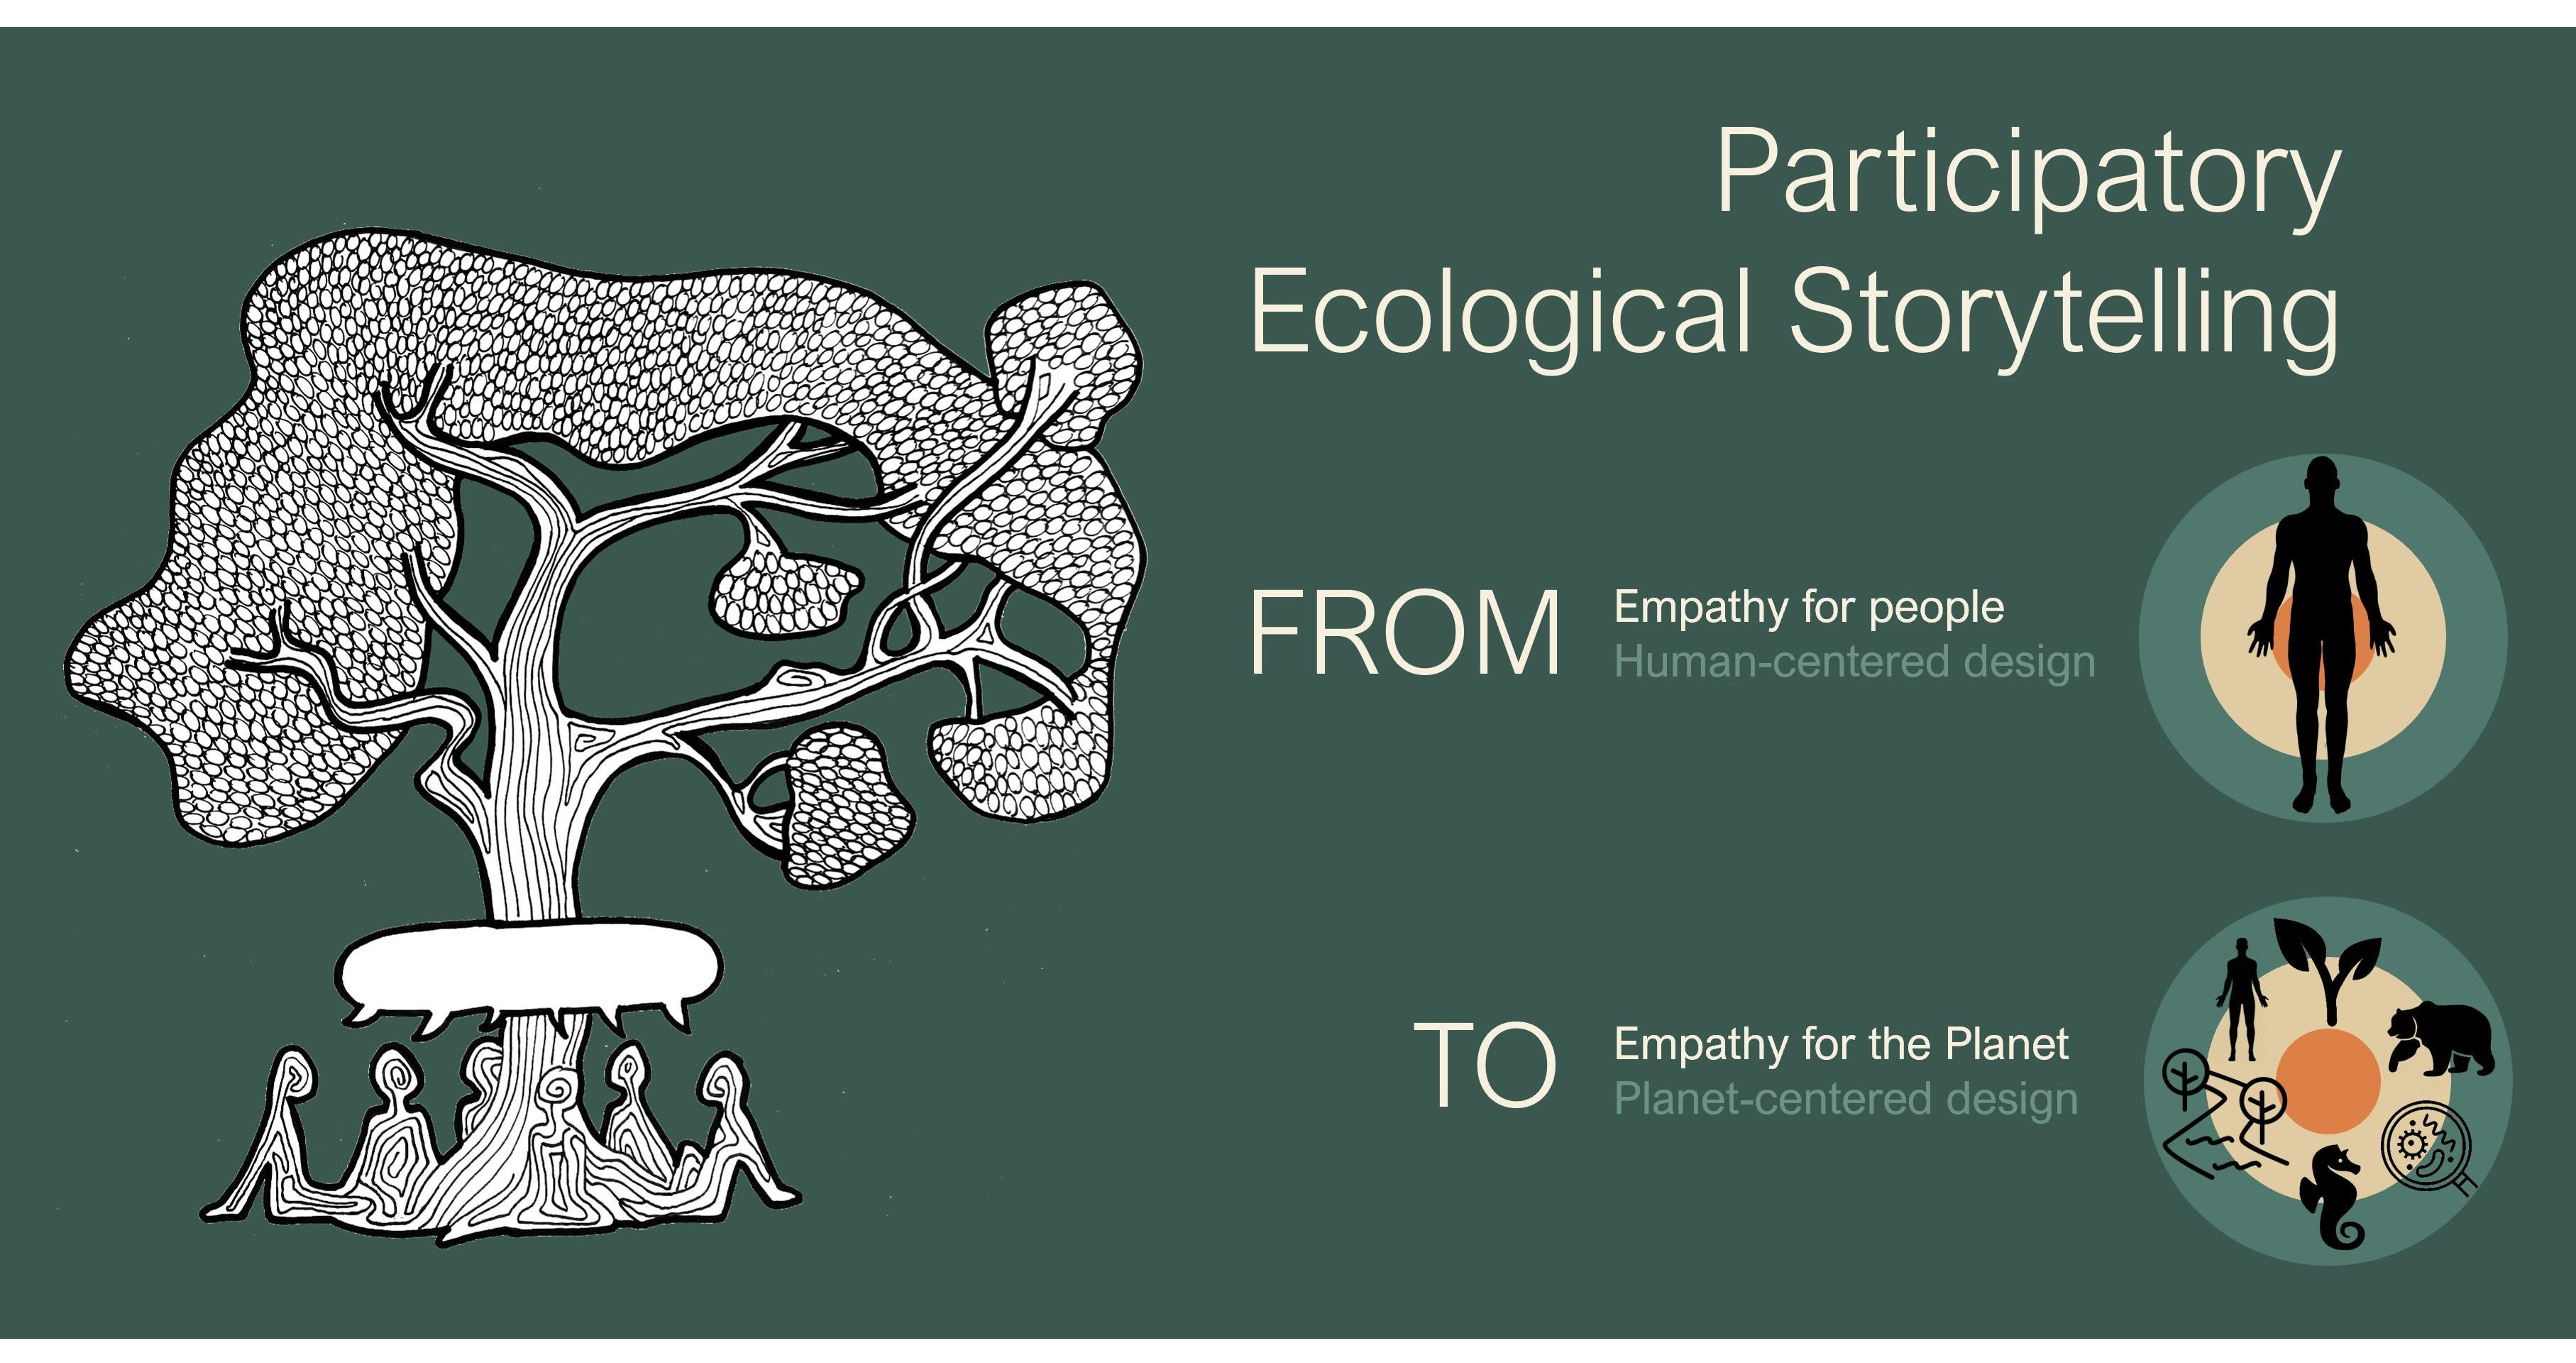
1026. Four mottos (Gonzales 2025)
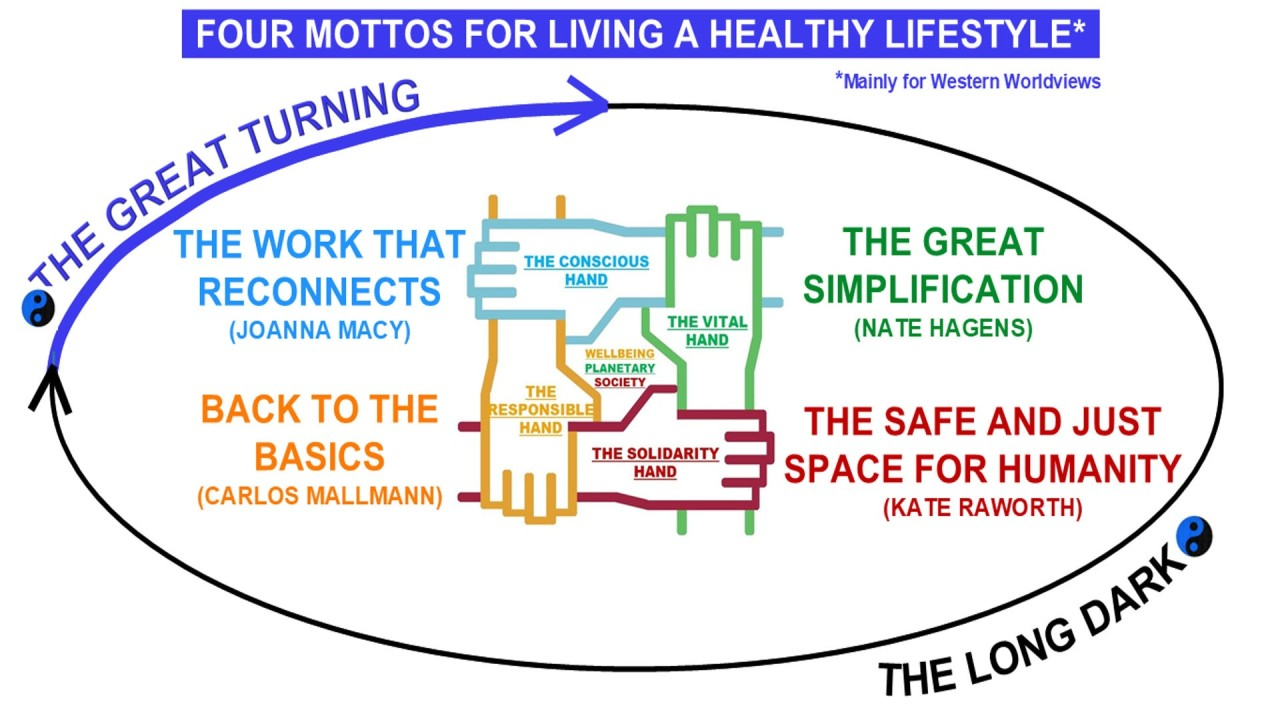
1027. MAMA (Gonzales 2025)
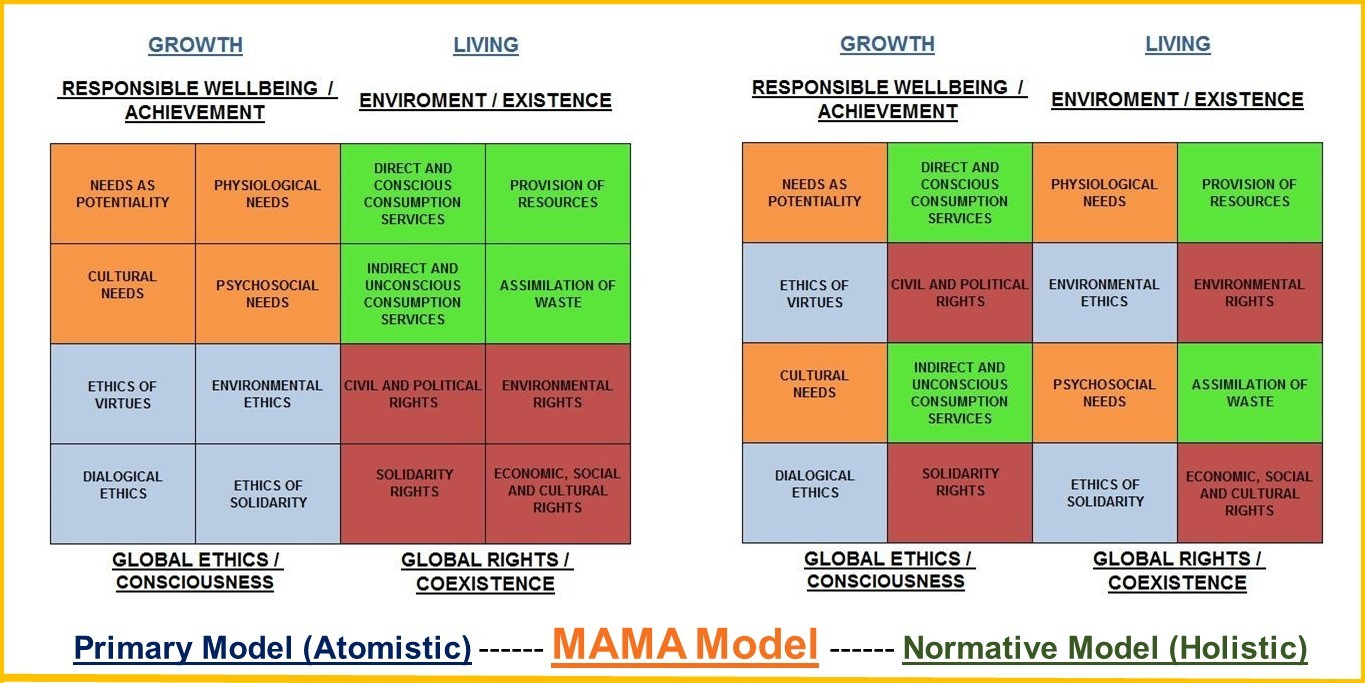
1028. Colourful pathways (Gonzales 2025)
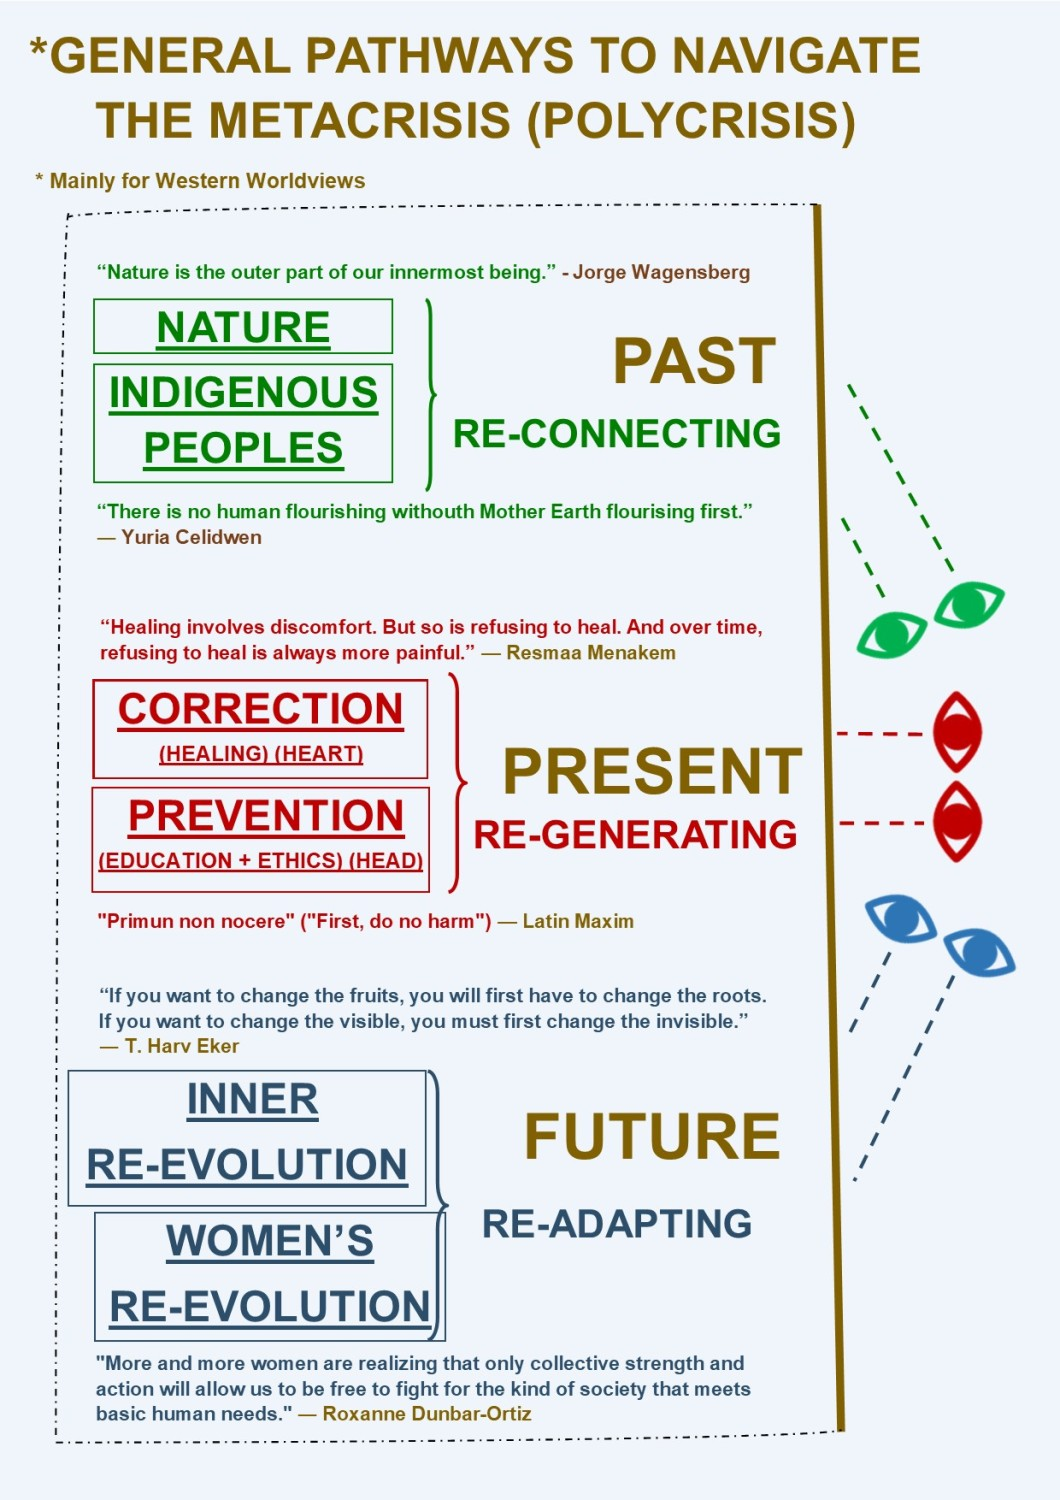
1029. Metaphorical (Saglietti 2026)
Prefiguration of desirable futures by envisioning different aspects of futures imaginaries and developing coherent transformative strategies to enact and embody such futures in the present.

1030. Slices of doughnut (Gupta et al., 2024)
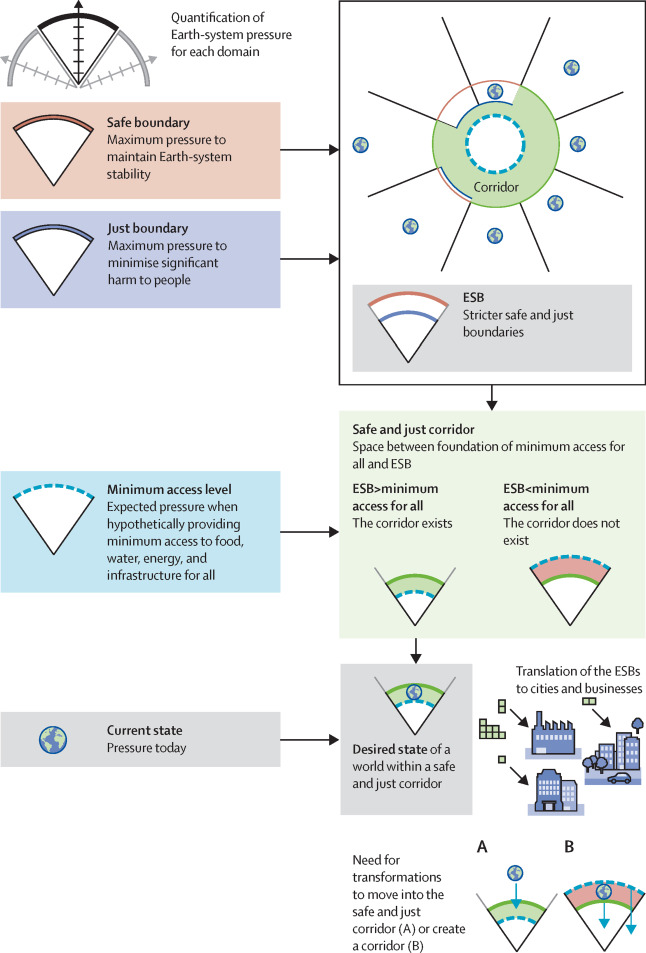
1031. Pillars of Justice! (Rockstrom et al, 2025)
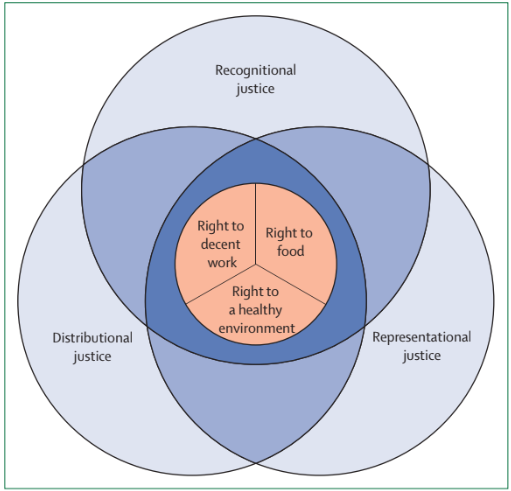
1032. Five extraordinary turnarounds (Earth4All.life)
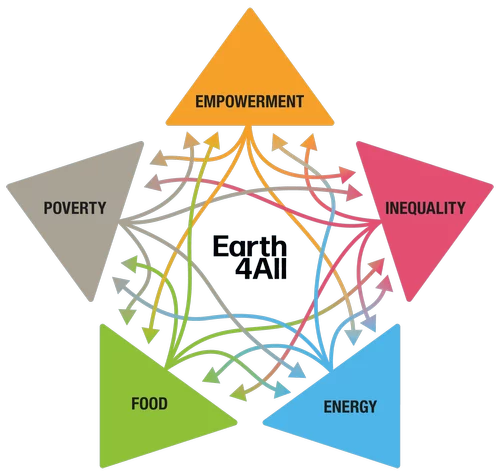
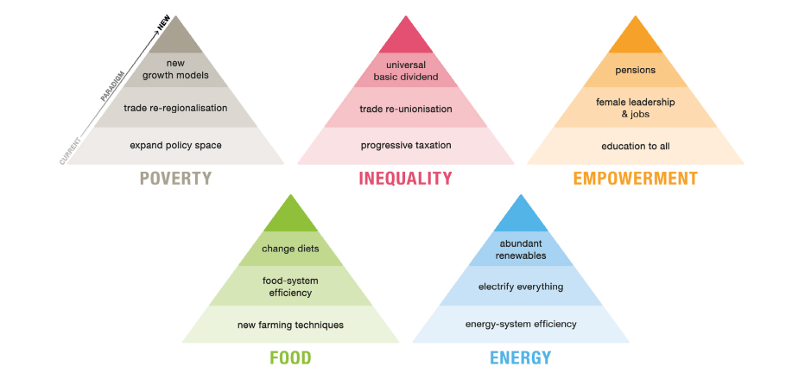
1033. Space Sustainability (Ćirković and Wood, 2025)
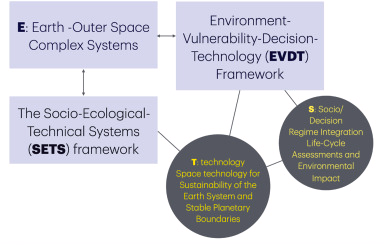
1034. Butterfly (Davelaar 2021) See also #633
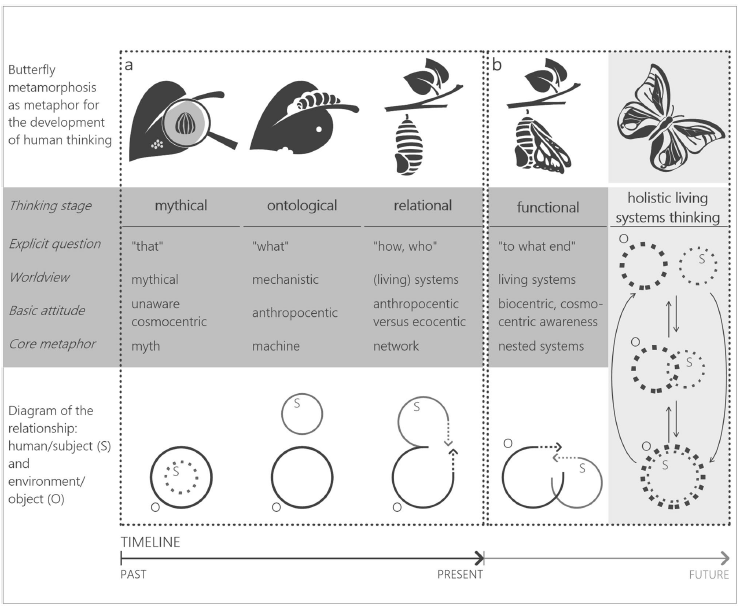
1035. Feeling the nature (Ballarotto et al., 2025)
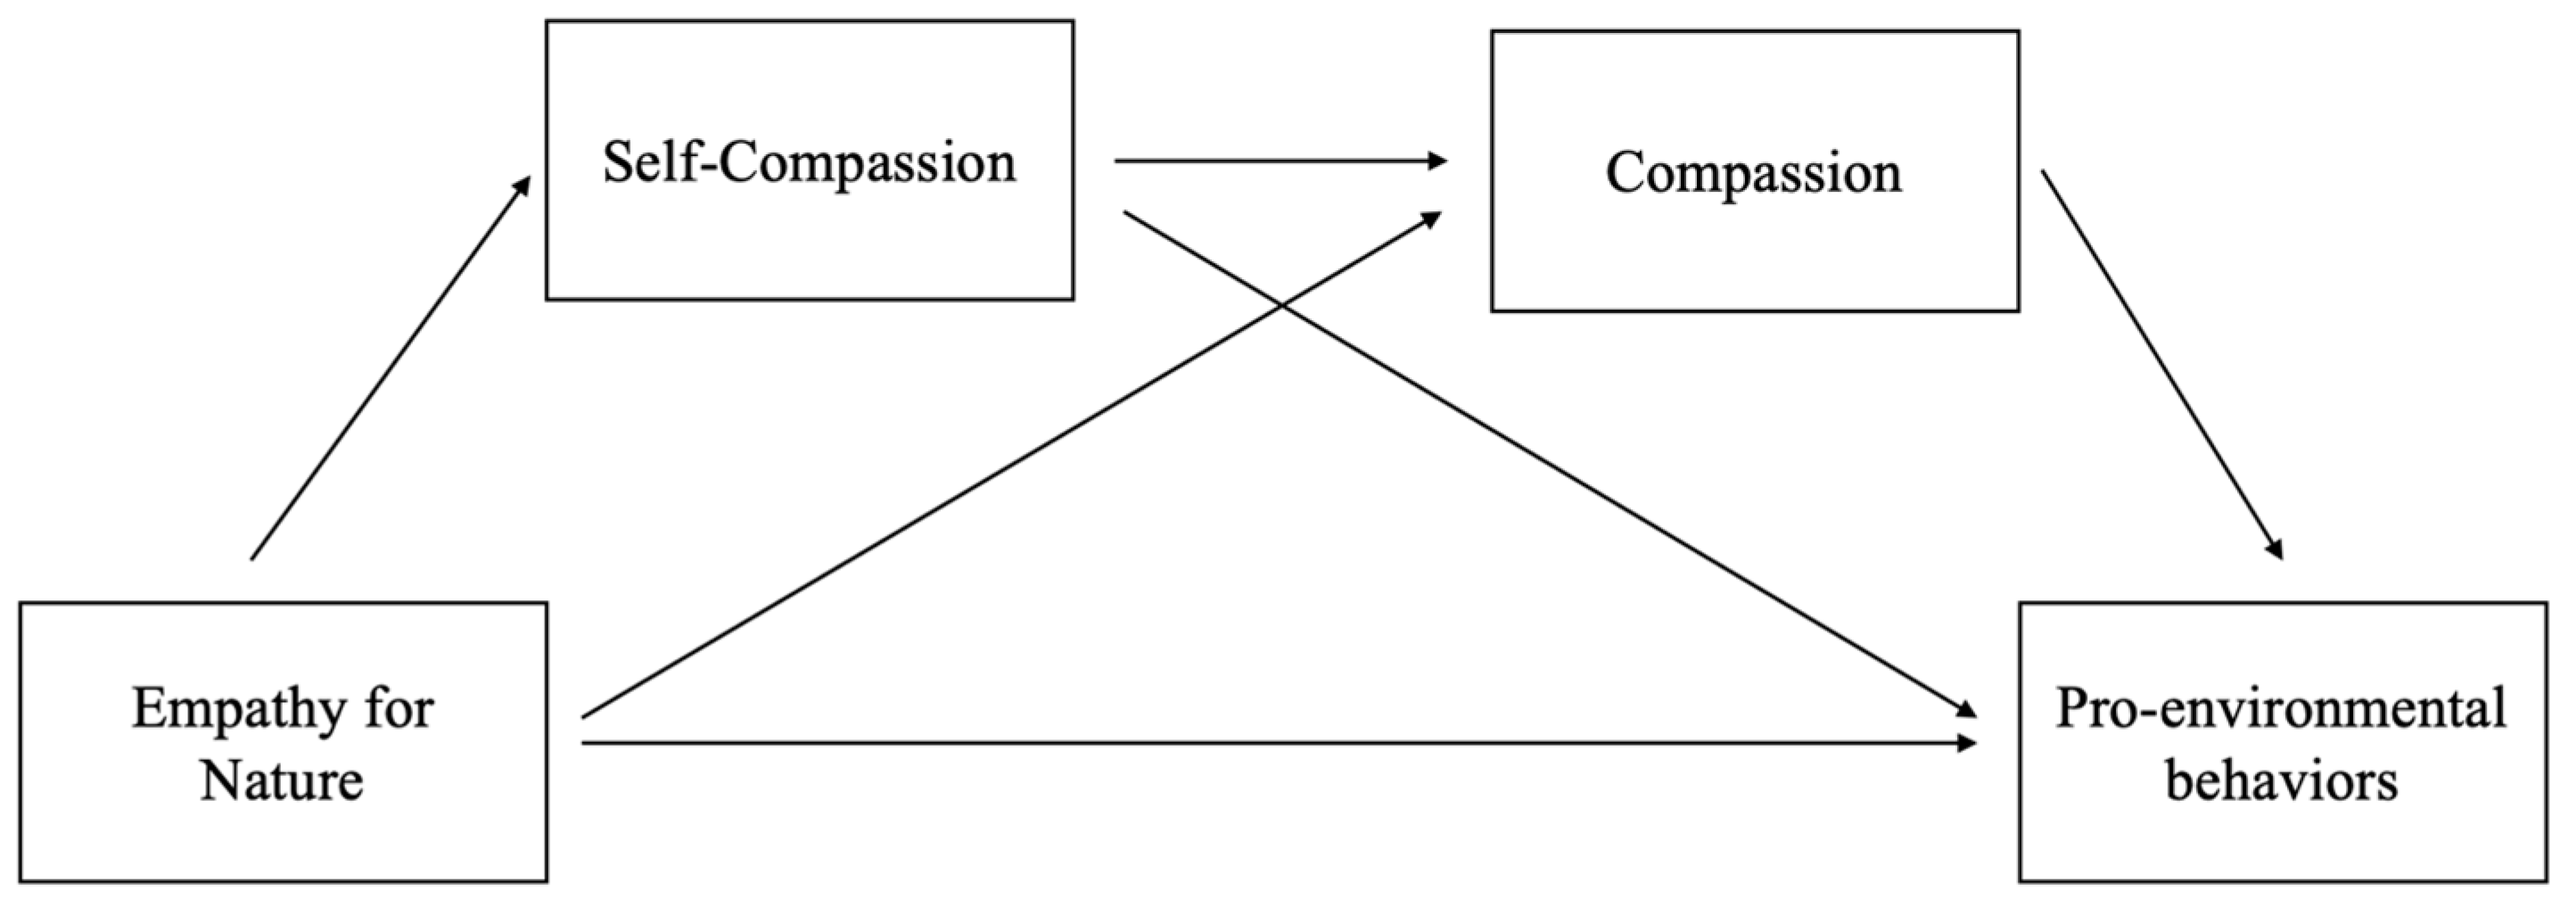
1036. Green as intersection of sustainable, environment and practices (in sense of Green Aviation) (Saade et al., 2025)
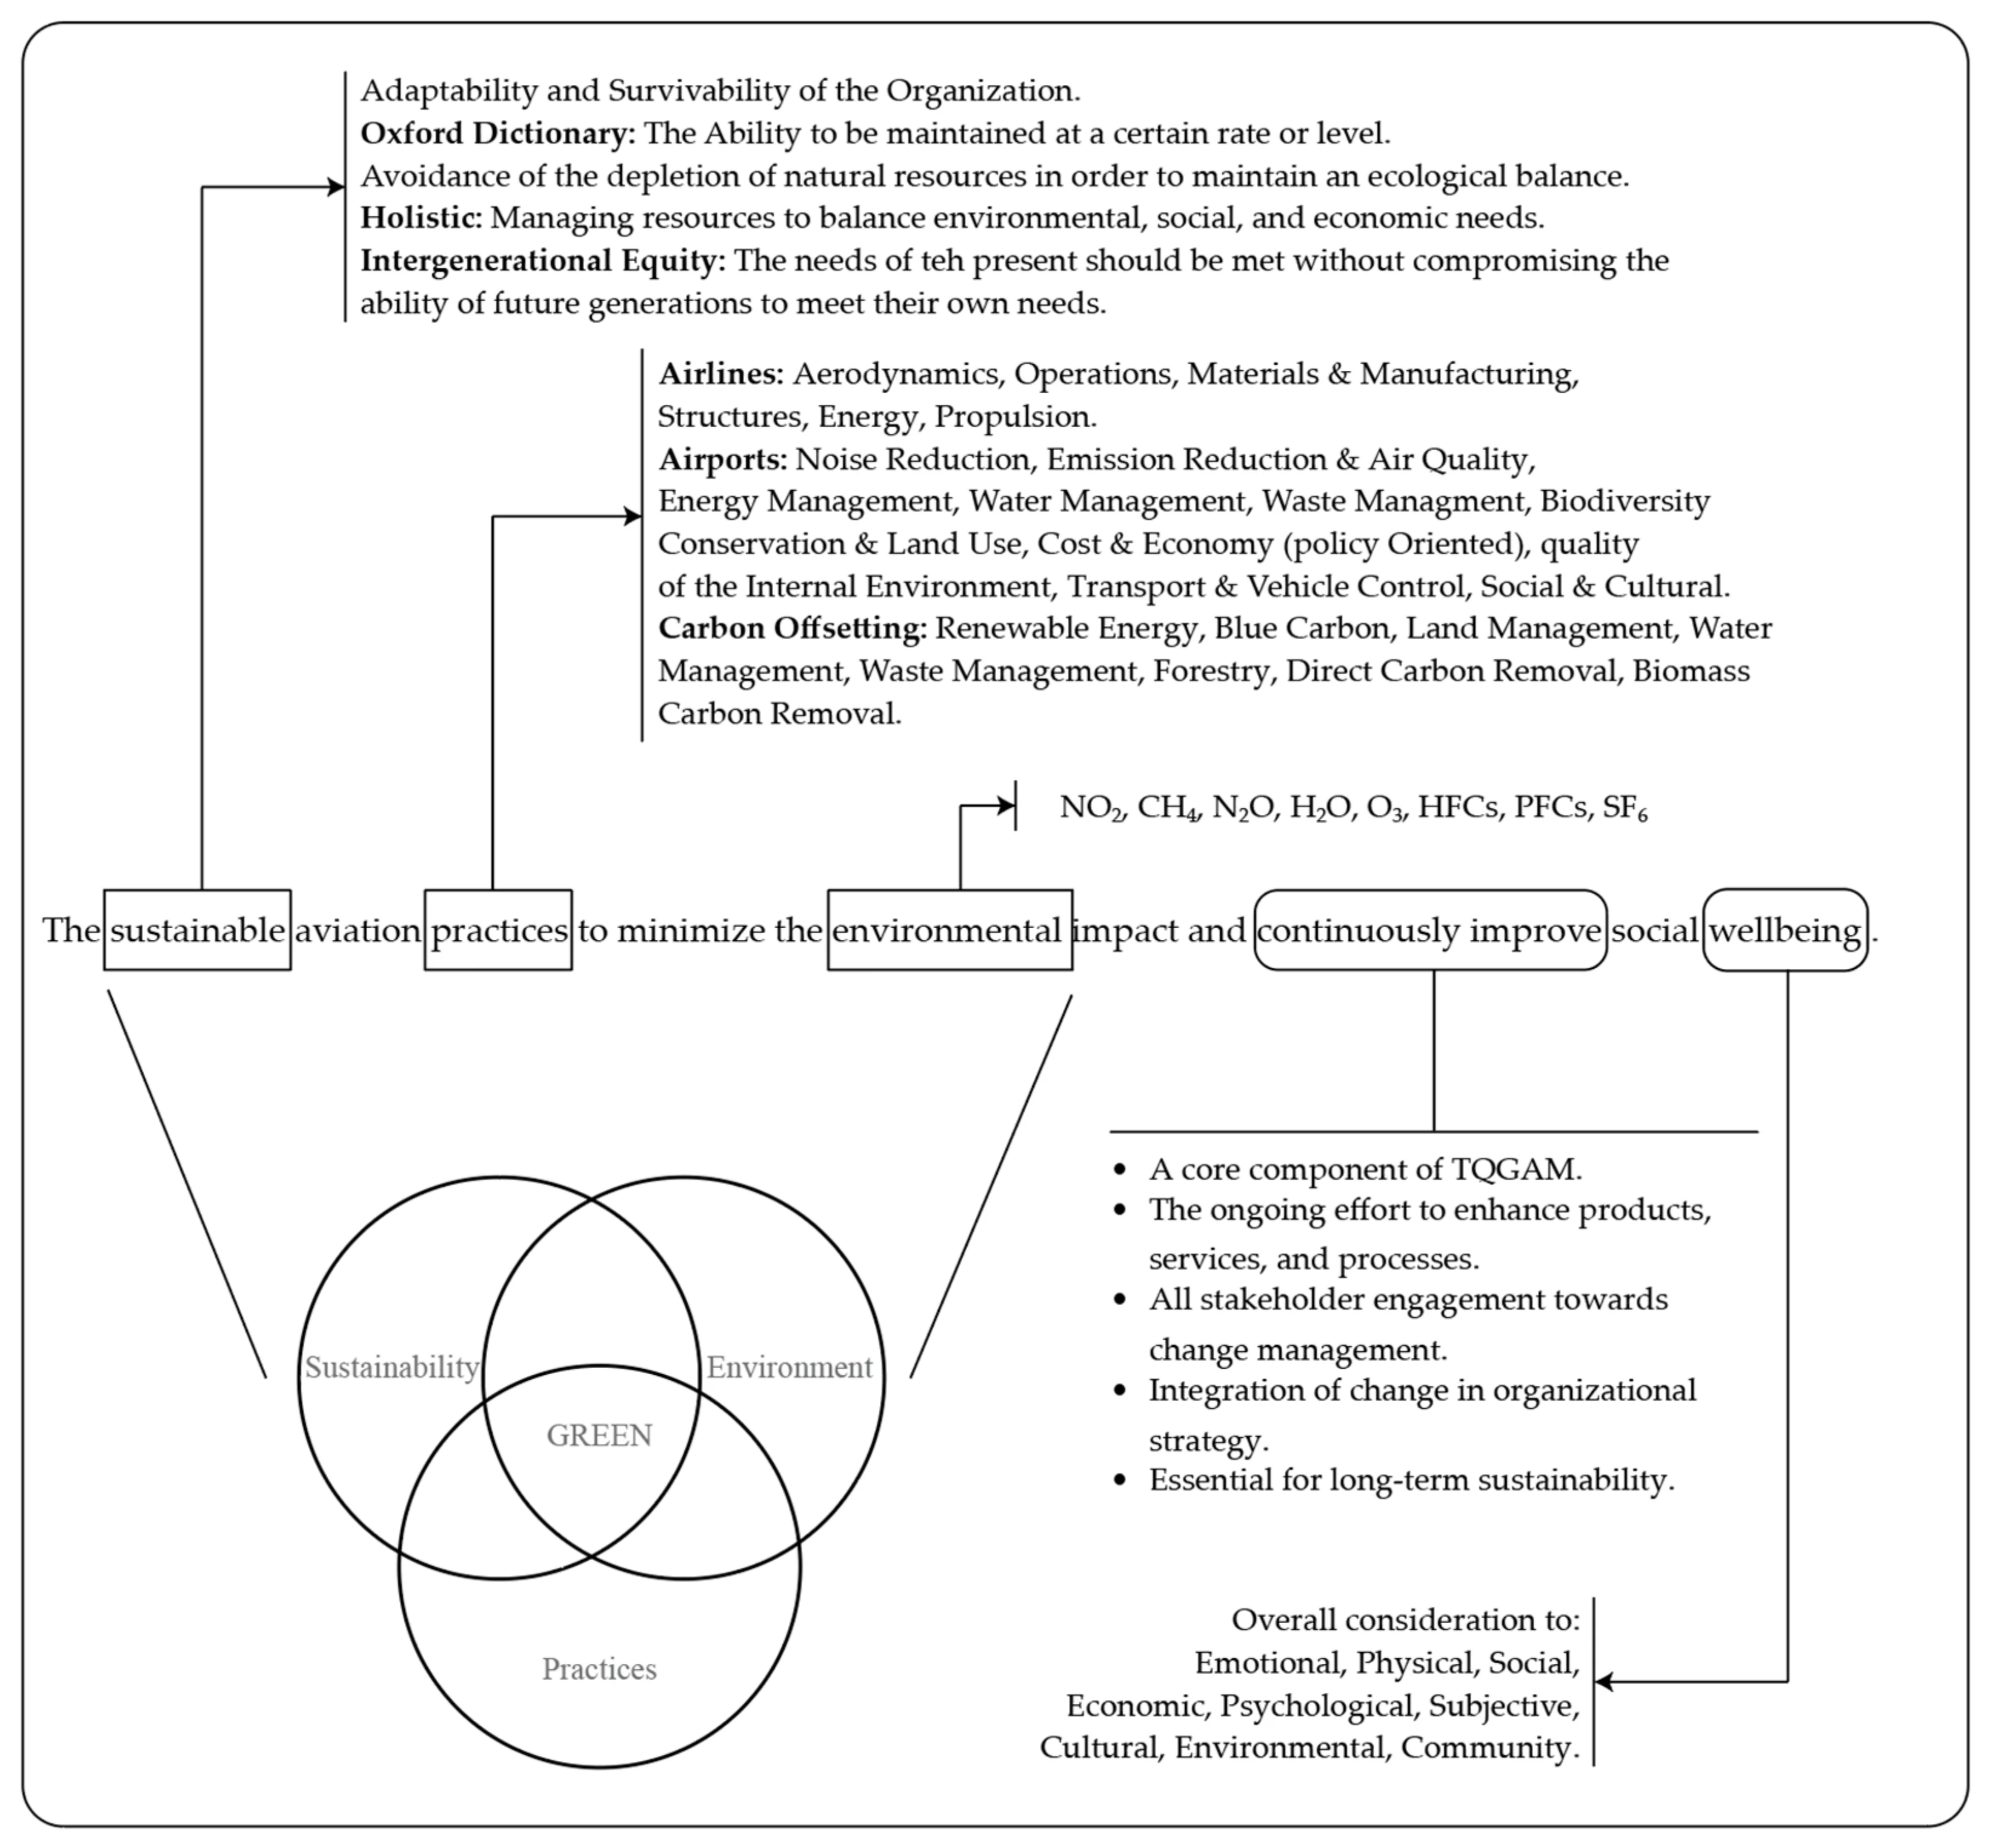
1037. Virtous circle (Strandberg 2015)
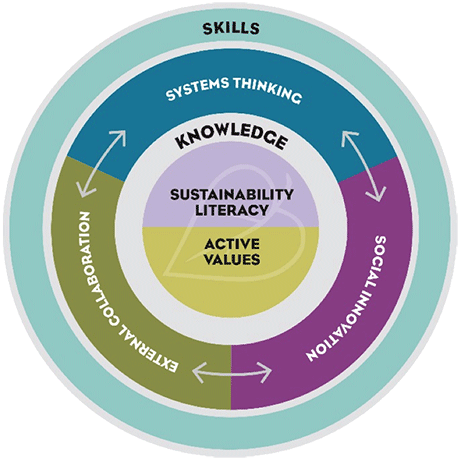
1038. The Greek Good Life (StoicCompass)
THE GOAL OF LIFE, according to most Hellenistic philosophies was to achieve Eudaimonia, meaning a good spirit, a flourishing life, or well-being. Zeno, the founder of the Stoa, defined it as a good flow of life, a life lived in accordance with Nature.
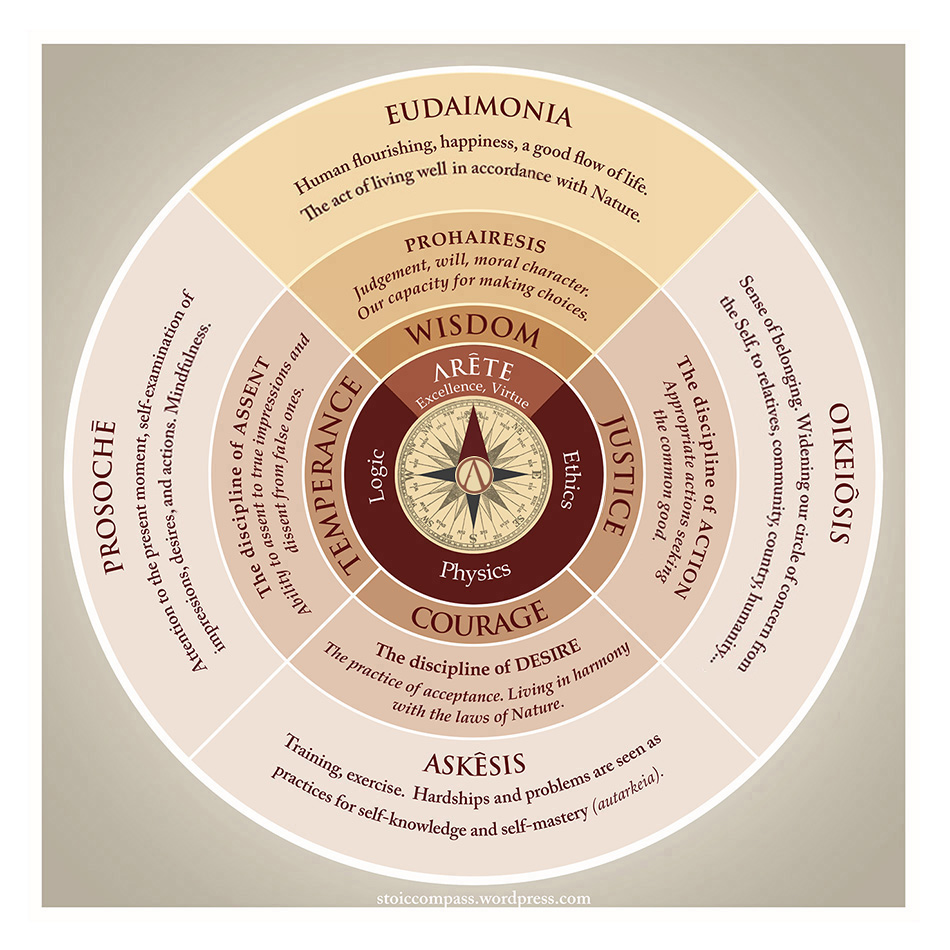
1039. Industrial sufficiency (Schmidhäuser et al. 2024)
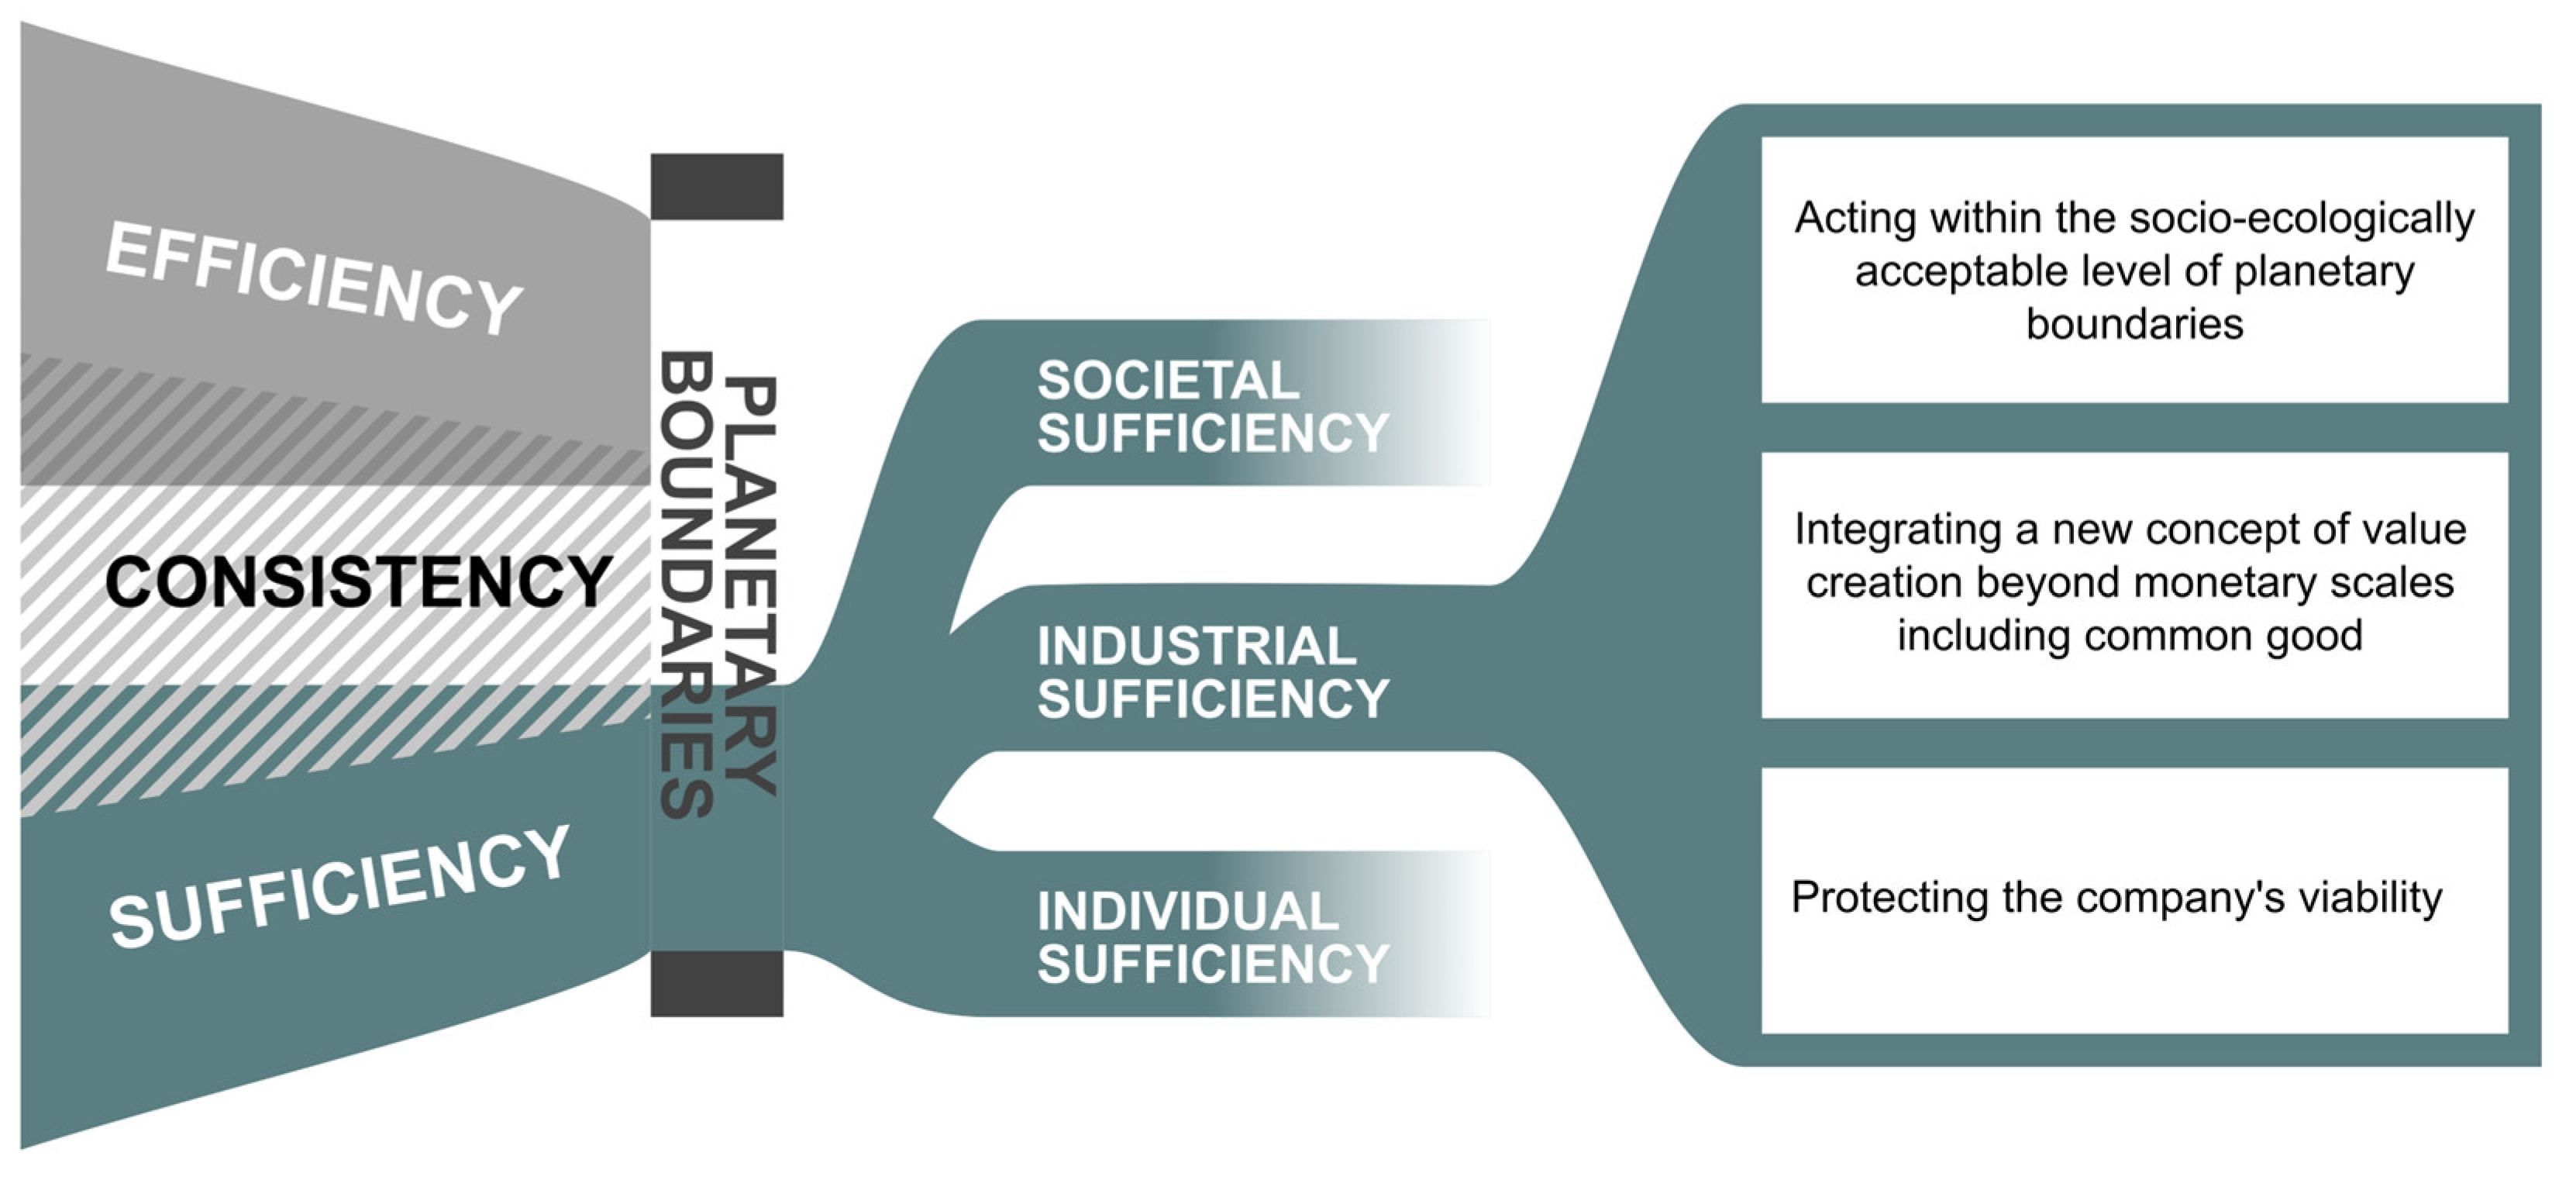
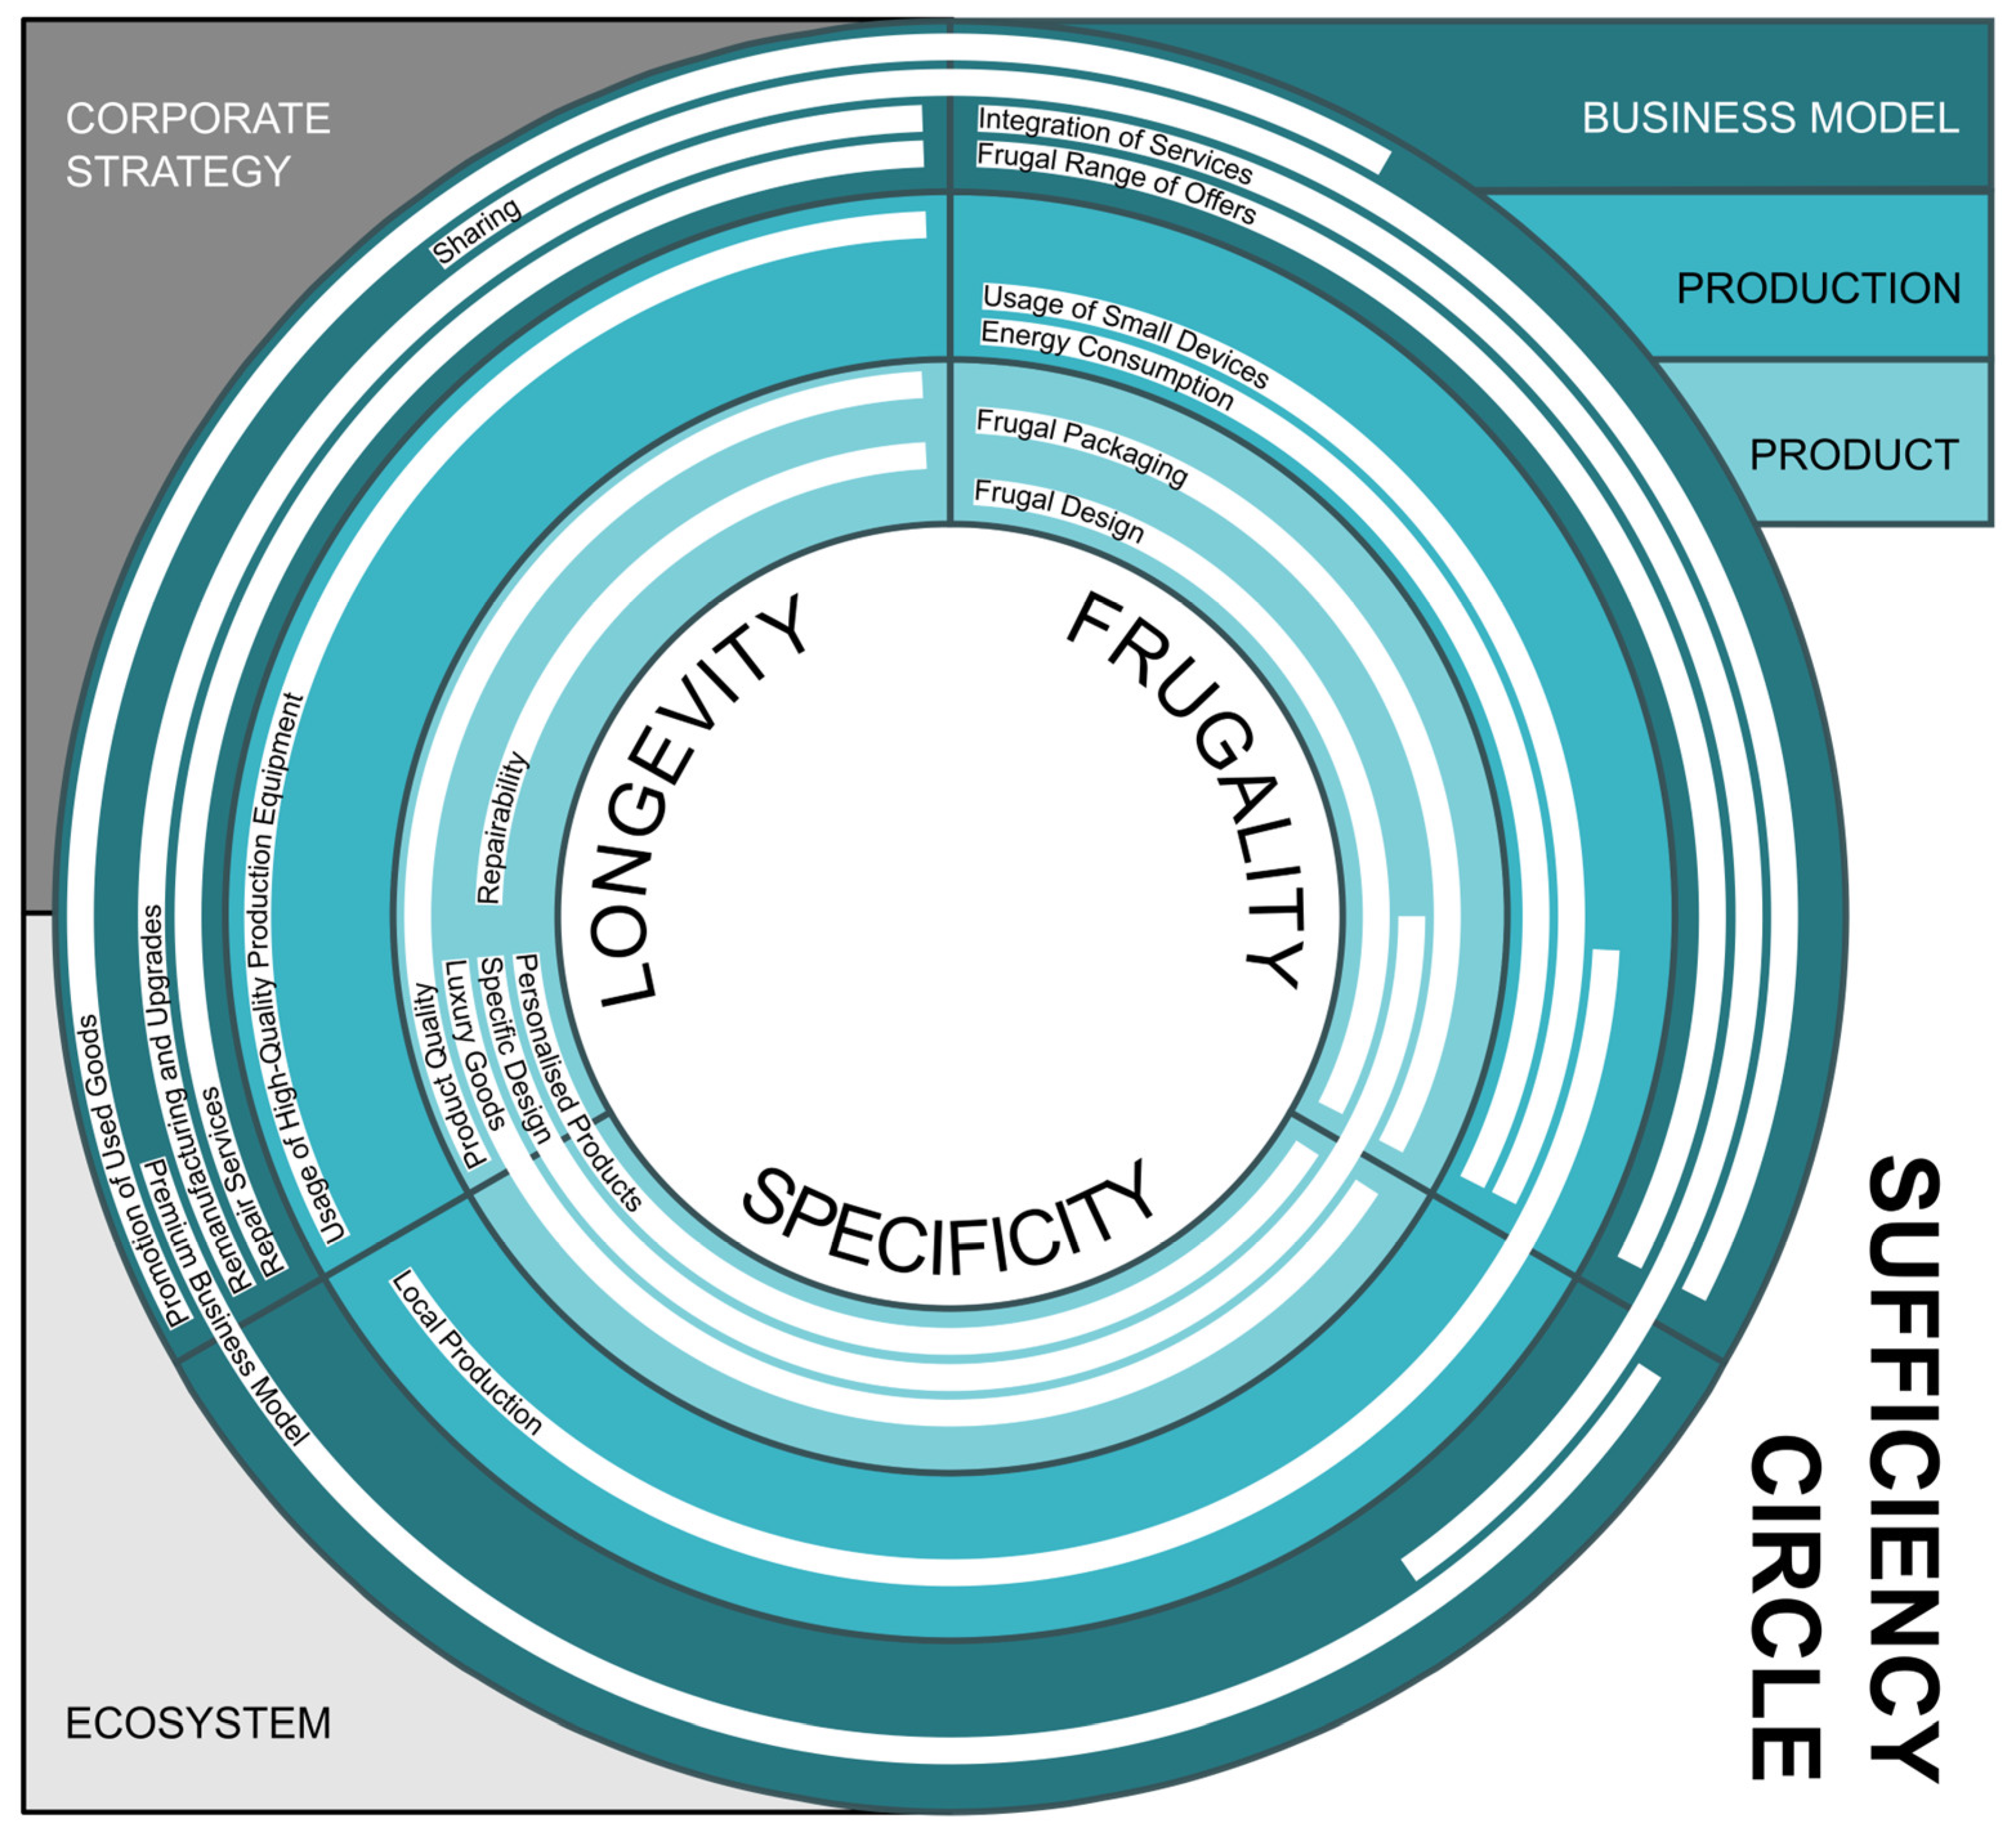
1040. Mangrove (again but different) ( Baur et al., 2025)
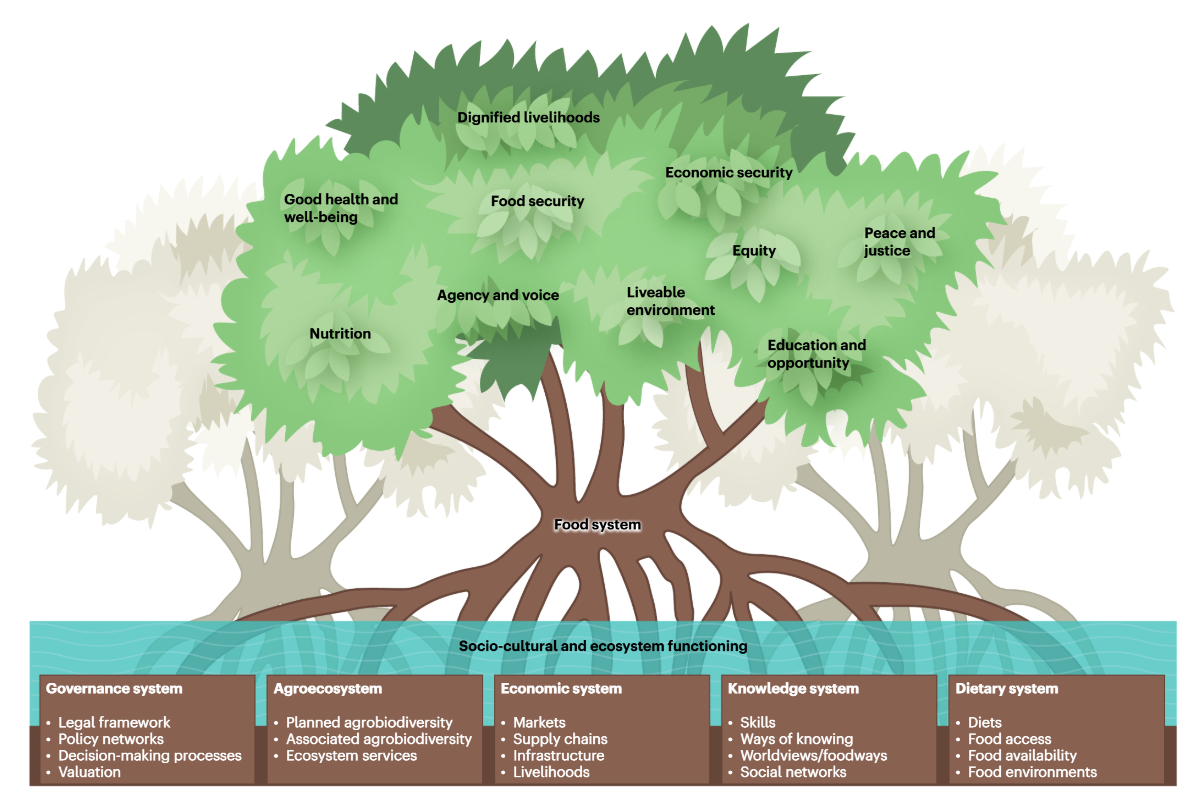
Mangels made another version for the university website:
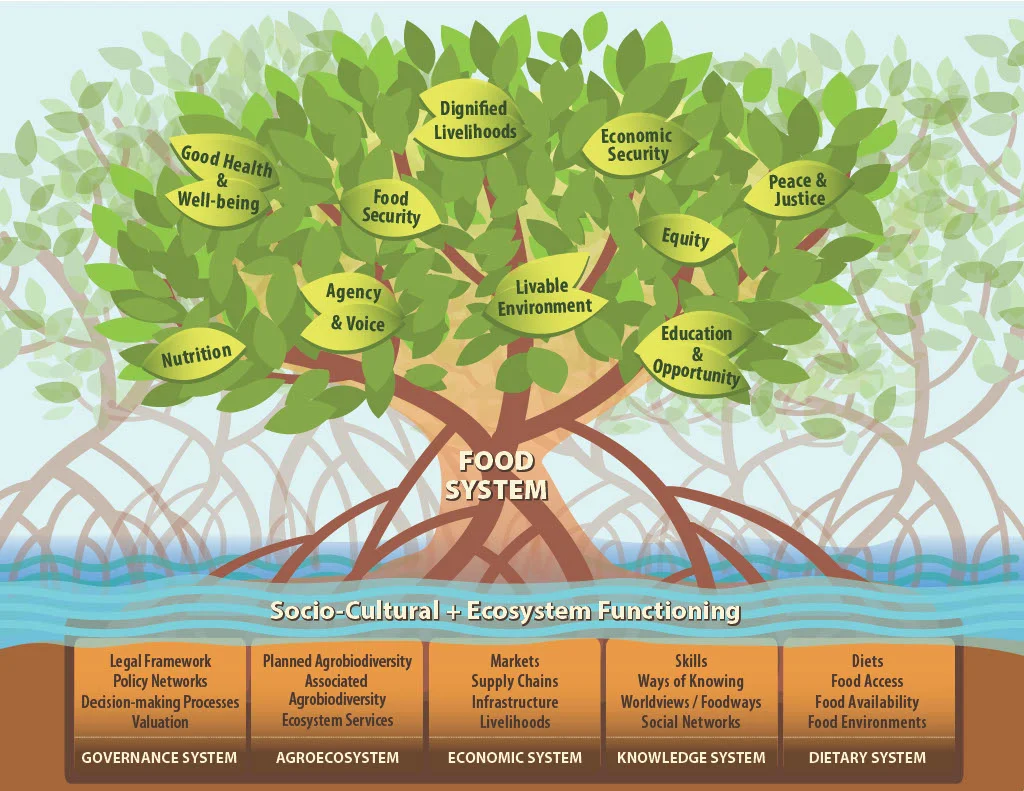
Its based on this mangrove-trunk as a model of the food system. (My botanist spidey senses are twitching, but I’ll try and let it go).
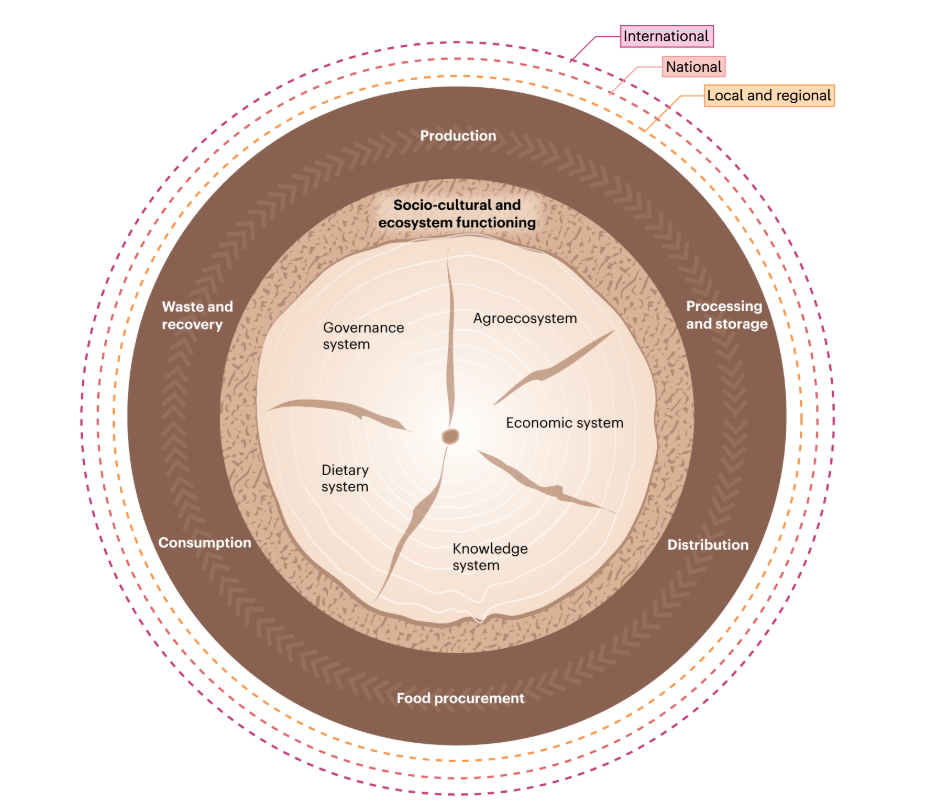
1041. Growing Tree (Rathwell et al., 2025)
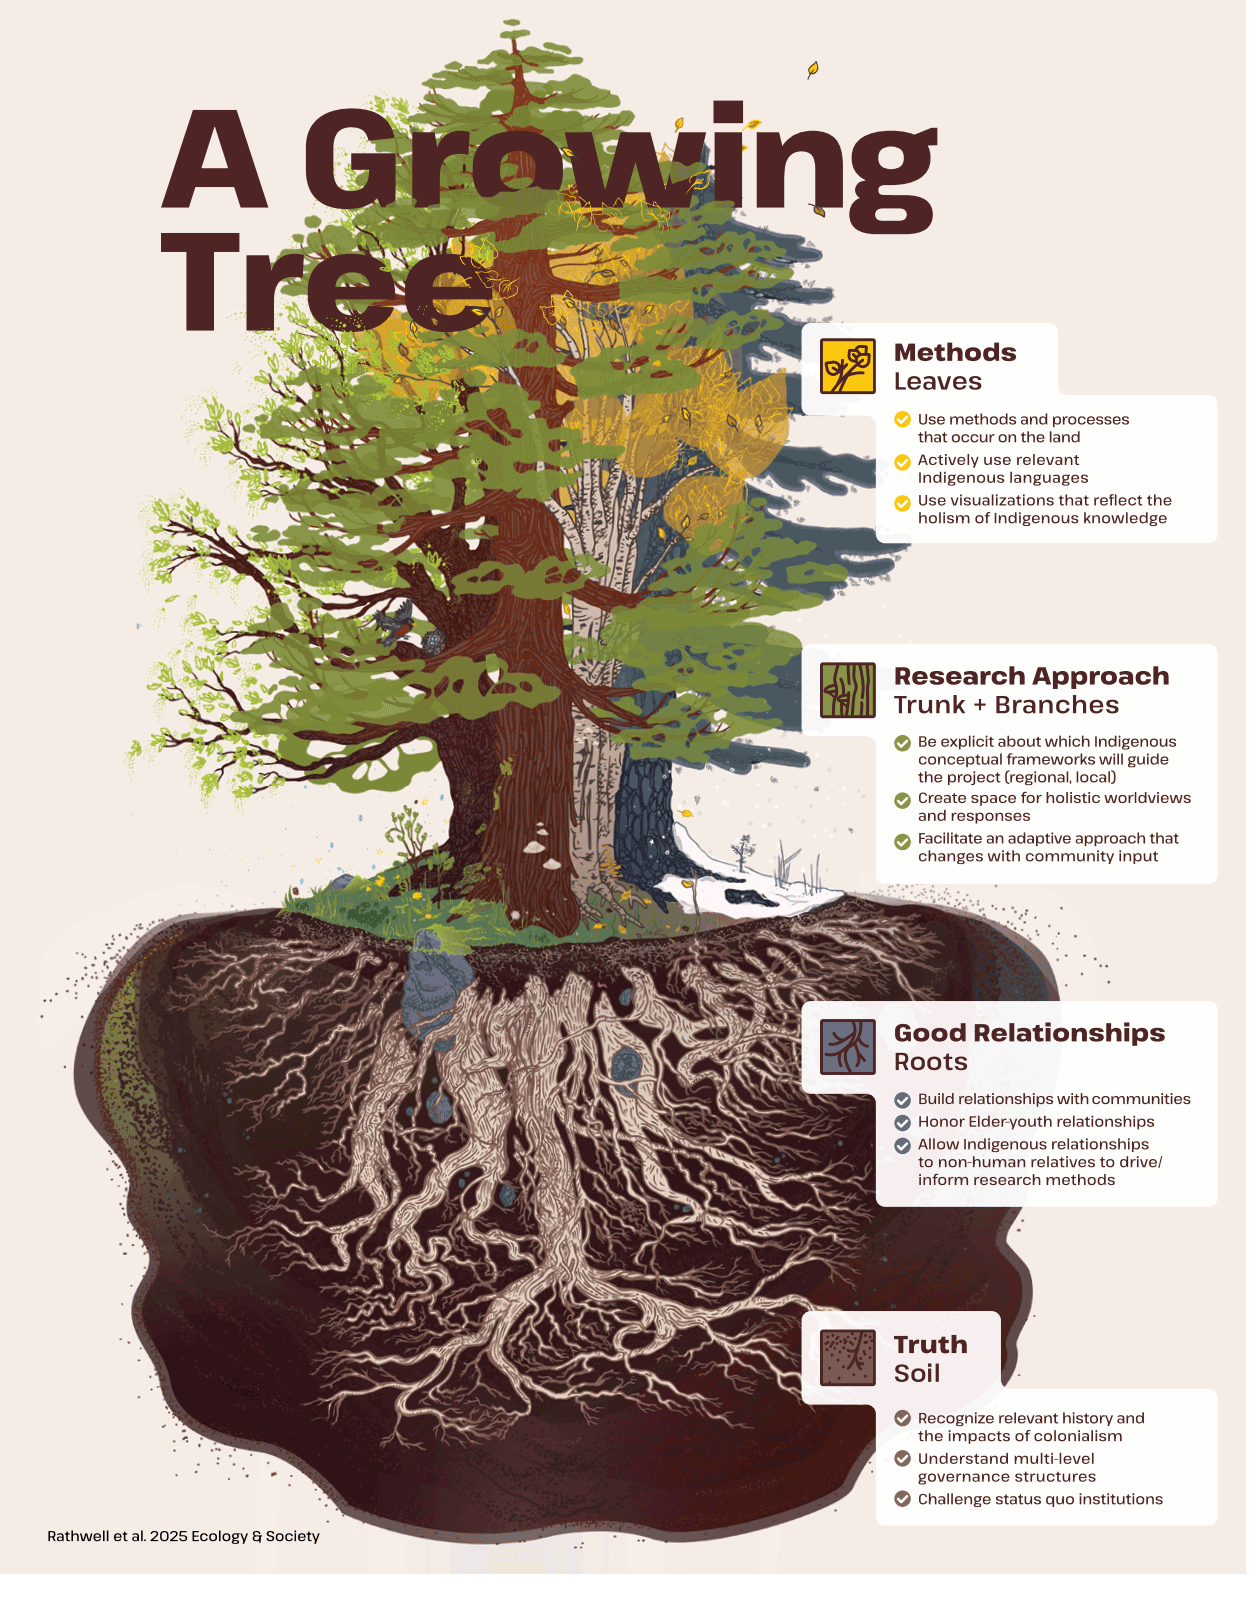
1042. Emerging from a pile of ecosystem services and local culture (Yang and Sato 2025)
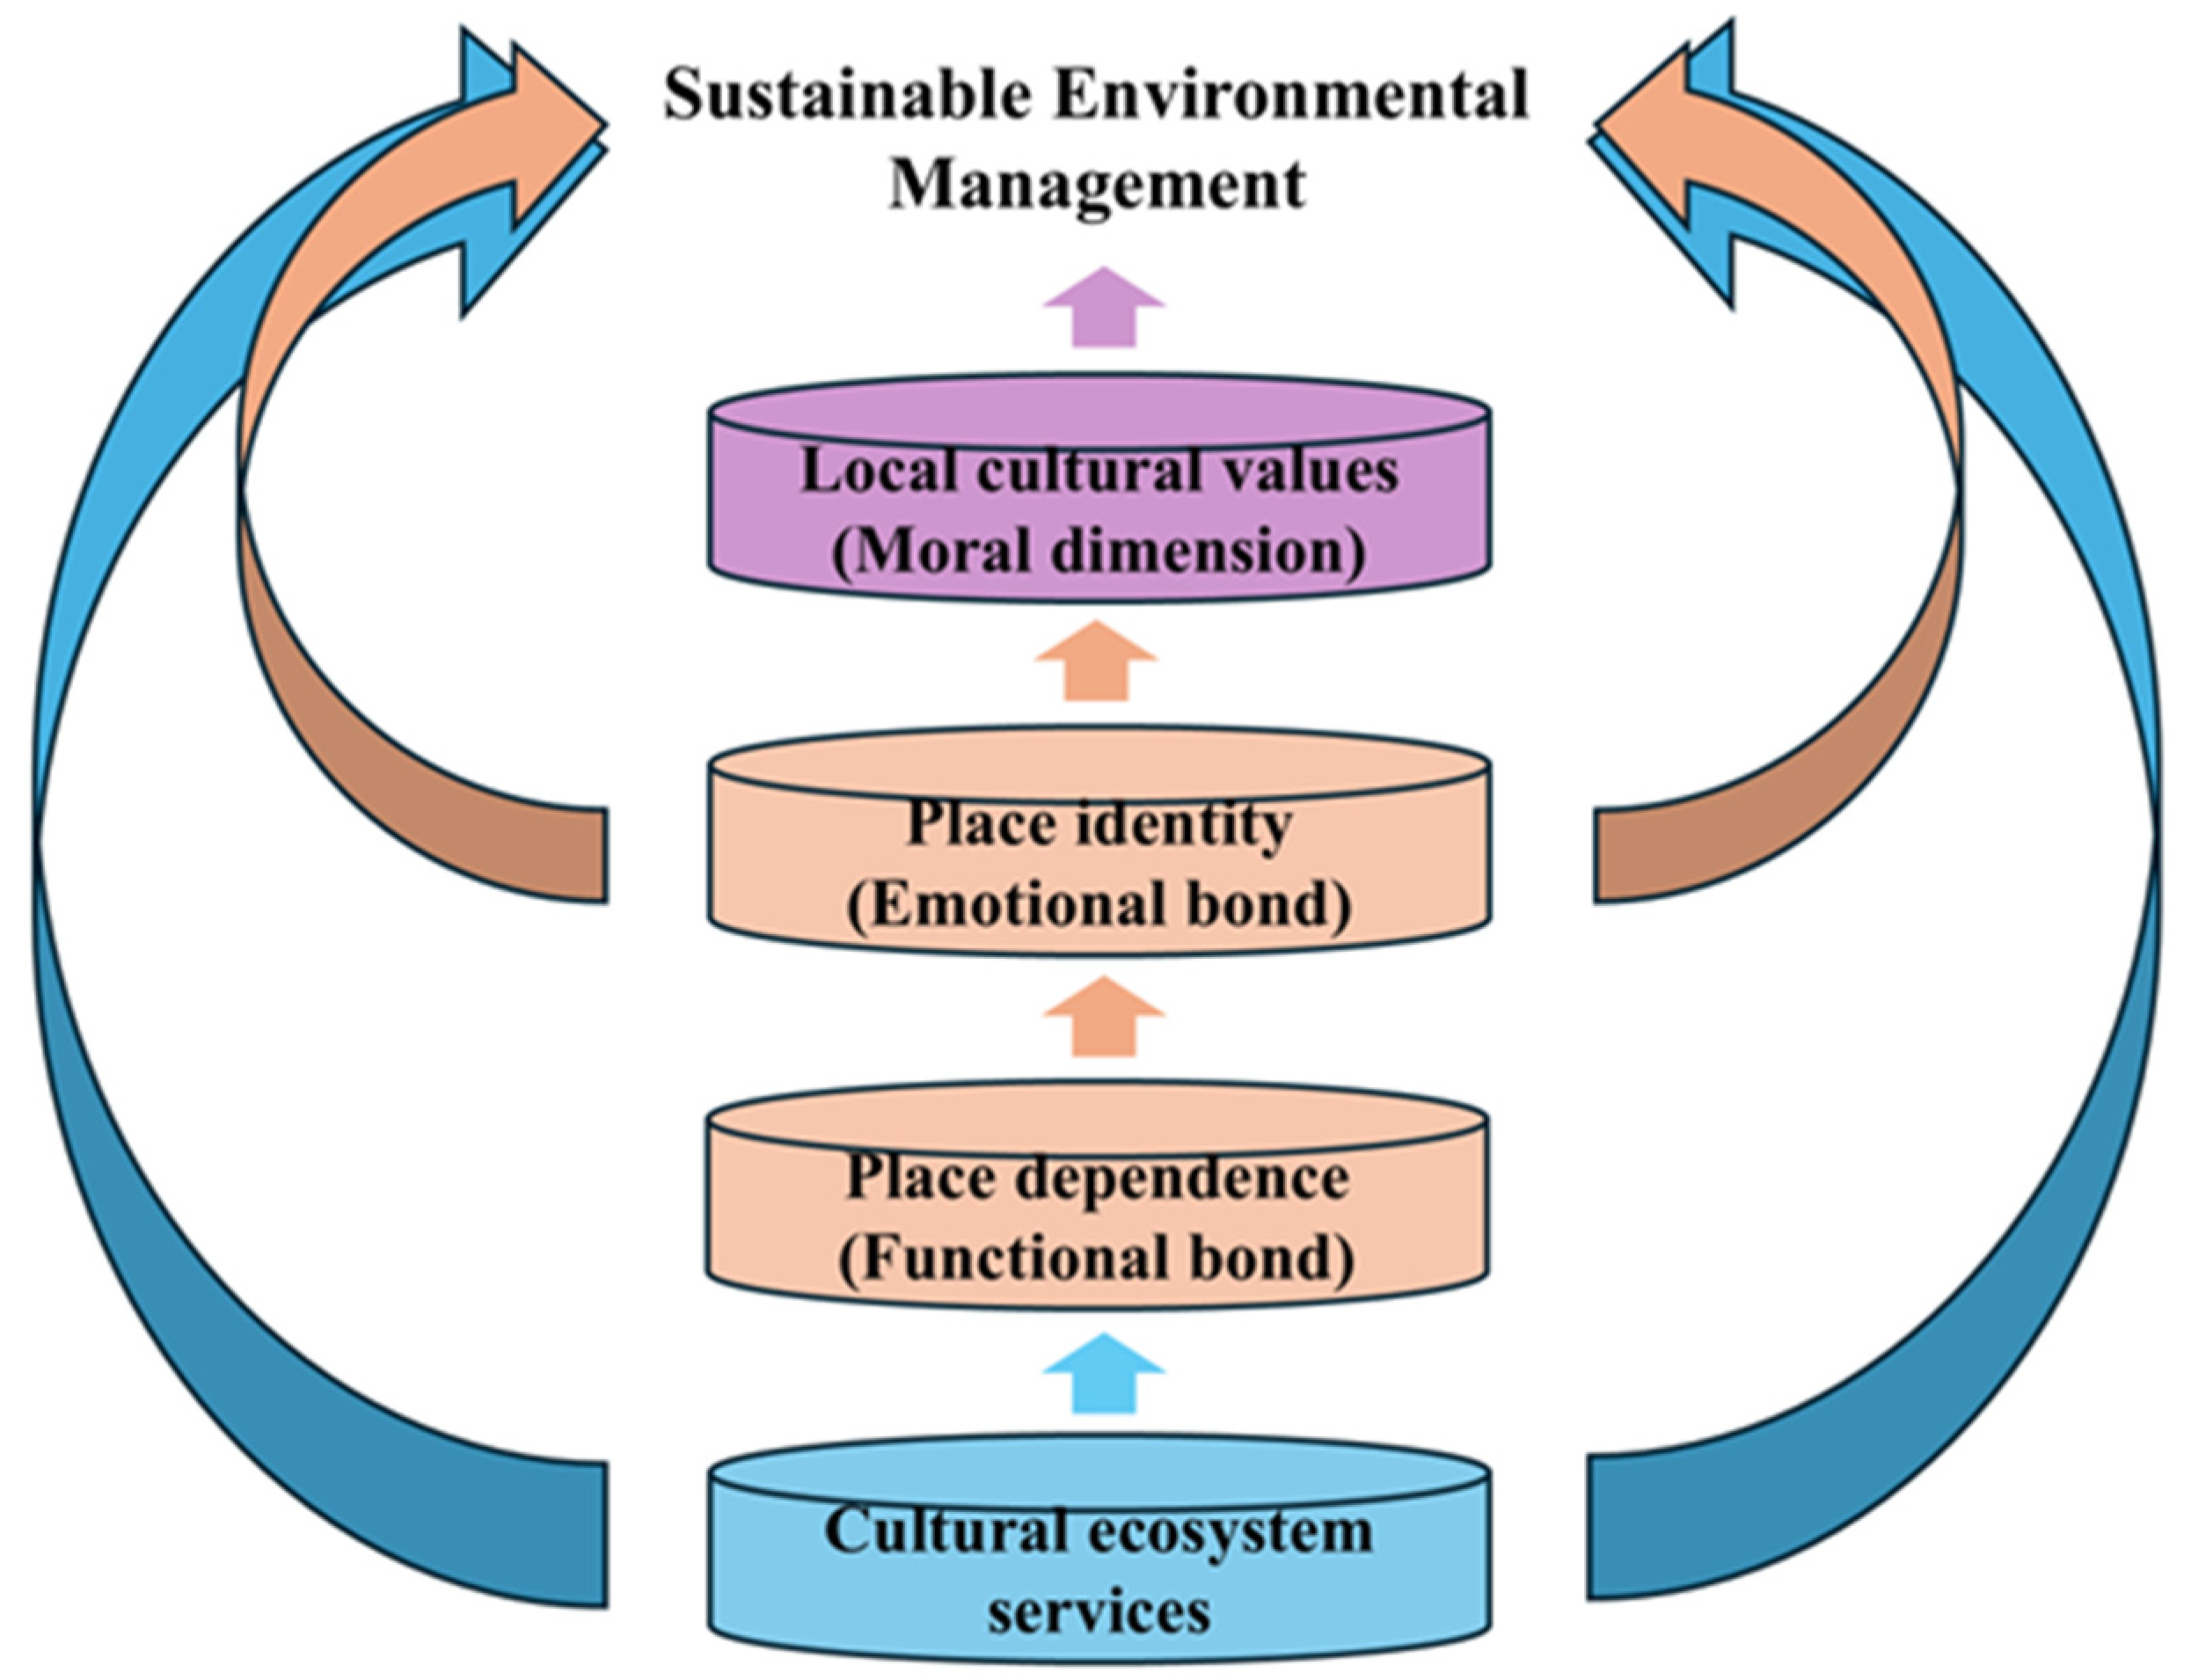
1043. Authentic leadership (Akinwalere et al., 2025).
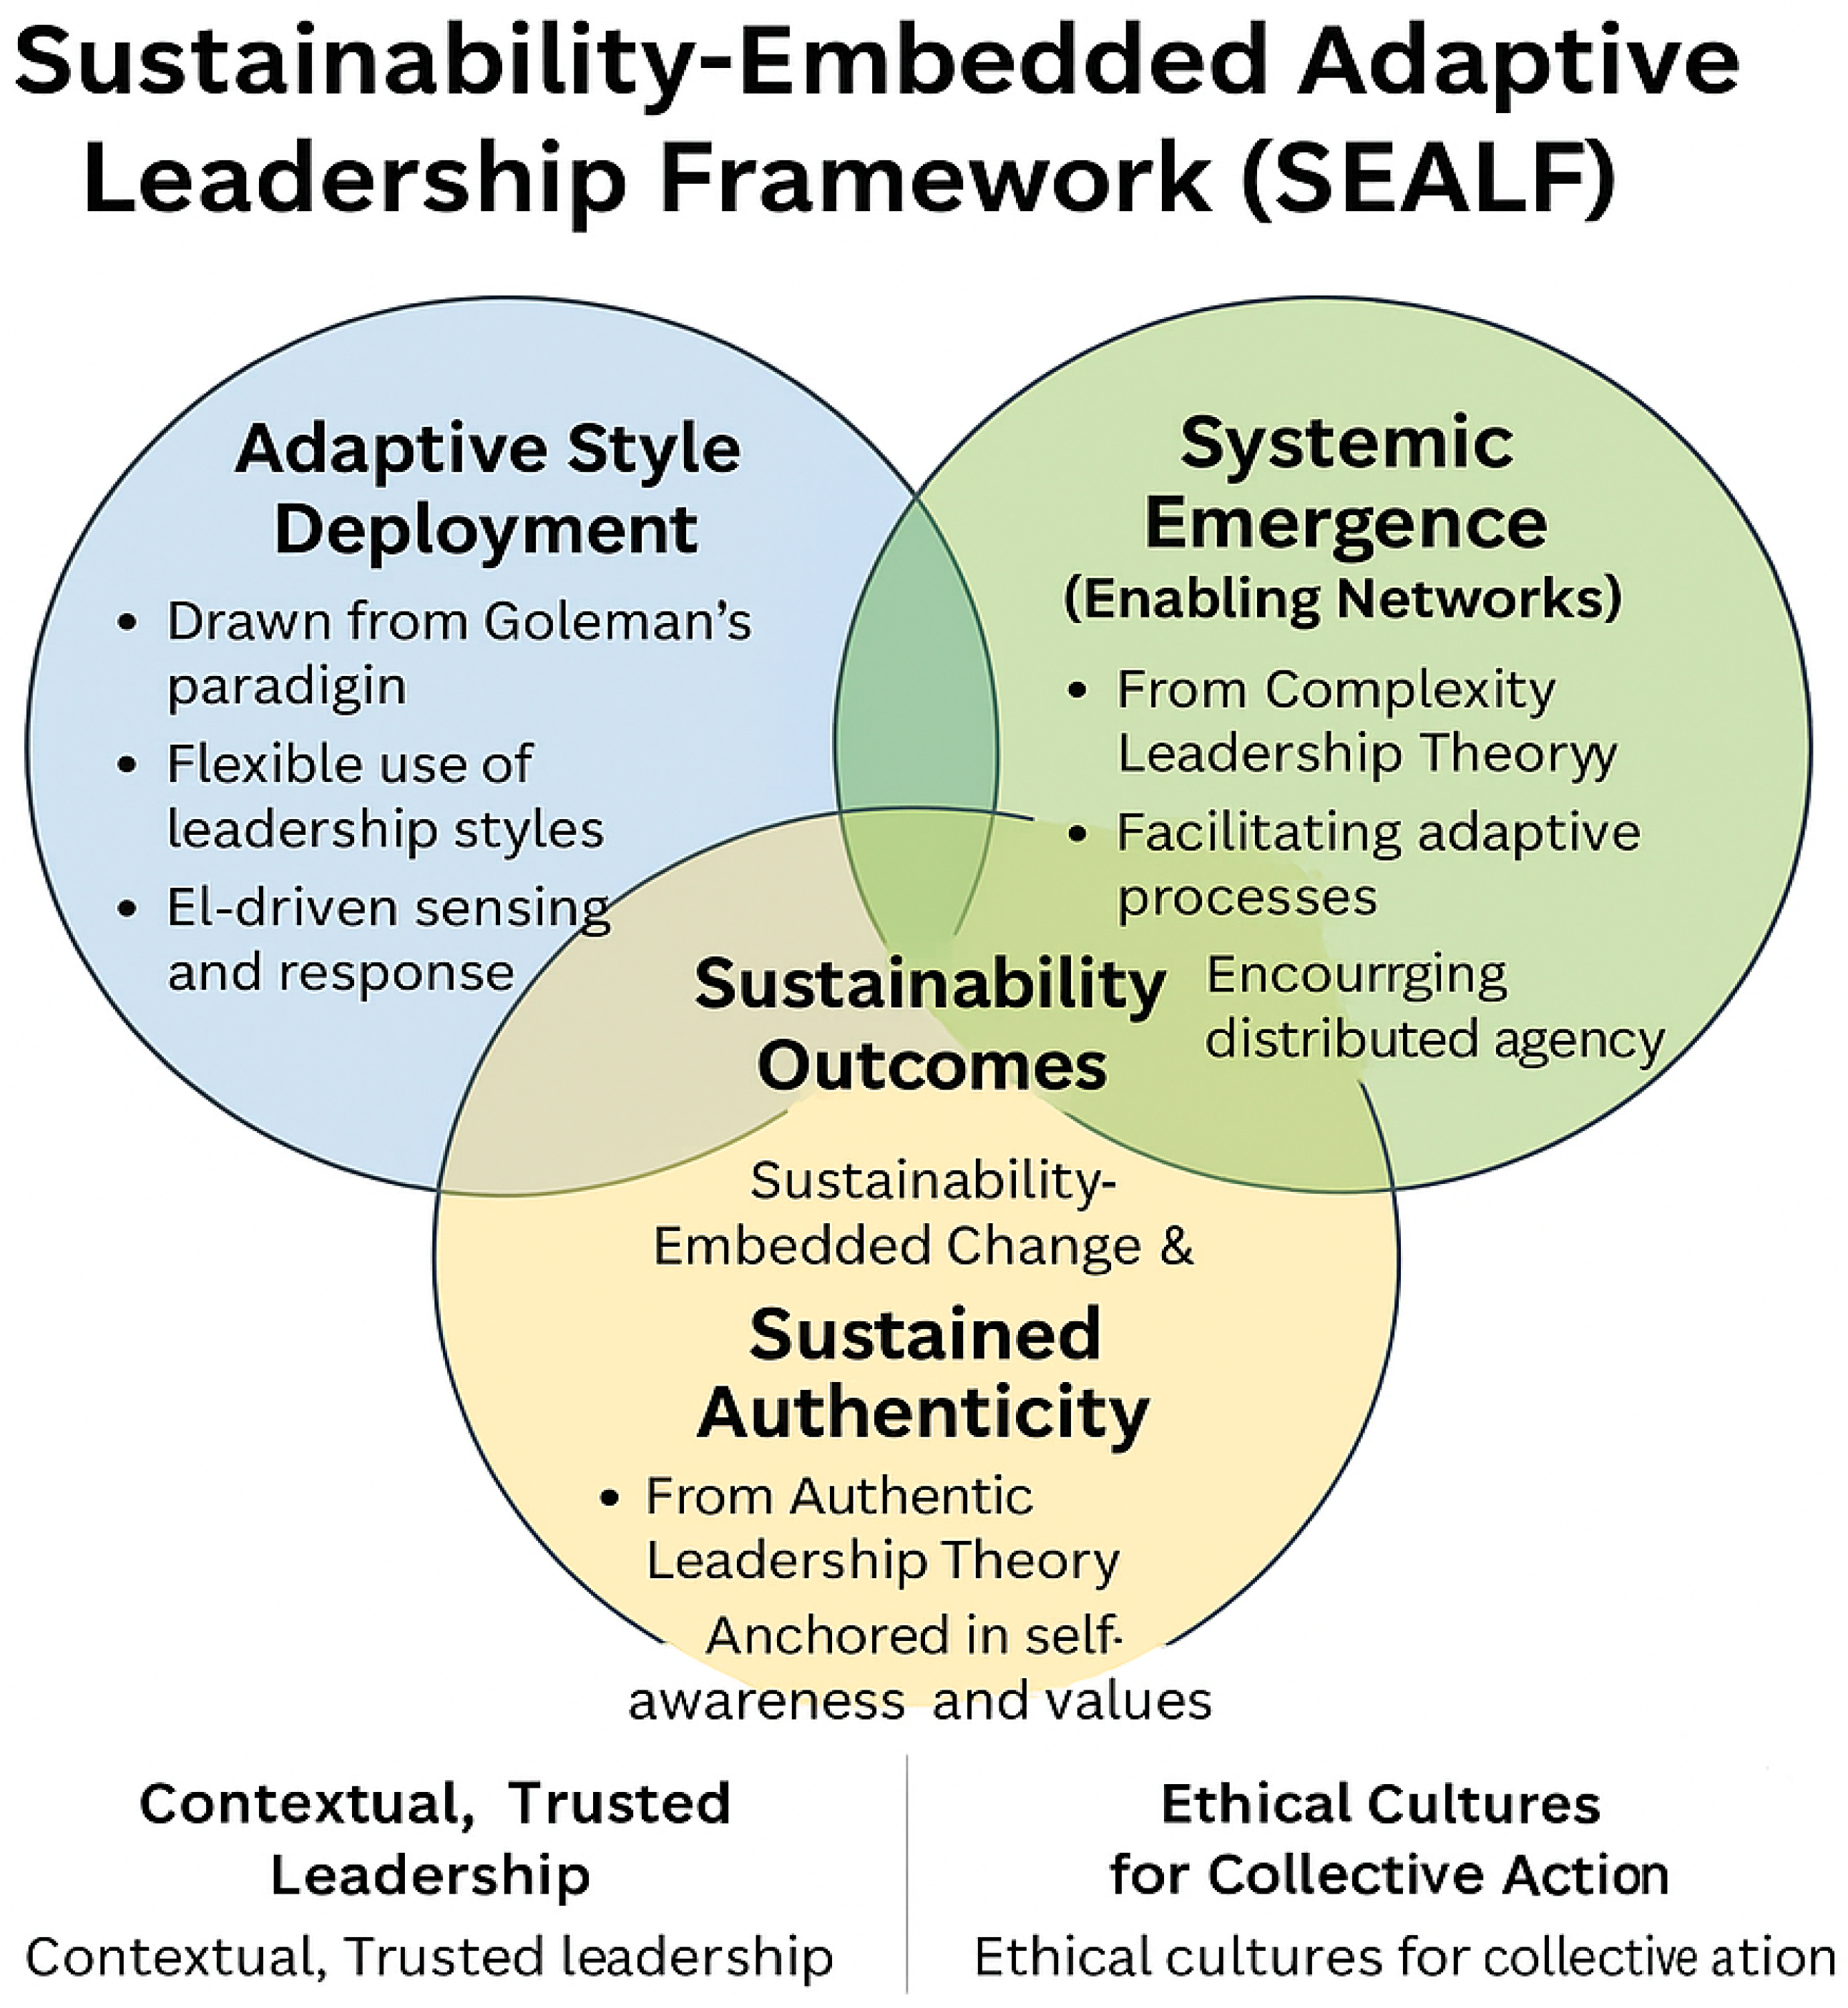
1044. Opt, Sus, Safe (Barfuss al., 2018)
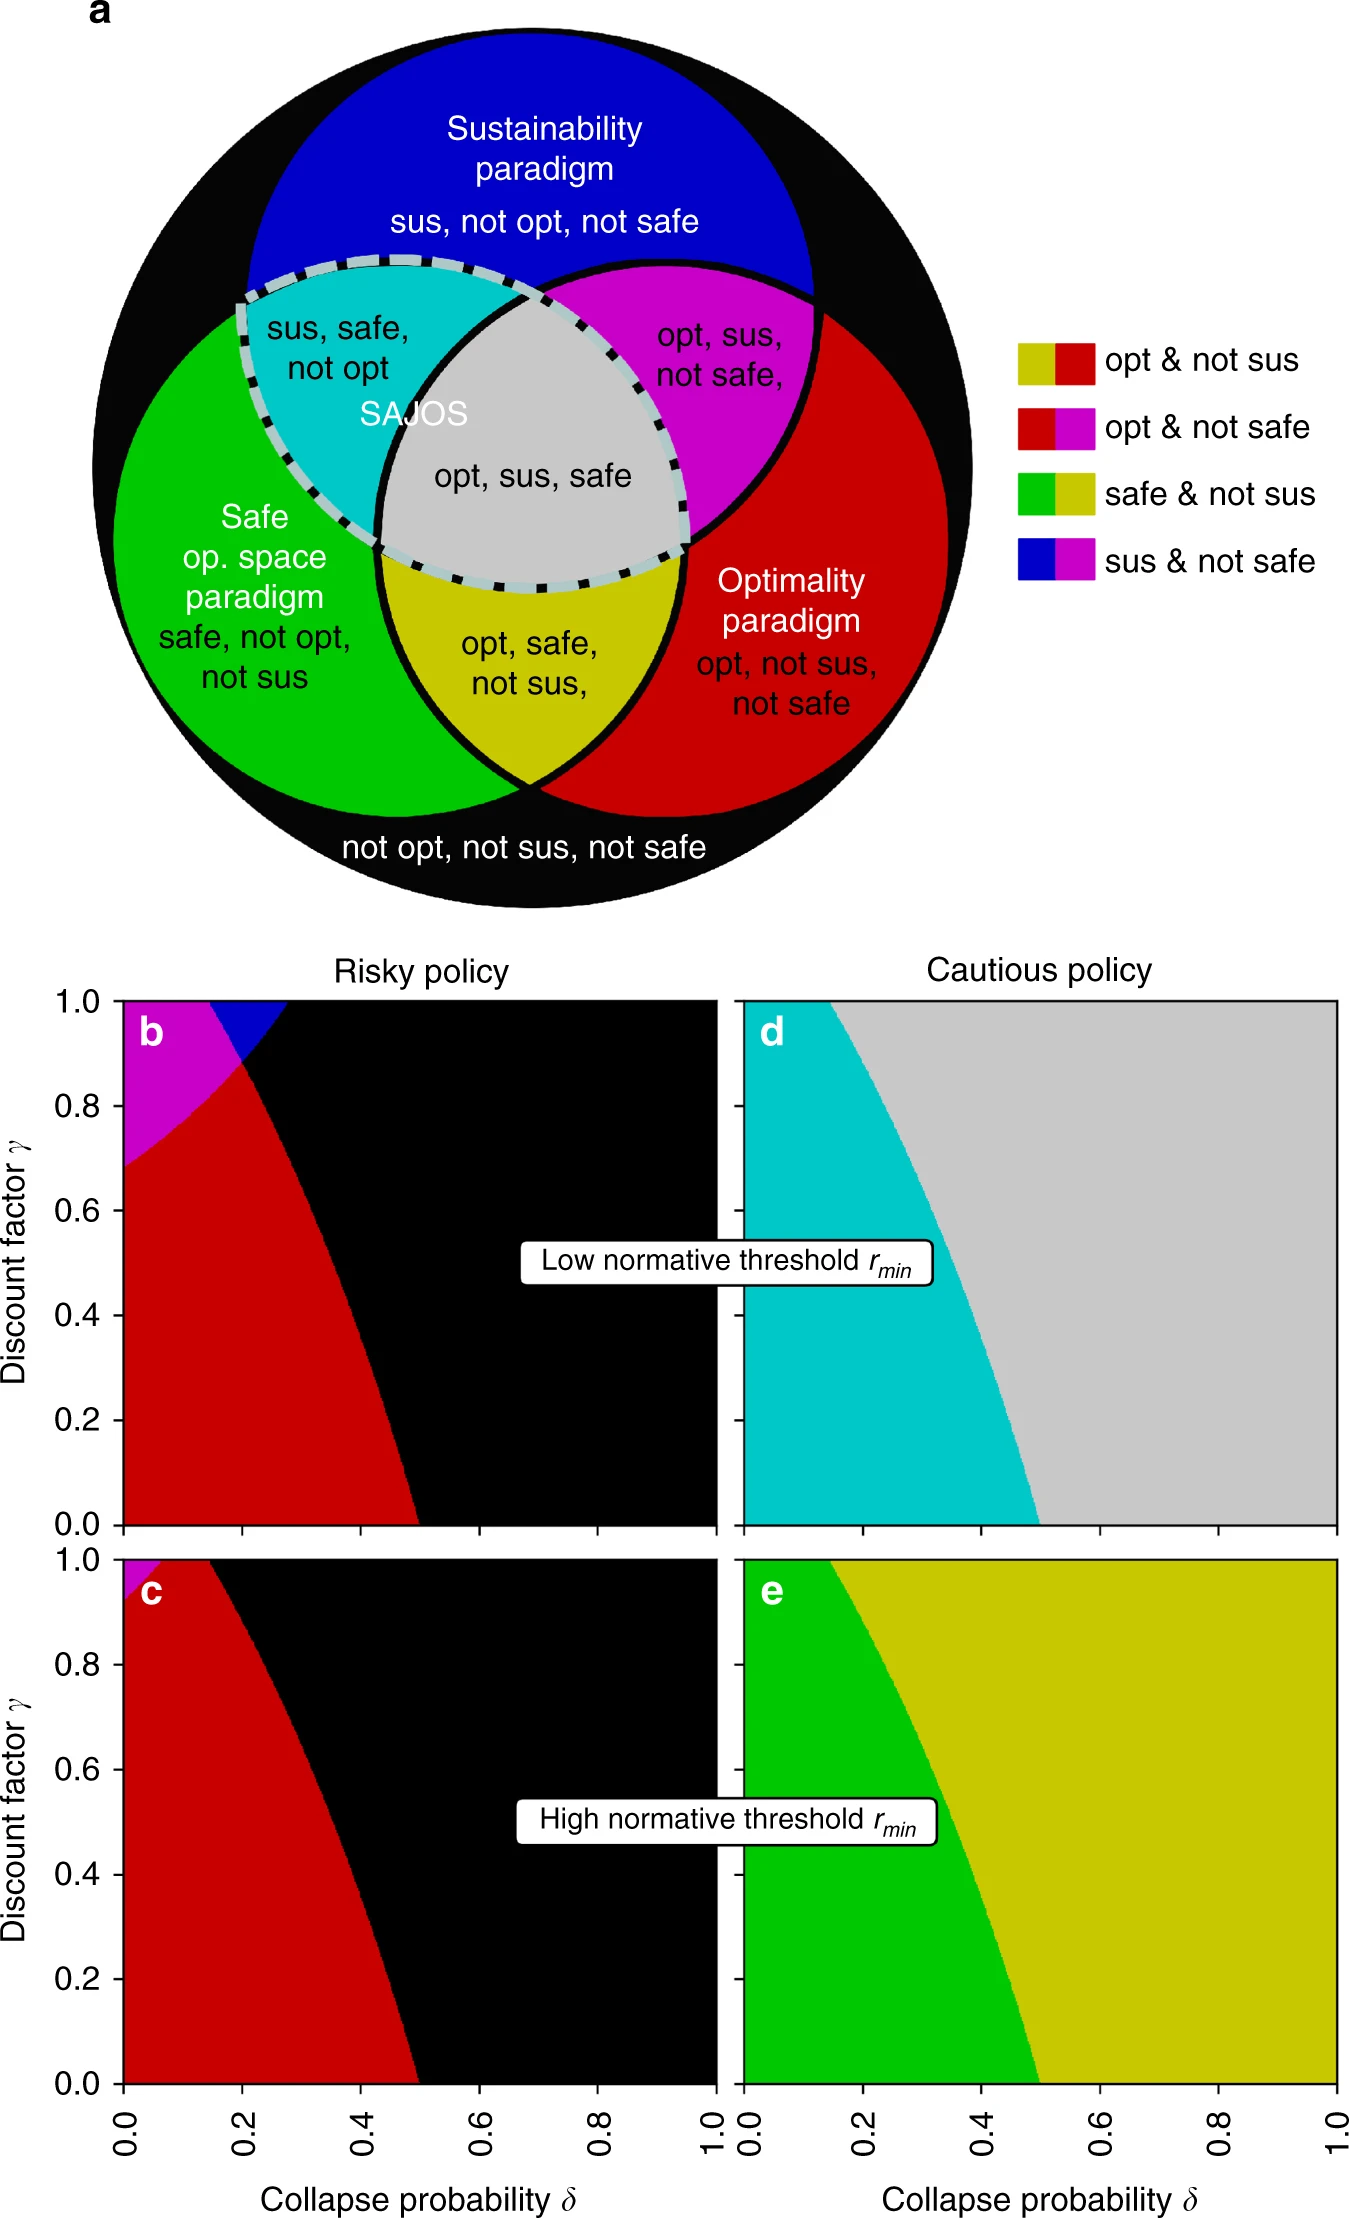
1045. Three basins (Anderies et al., 2022) (“A” in this figure is the same as #410)
Humanity now faces critical decisions about navigating to the left (and how abruptly) or to the right.
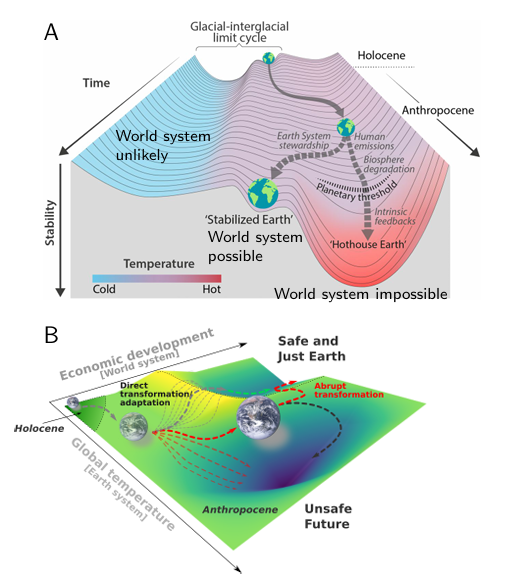
1046. Pillars, but as dimensions with interactions. (Fazle 2025)
Integrated Sustainability Model (ISM) illustrating the dynamic interactions among economic (E), social (S), and environmental (Env) dimensions. Note: The inner ring denotes adaptive capacity drivers (policy coherence, stakeholder engagement, technological innovation, and resilience), while the new outer ring highlights the four core principles of the Synergistic Resilience Theory (Mutual Reinforcement, Adaptive Capacity, Co-evolution, and Contextual Integration). Red arcs represent planetary and social boundary constraints.
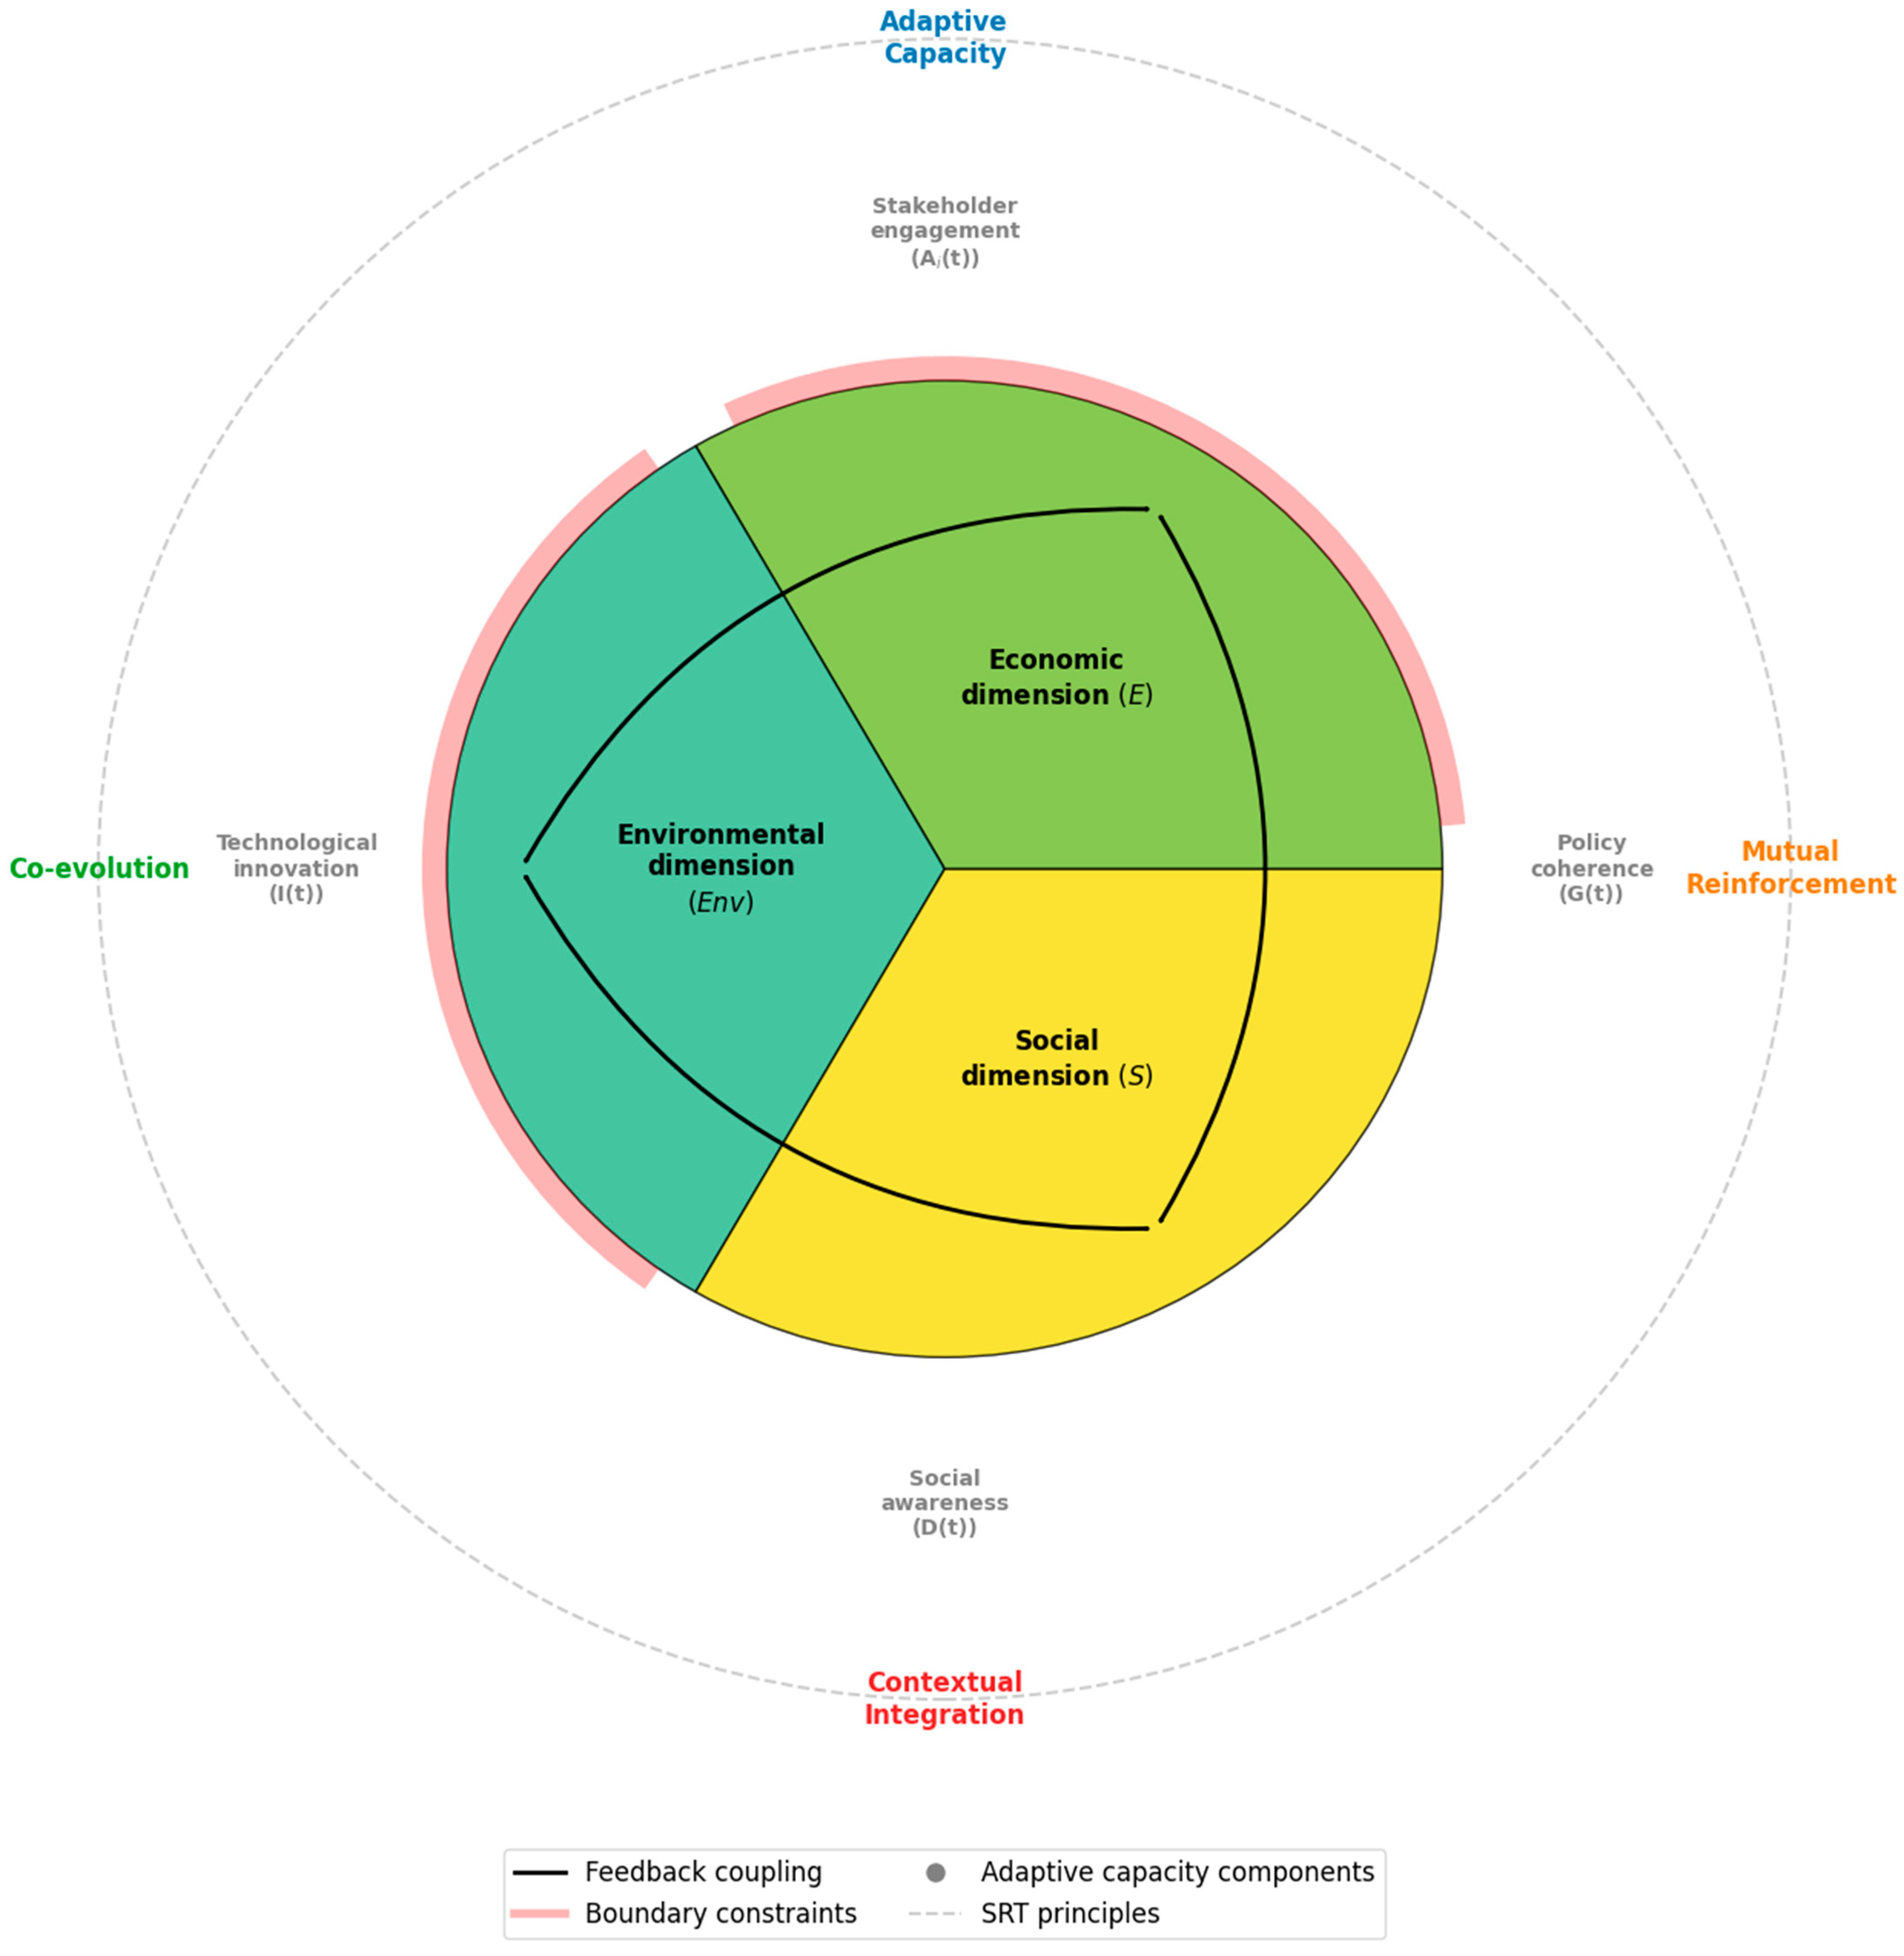
1047. Taoist-Inspired Multidimensional Framework for Sustainability Transitions (Liang and Segalas, 2025)
(Three in a row because there is too much for one item)
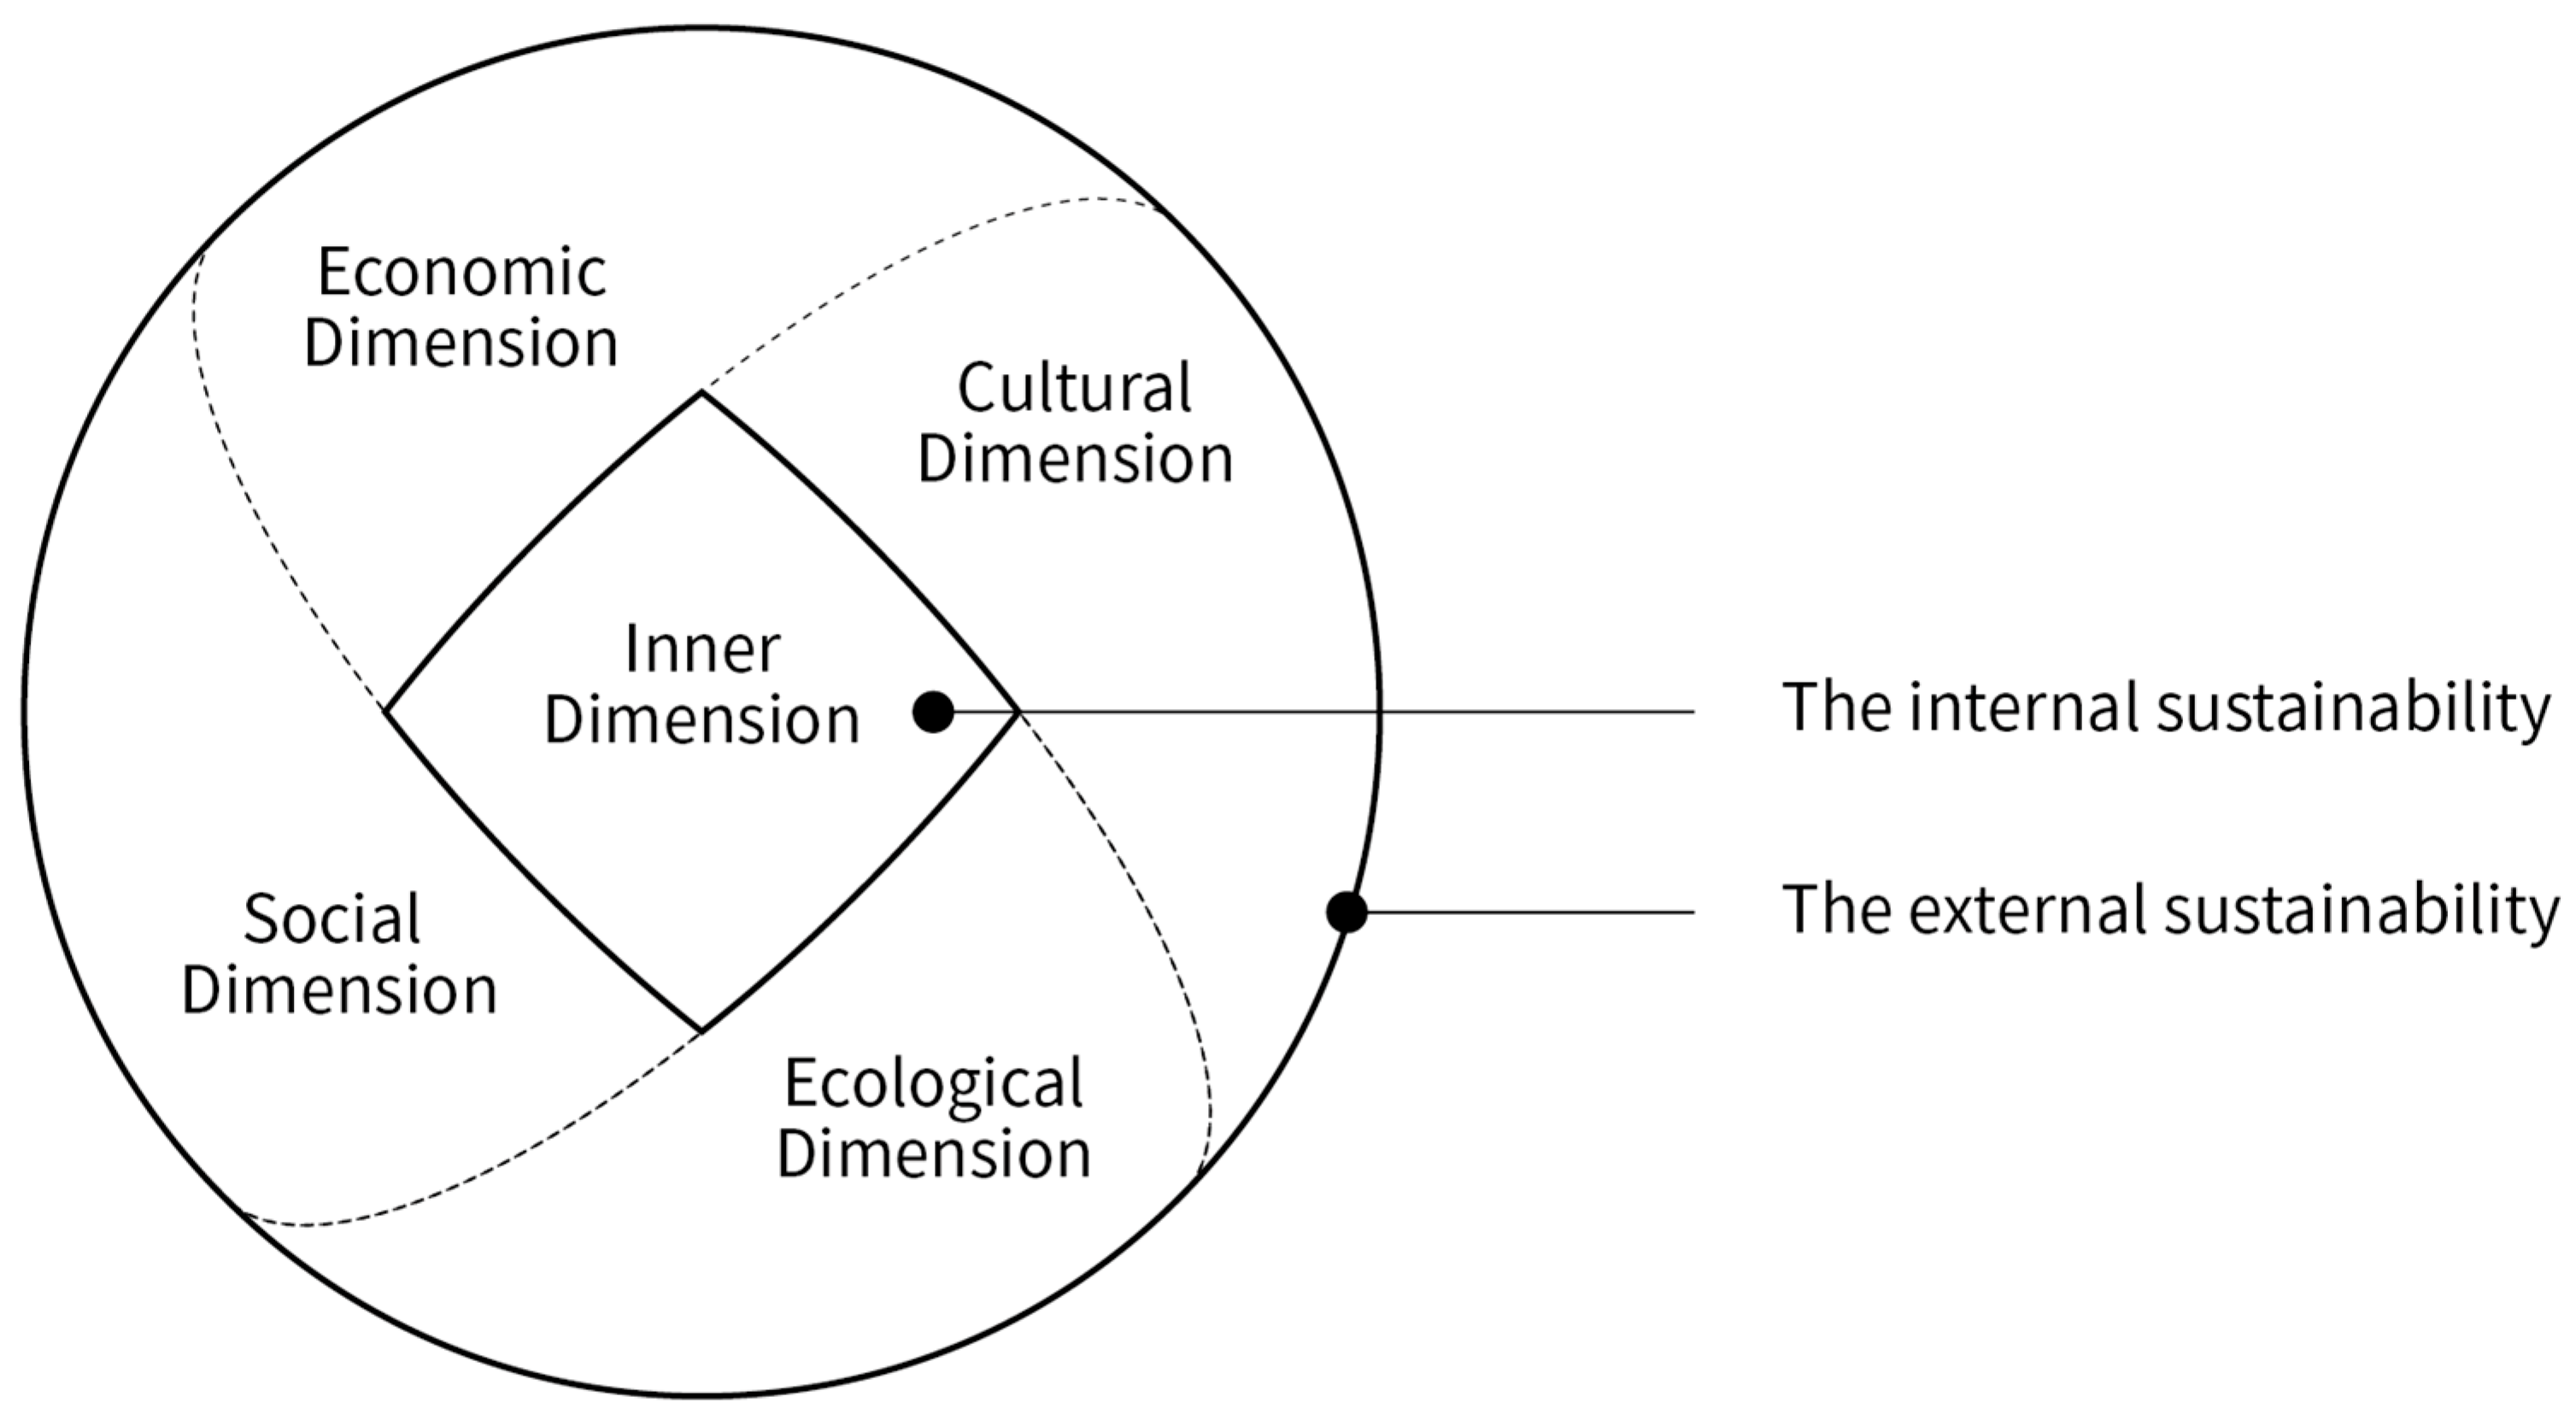
1048. Deep and Shallow Interventions (Liang and Segalas, 2025)
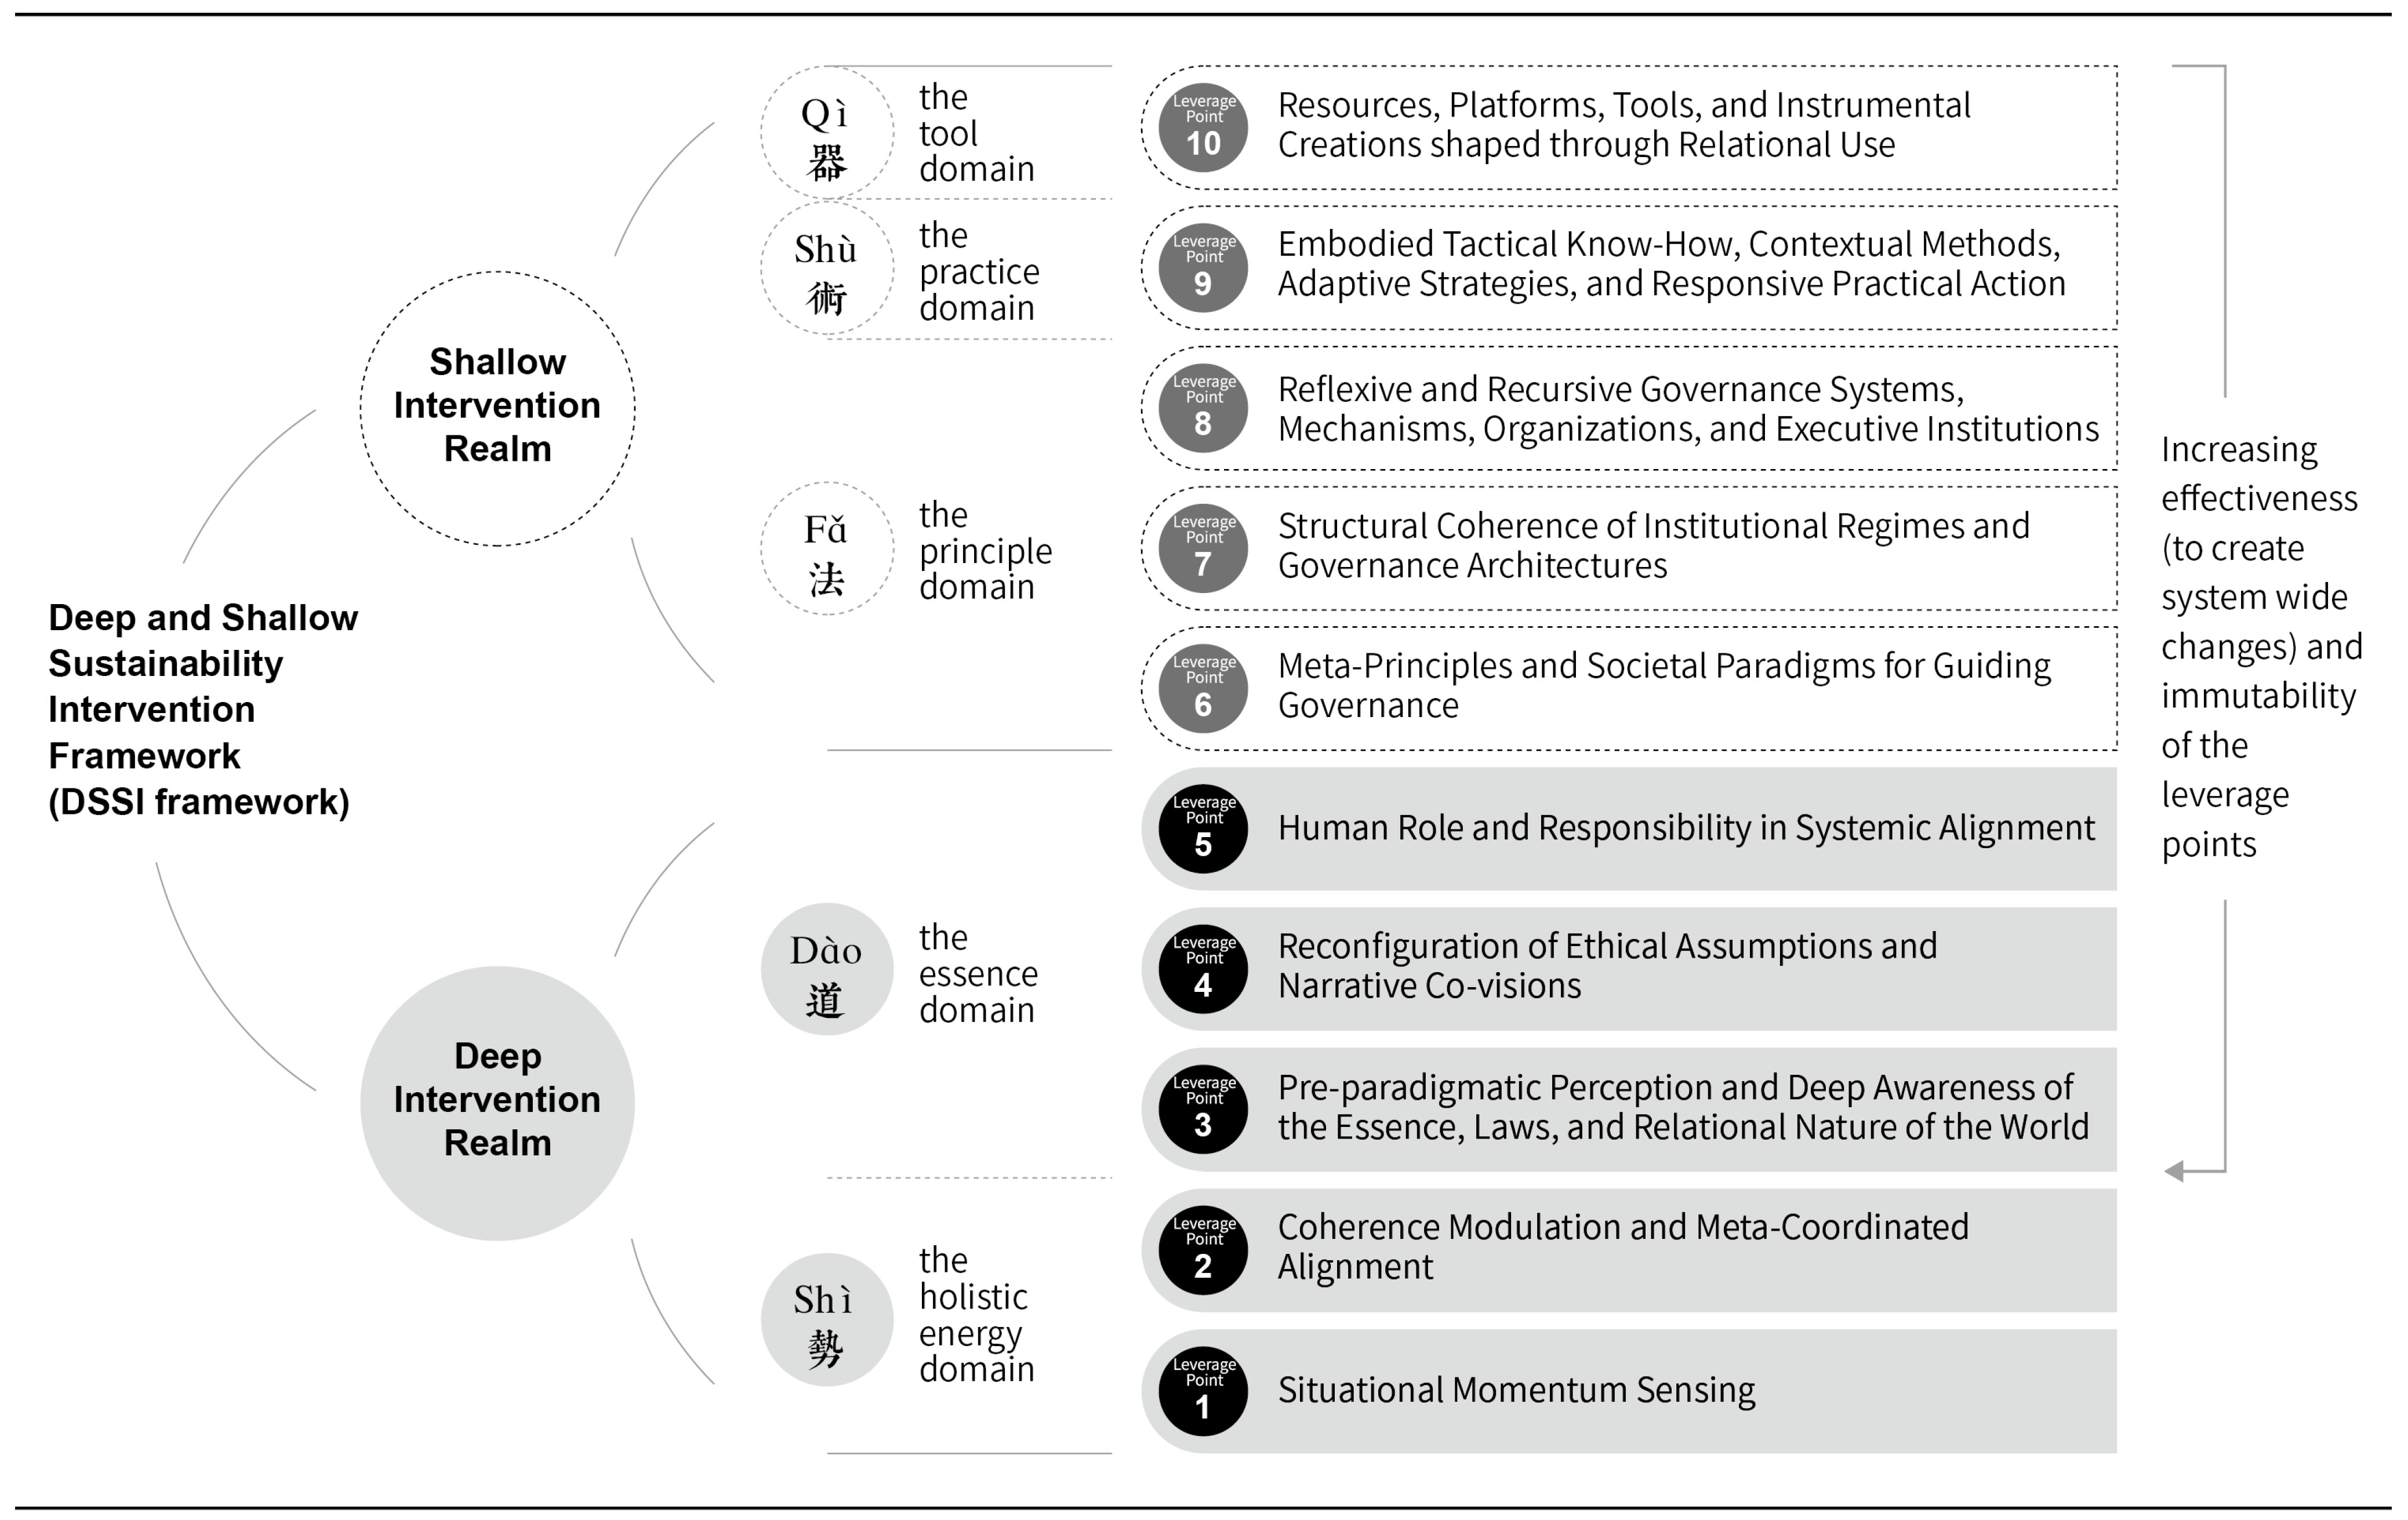
1049. Intervention points (Liang and Segalas, 2025)
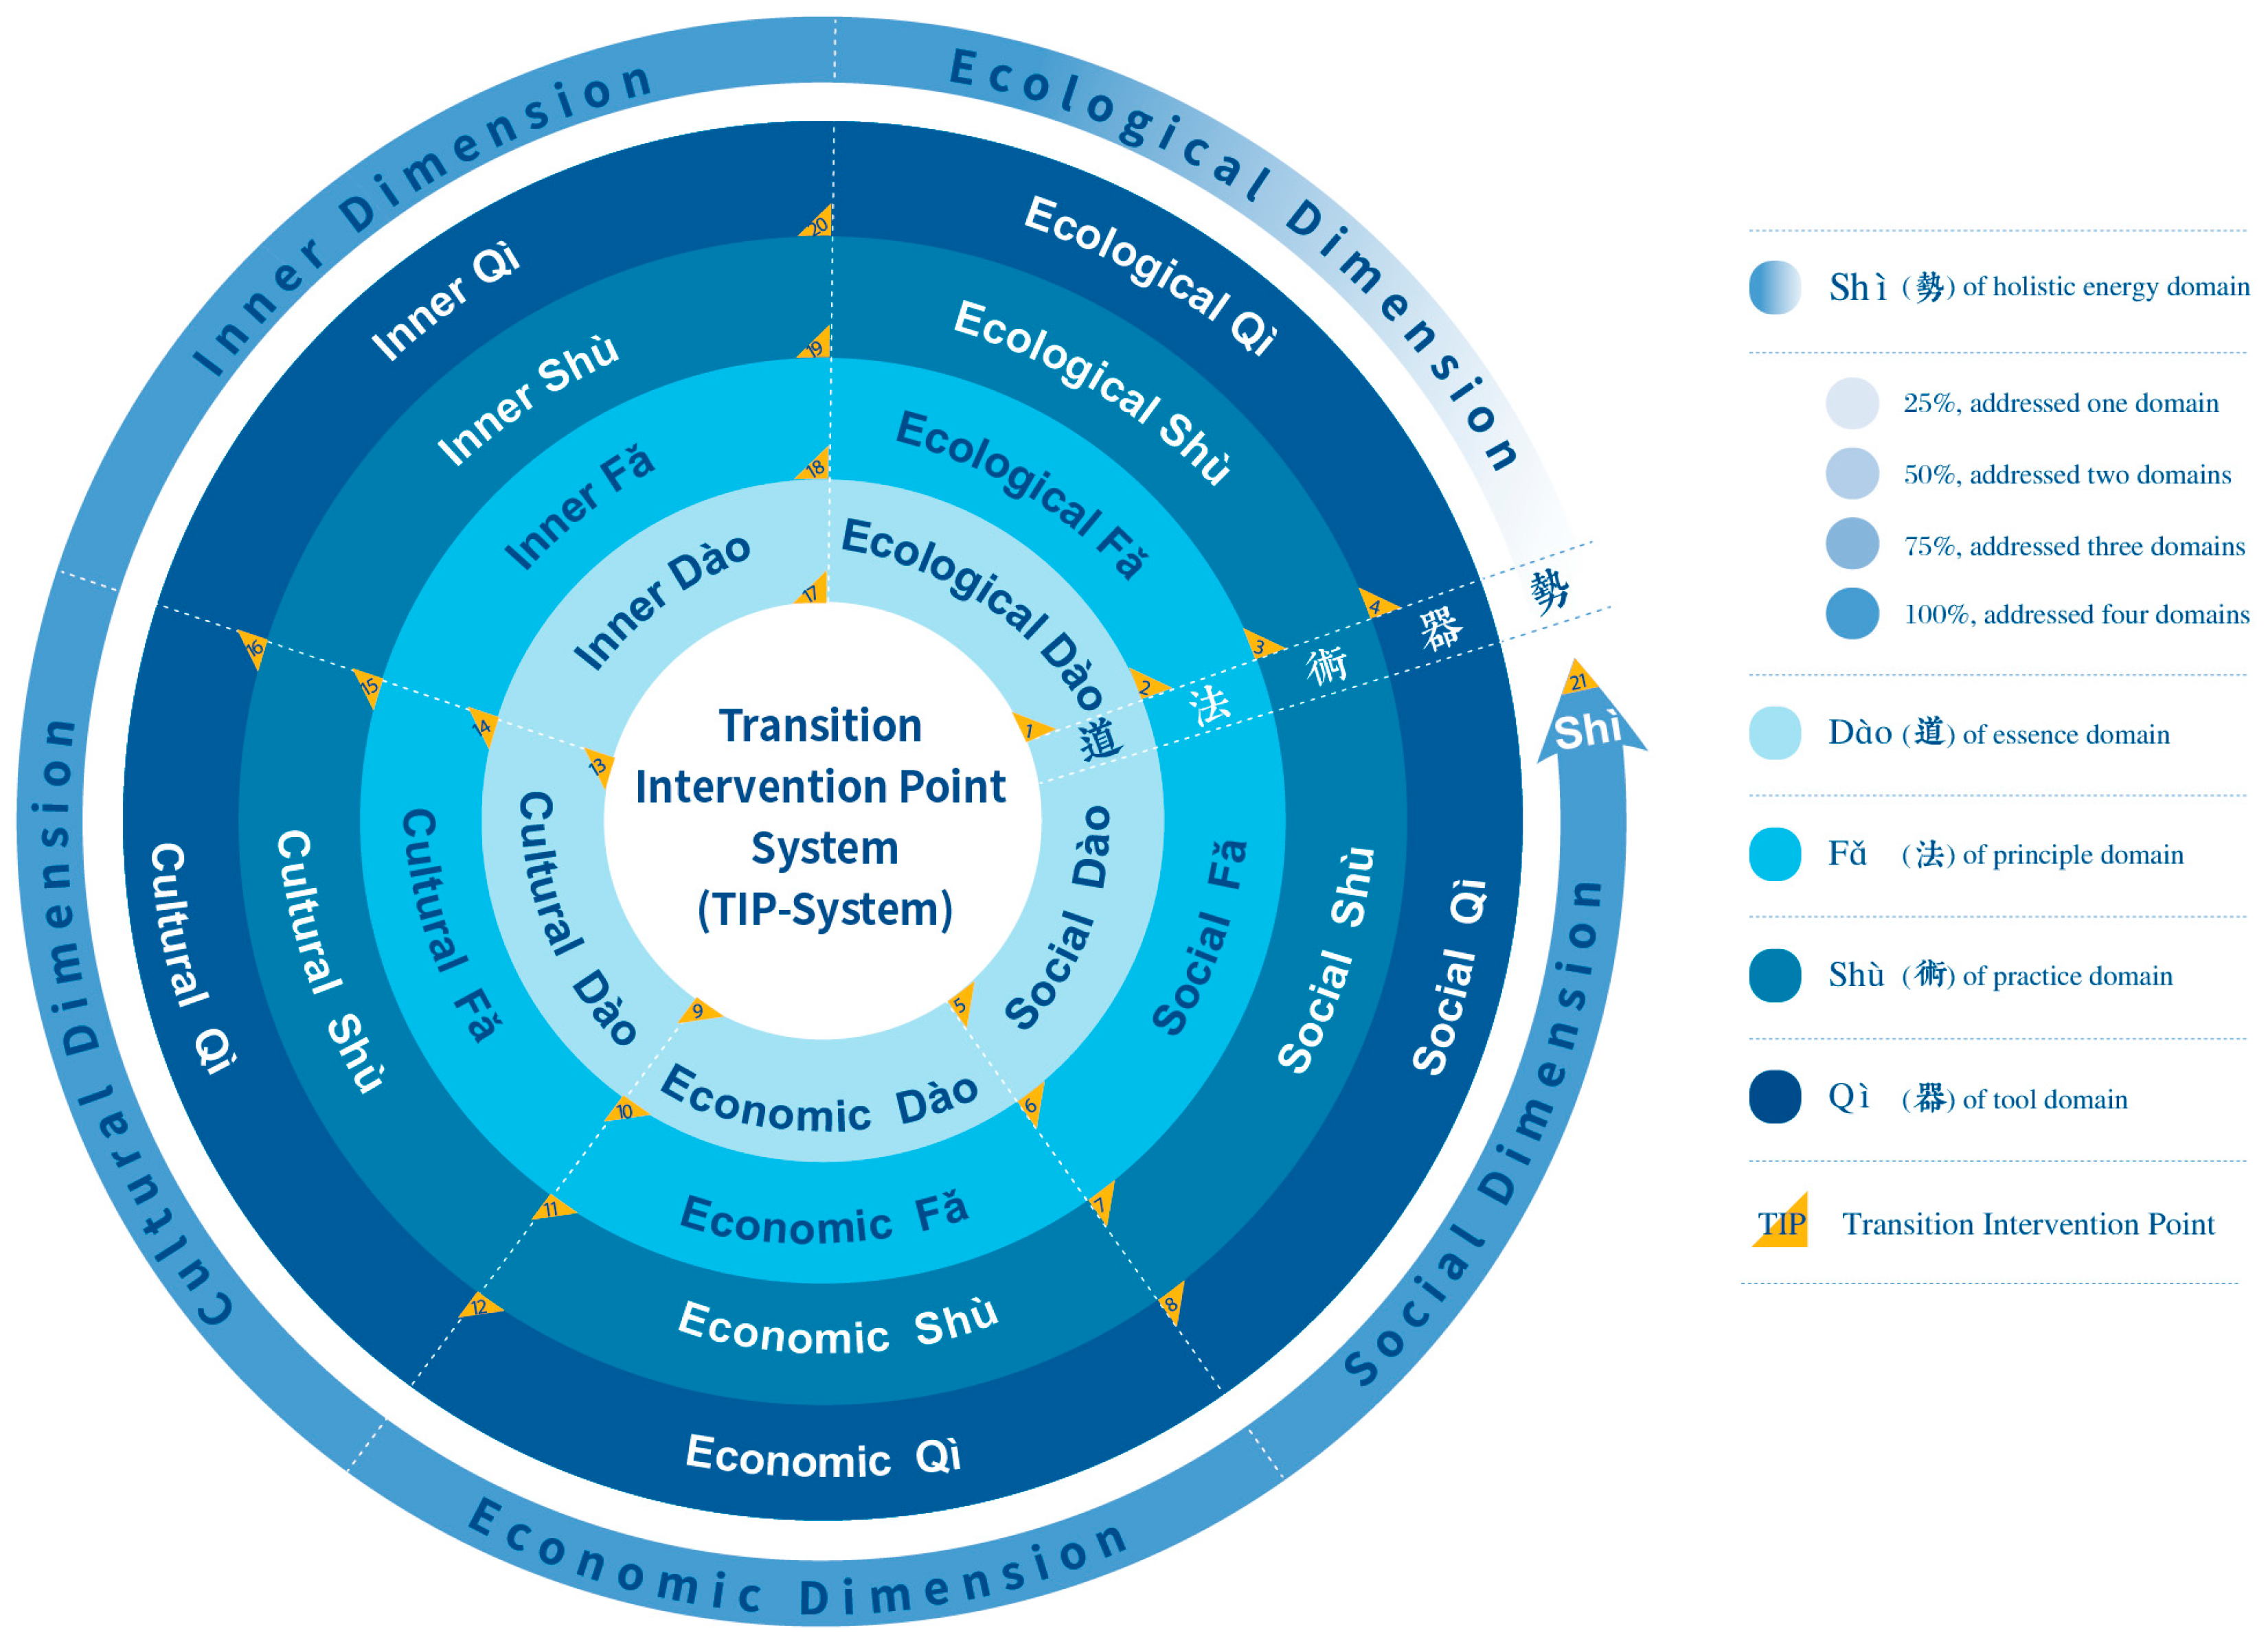
Example 1: Totnes
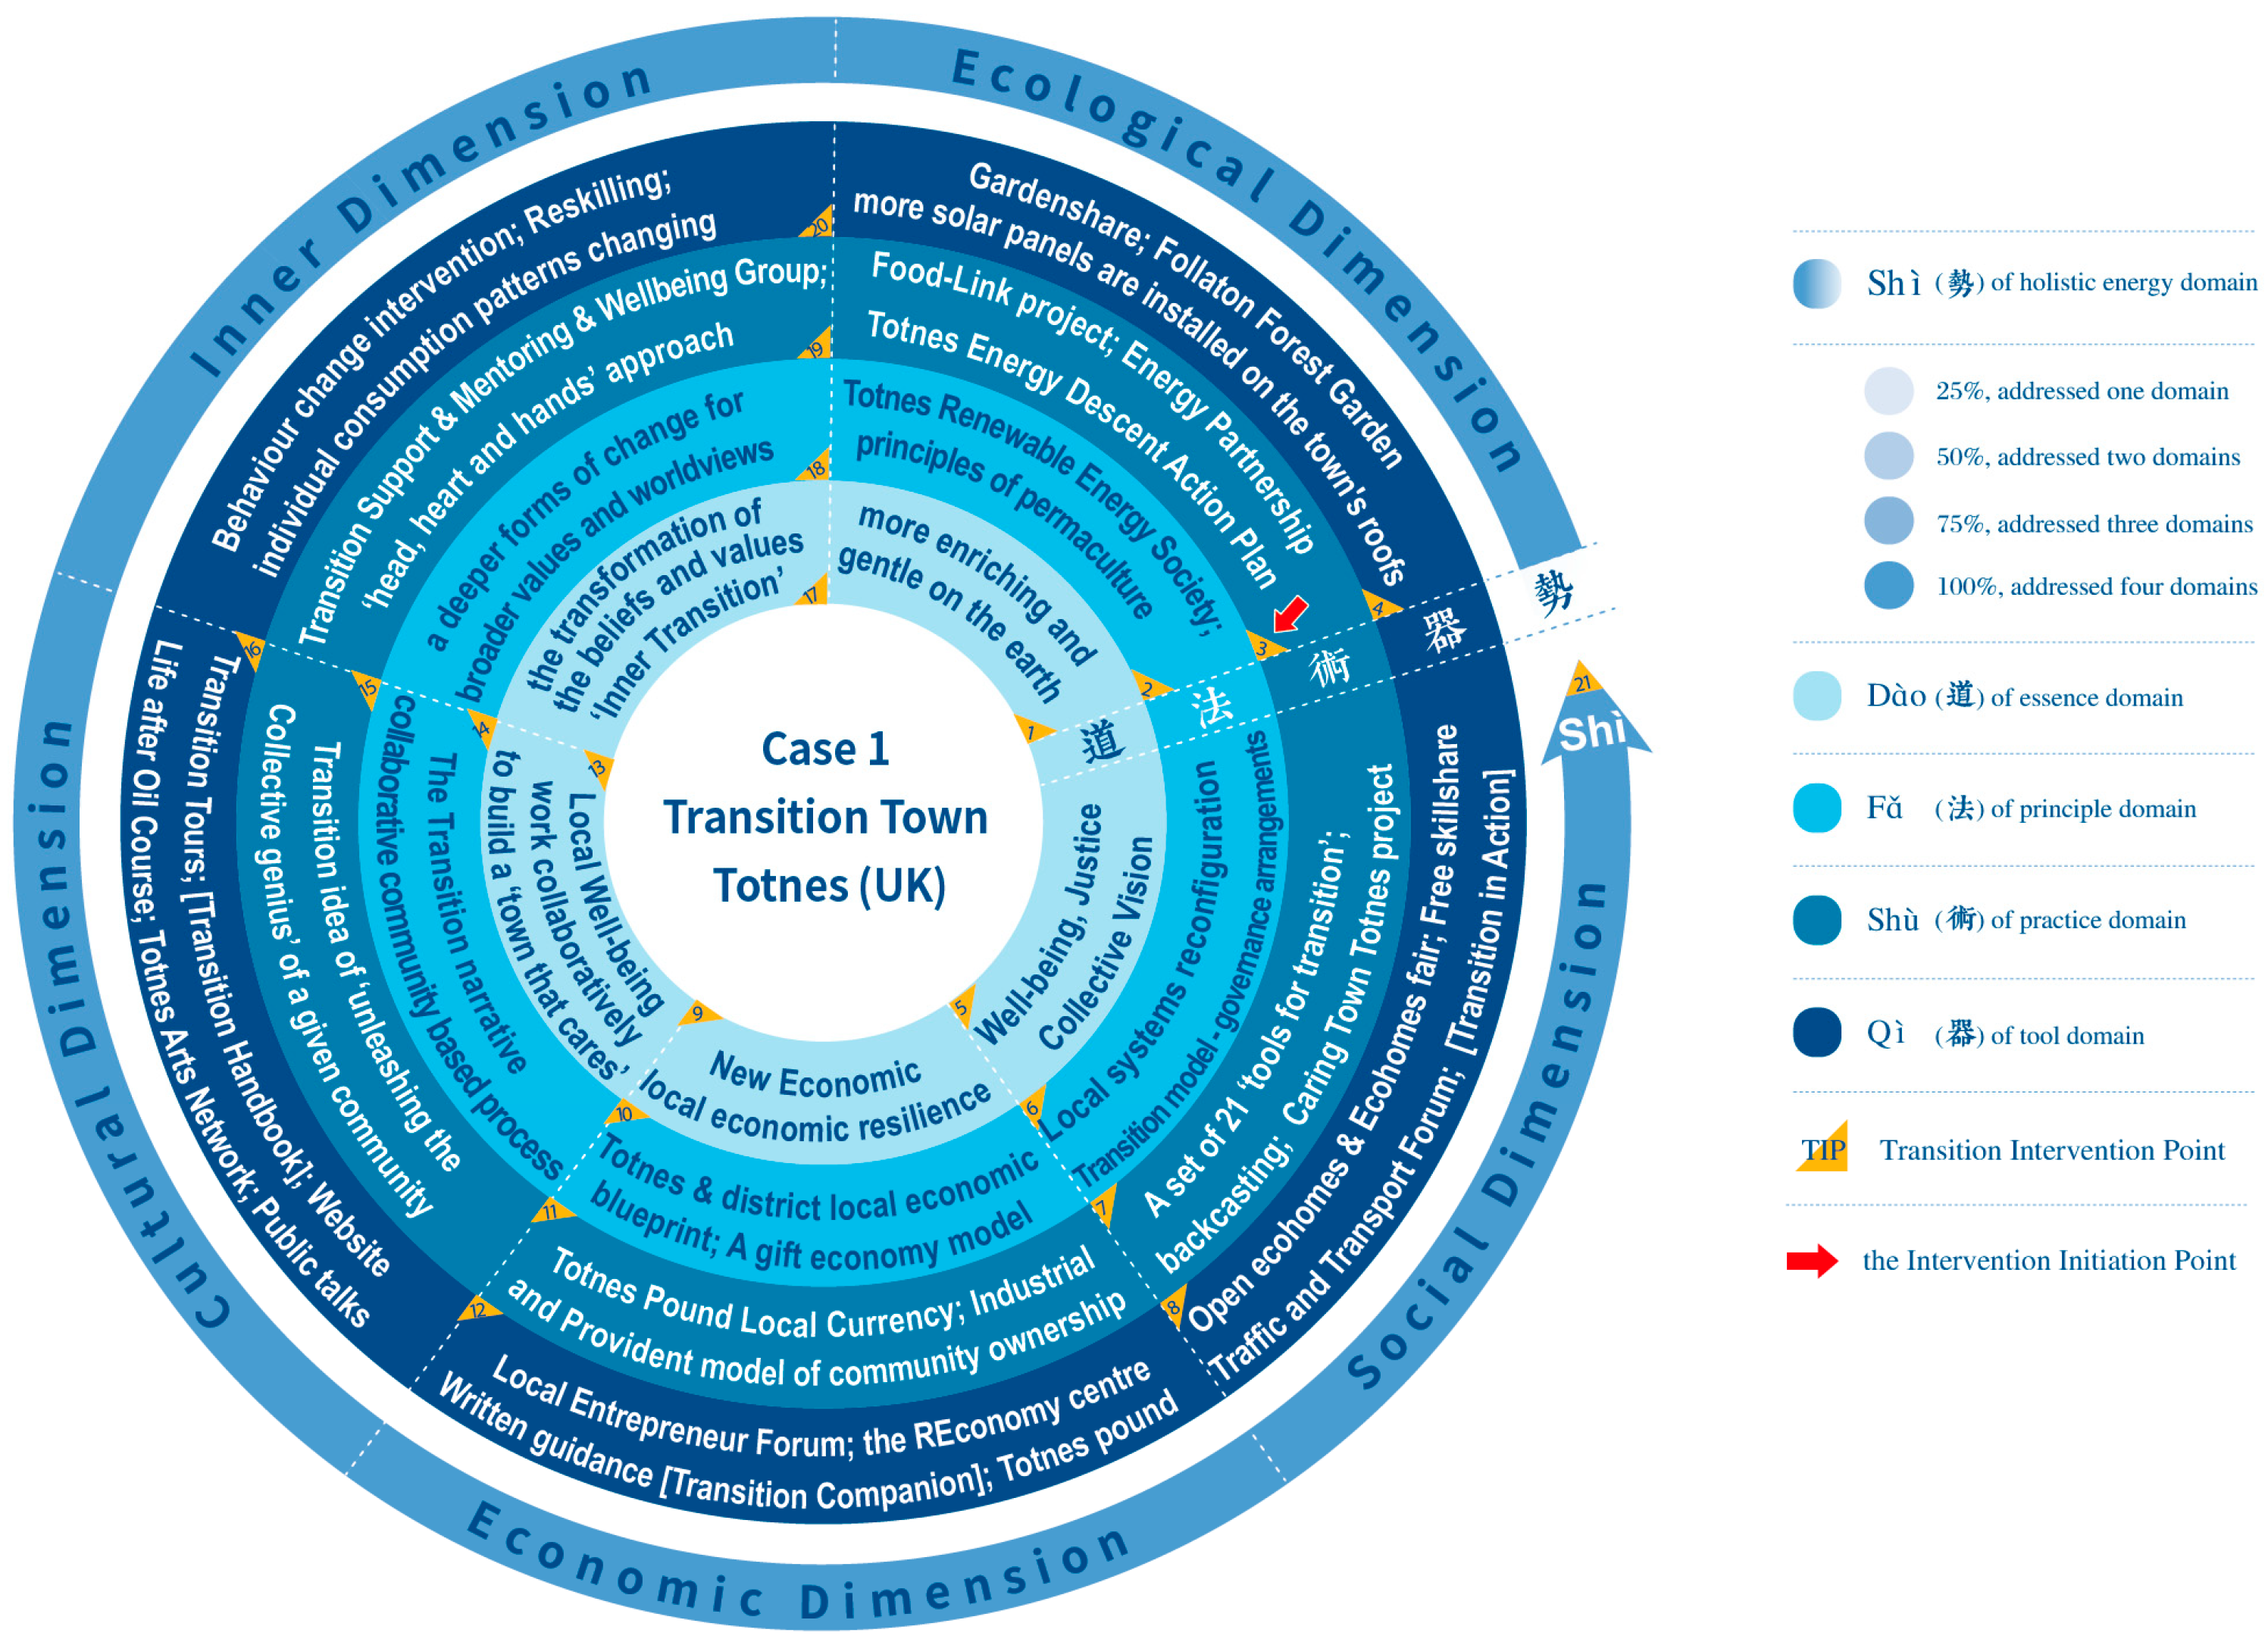
Example 2: Living Lab
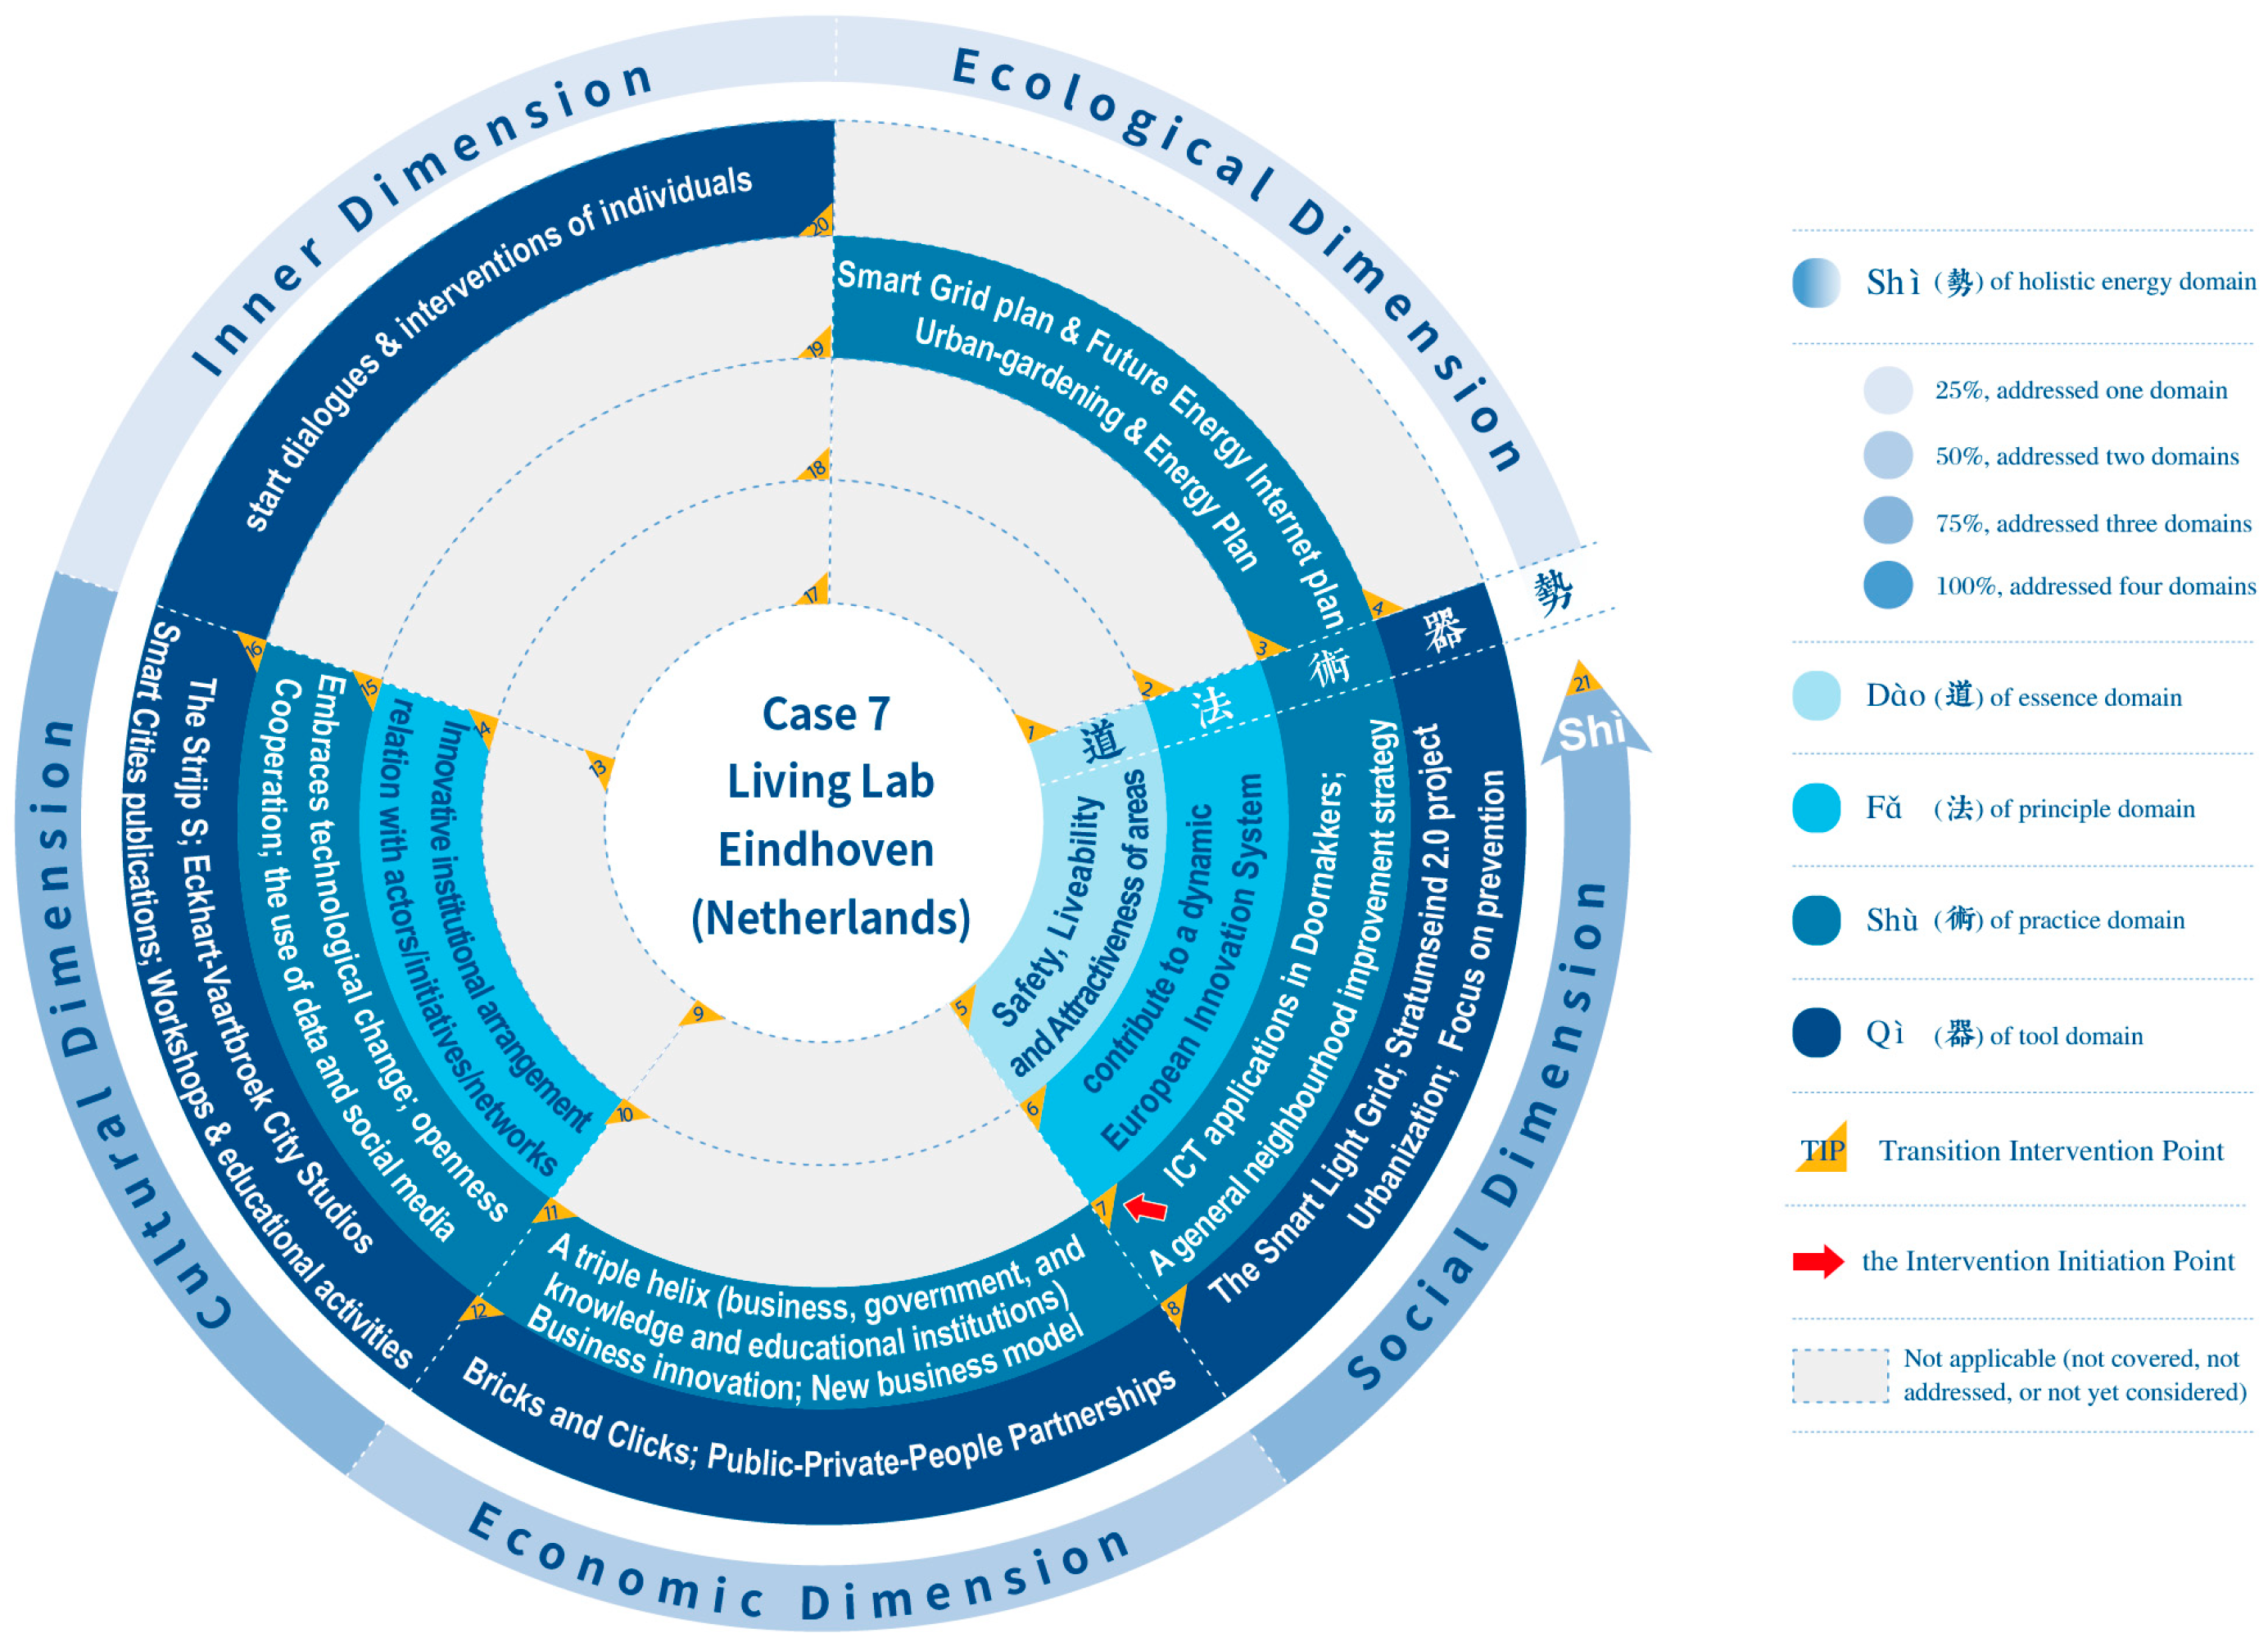
1050. Cosmotechnic (Wernli and Chan, 2023)
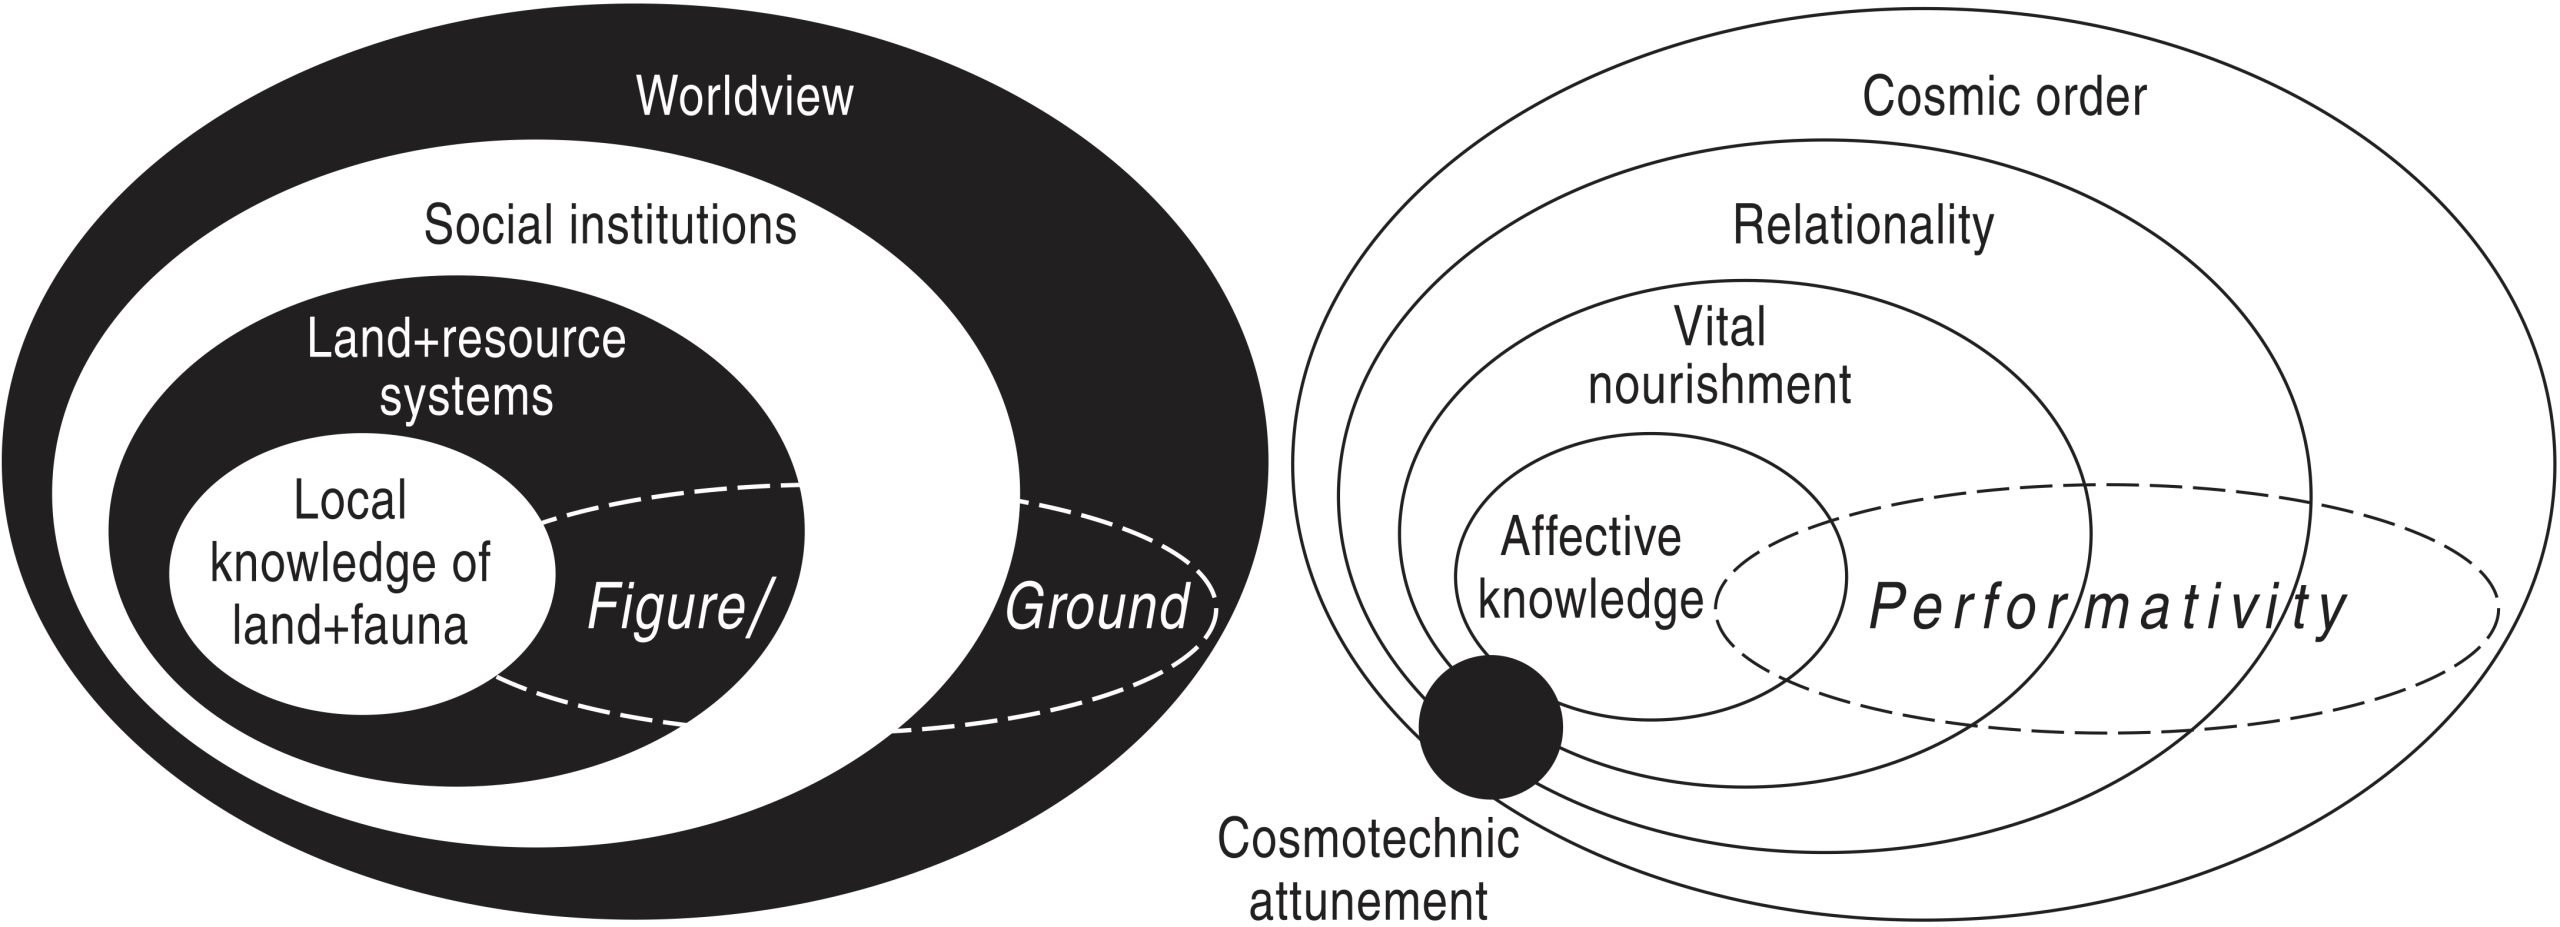
Applied to foodwaste:
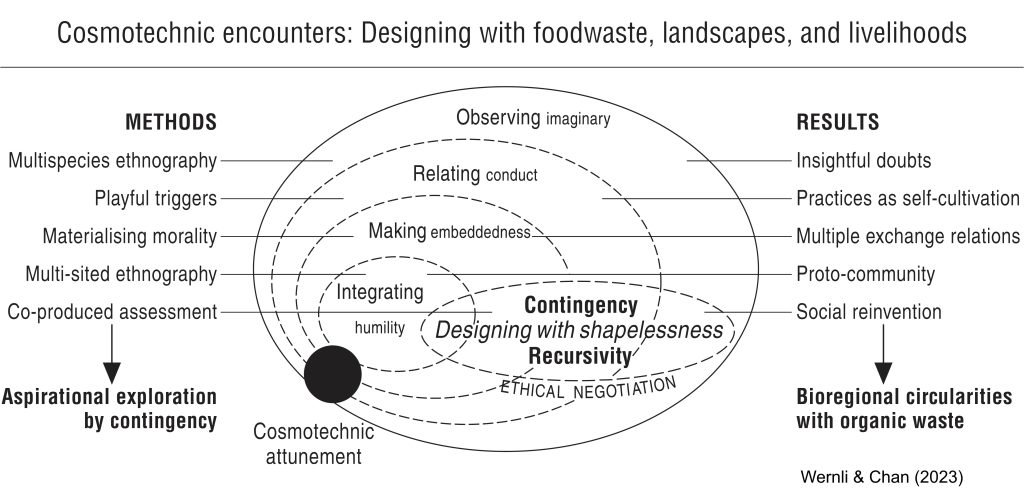
1051. Harmonised CoCoCon (Zhao, 2025)
This reciprocity among Me Harmony, We Harmony, and Eco Harmony creates a virtuous cycle where enrichment in one amplifies the others, leading to an upward spiral of grand harmony and sustainability.
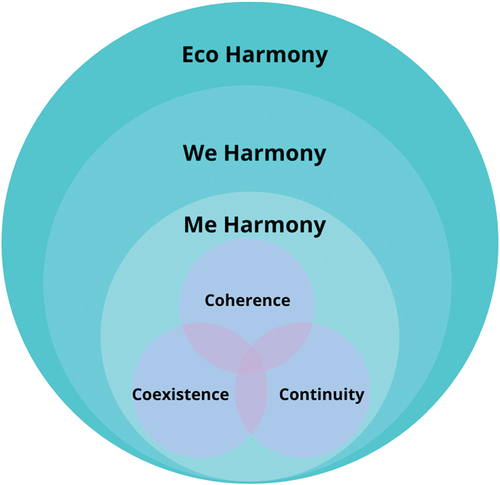
1052. Ternary plots of sustainability, security and resilience (Krueger et al., 2020)
(Doesn’t really define sustainability, but included for notion of “externalised sustainability”).
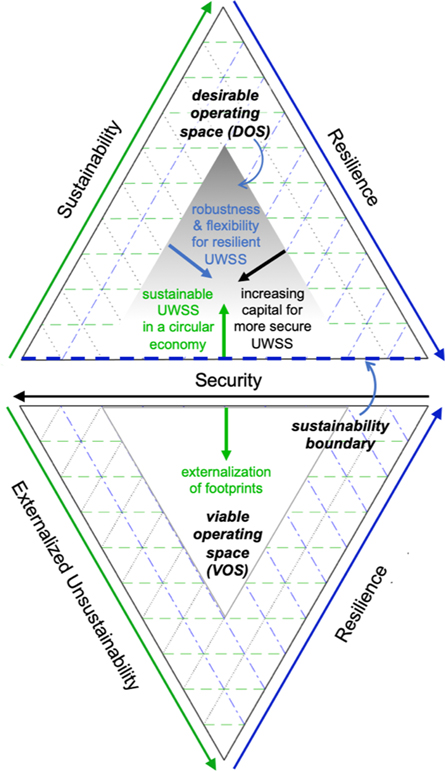
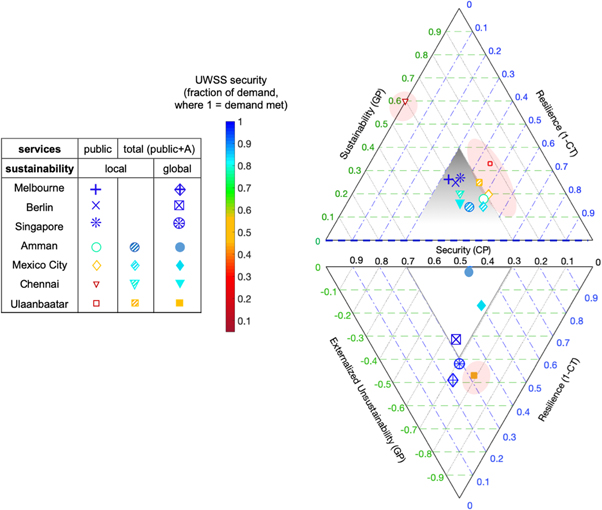
1053. Landscape sustainability science framework (Wu et al.,2025. See also #945)
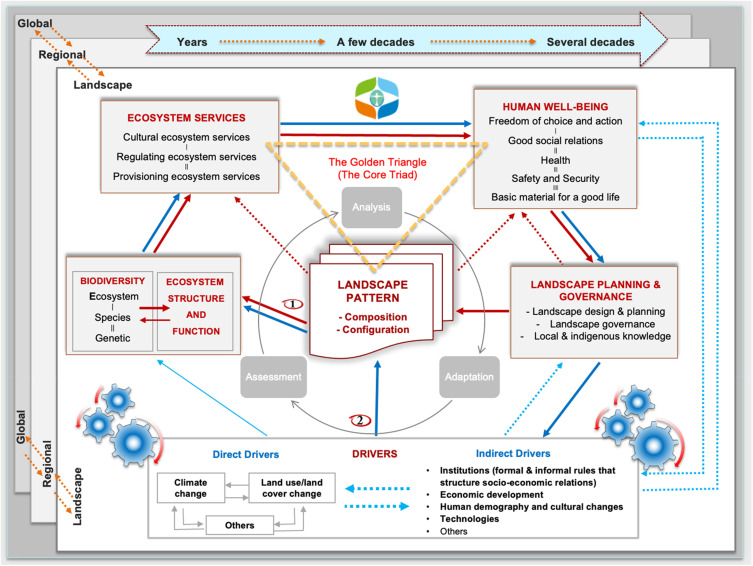
1054. Can’t go past a nice tree (Winkler et al – Lancet Commission, 2025)
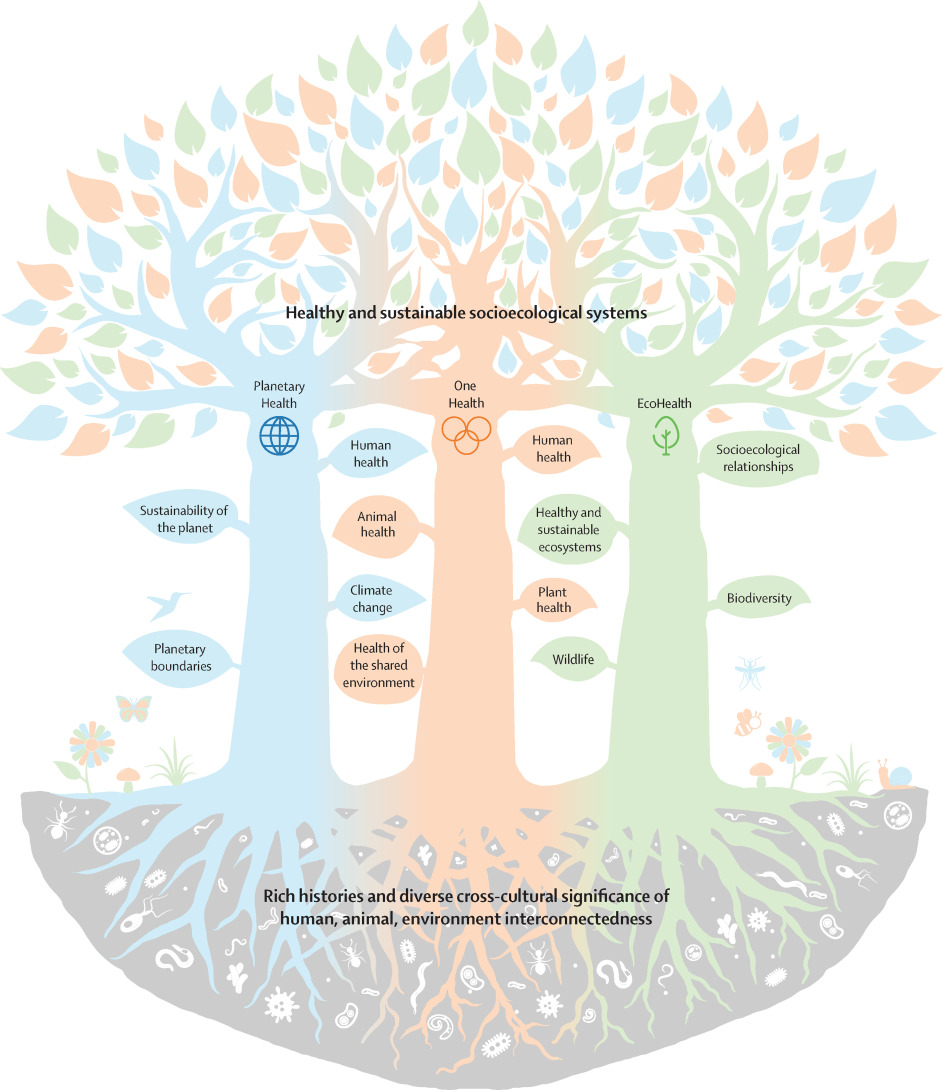
1055. Metacoupling framework (Liu 2023)

1056. Transformations of couples (Liu 2023)
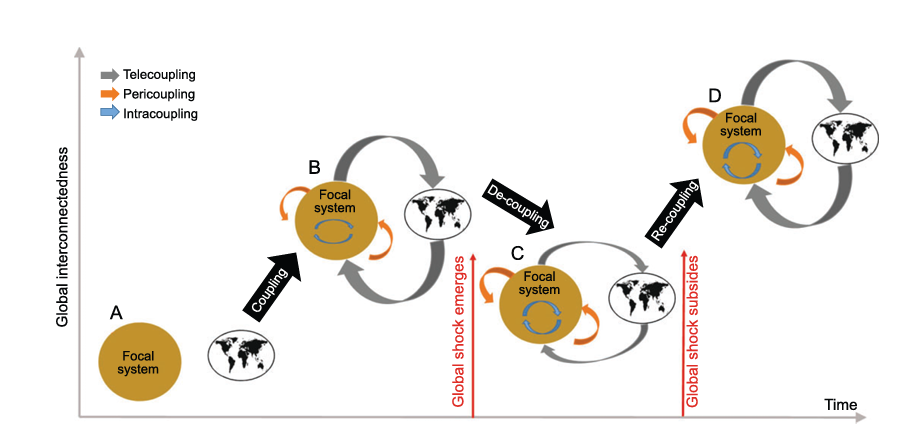
1057. Generalised Metacoupling (Mayer et al. 2025)
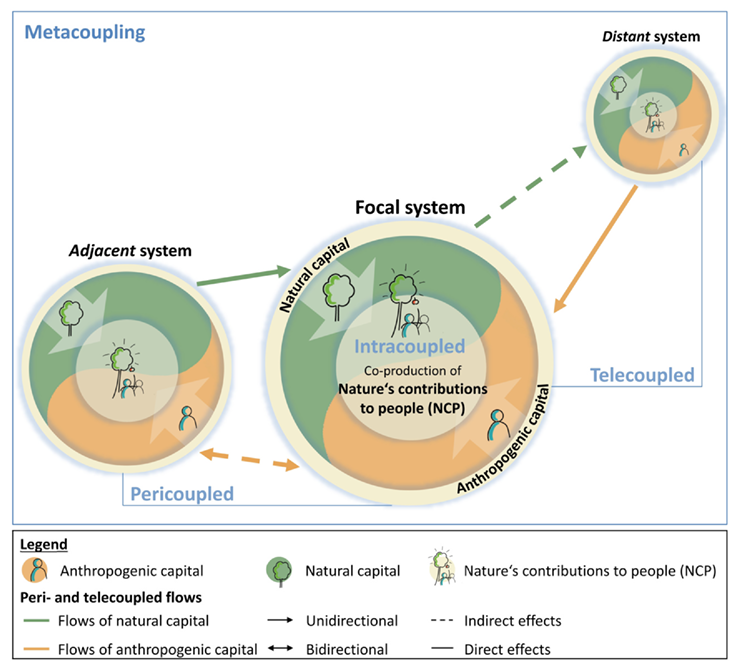
1058. Coupling applied – to water in China (Su et al, 2022)
Ecological value:
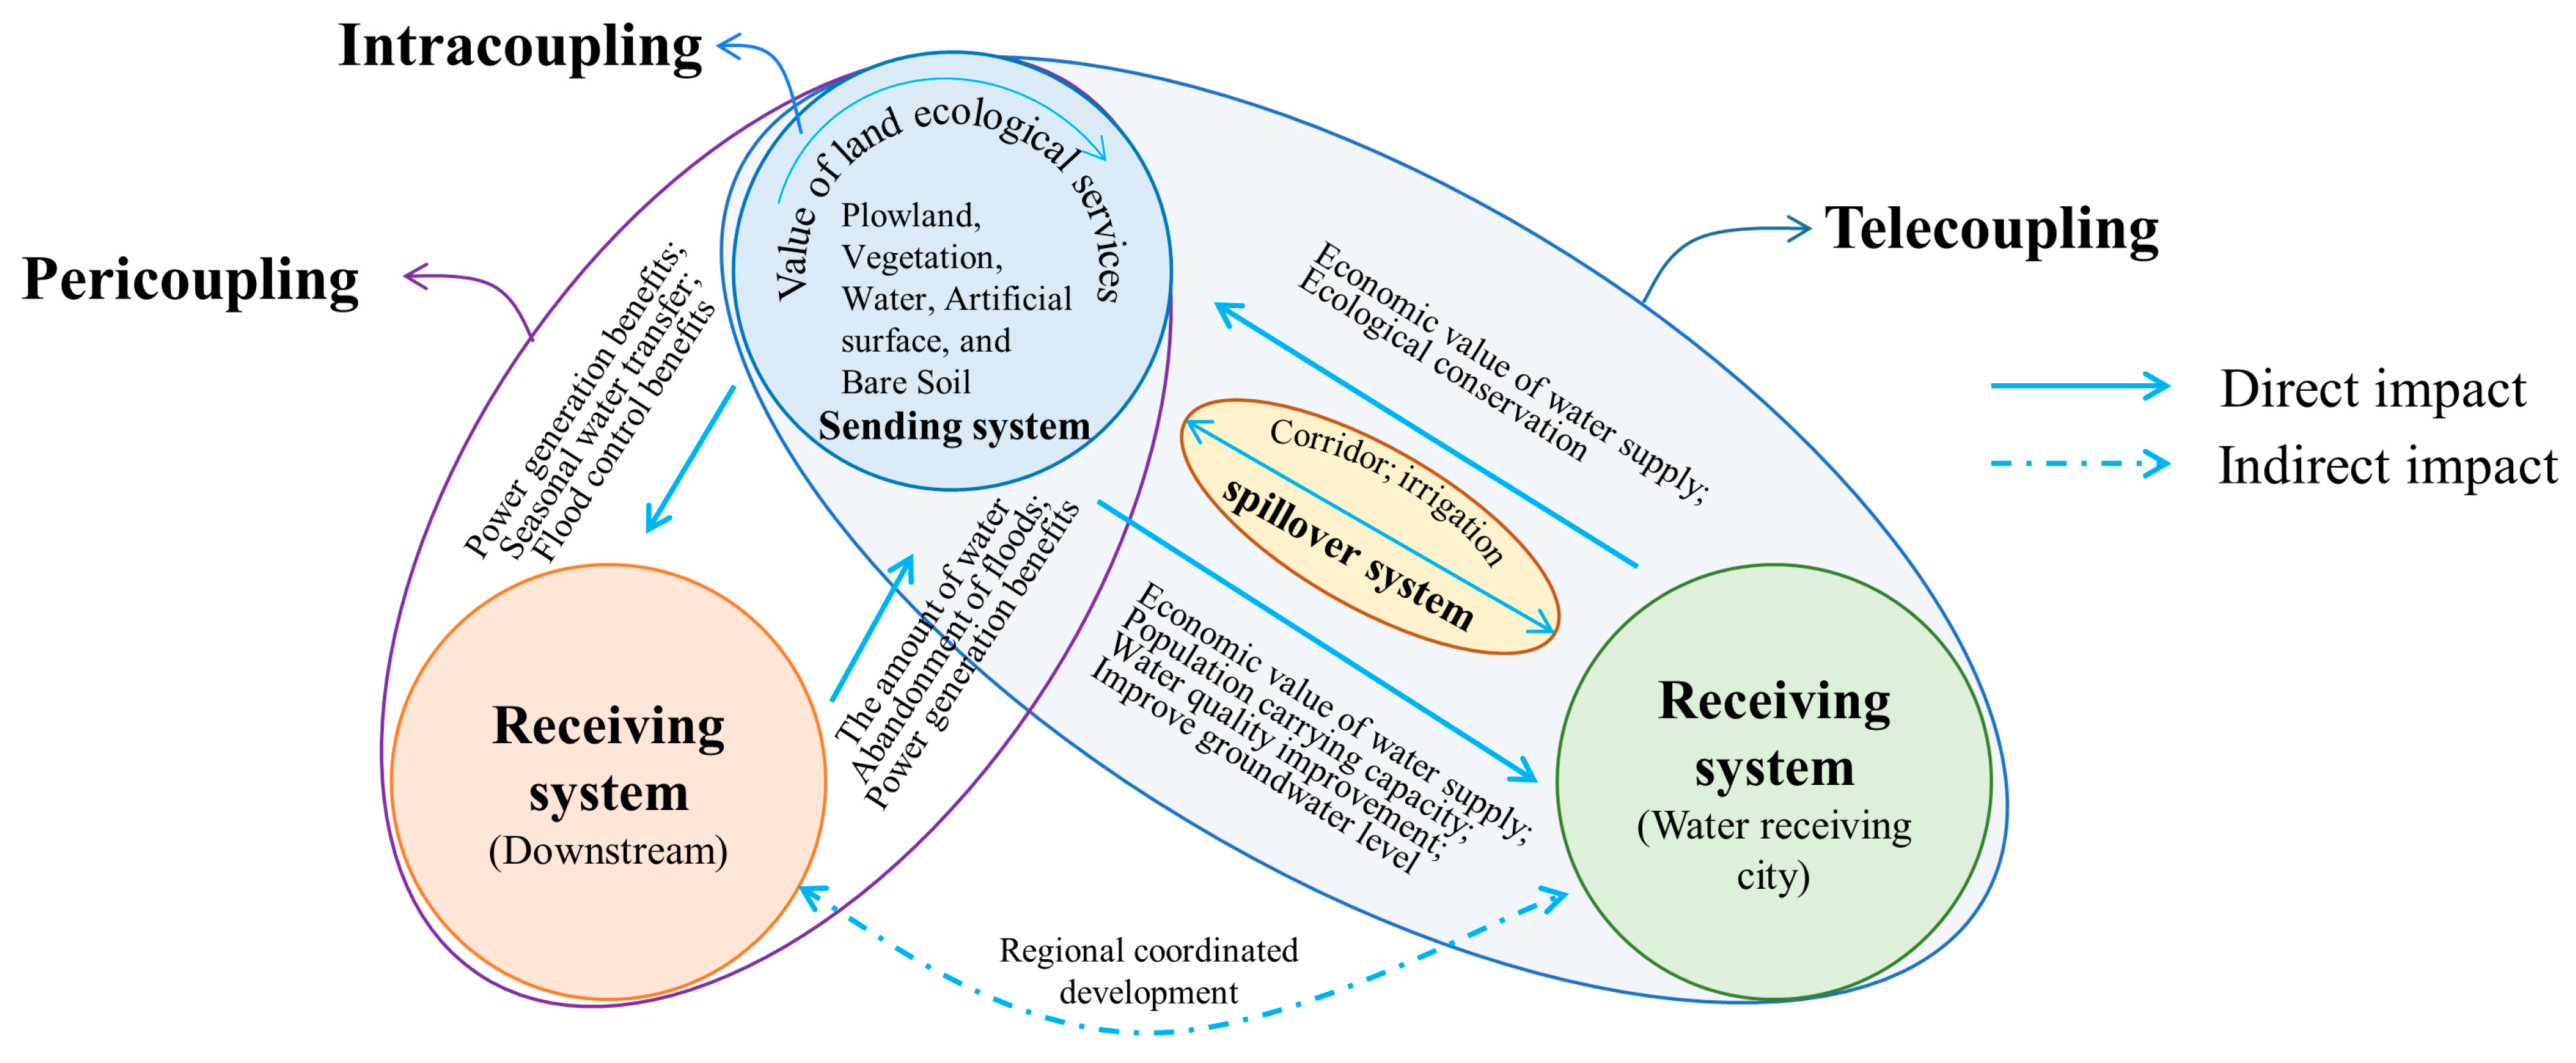
Ecological risk
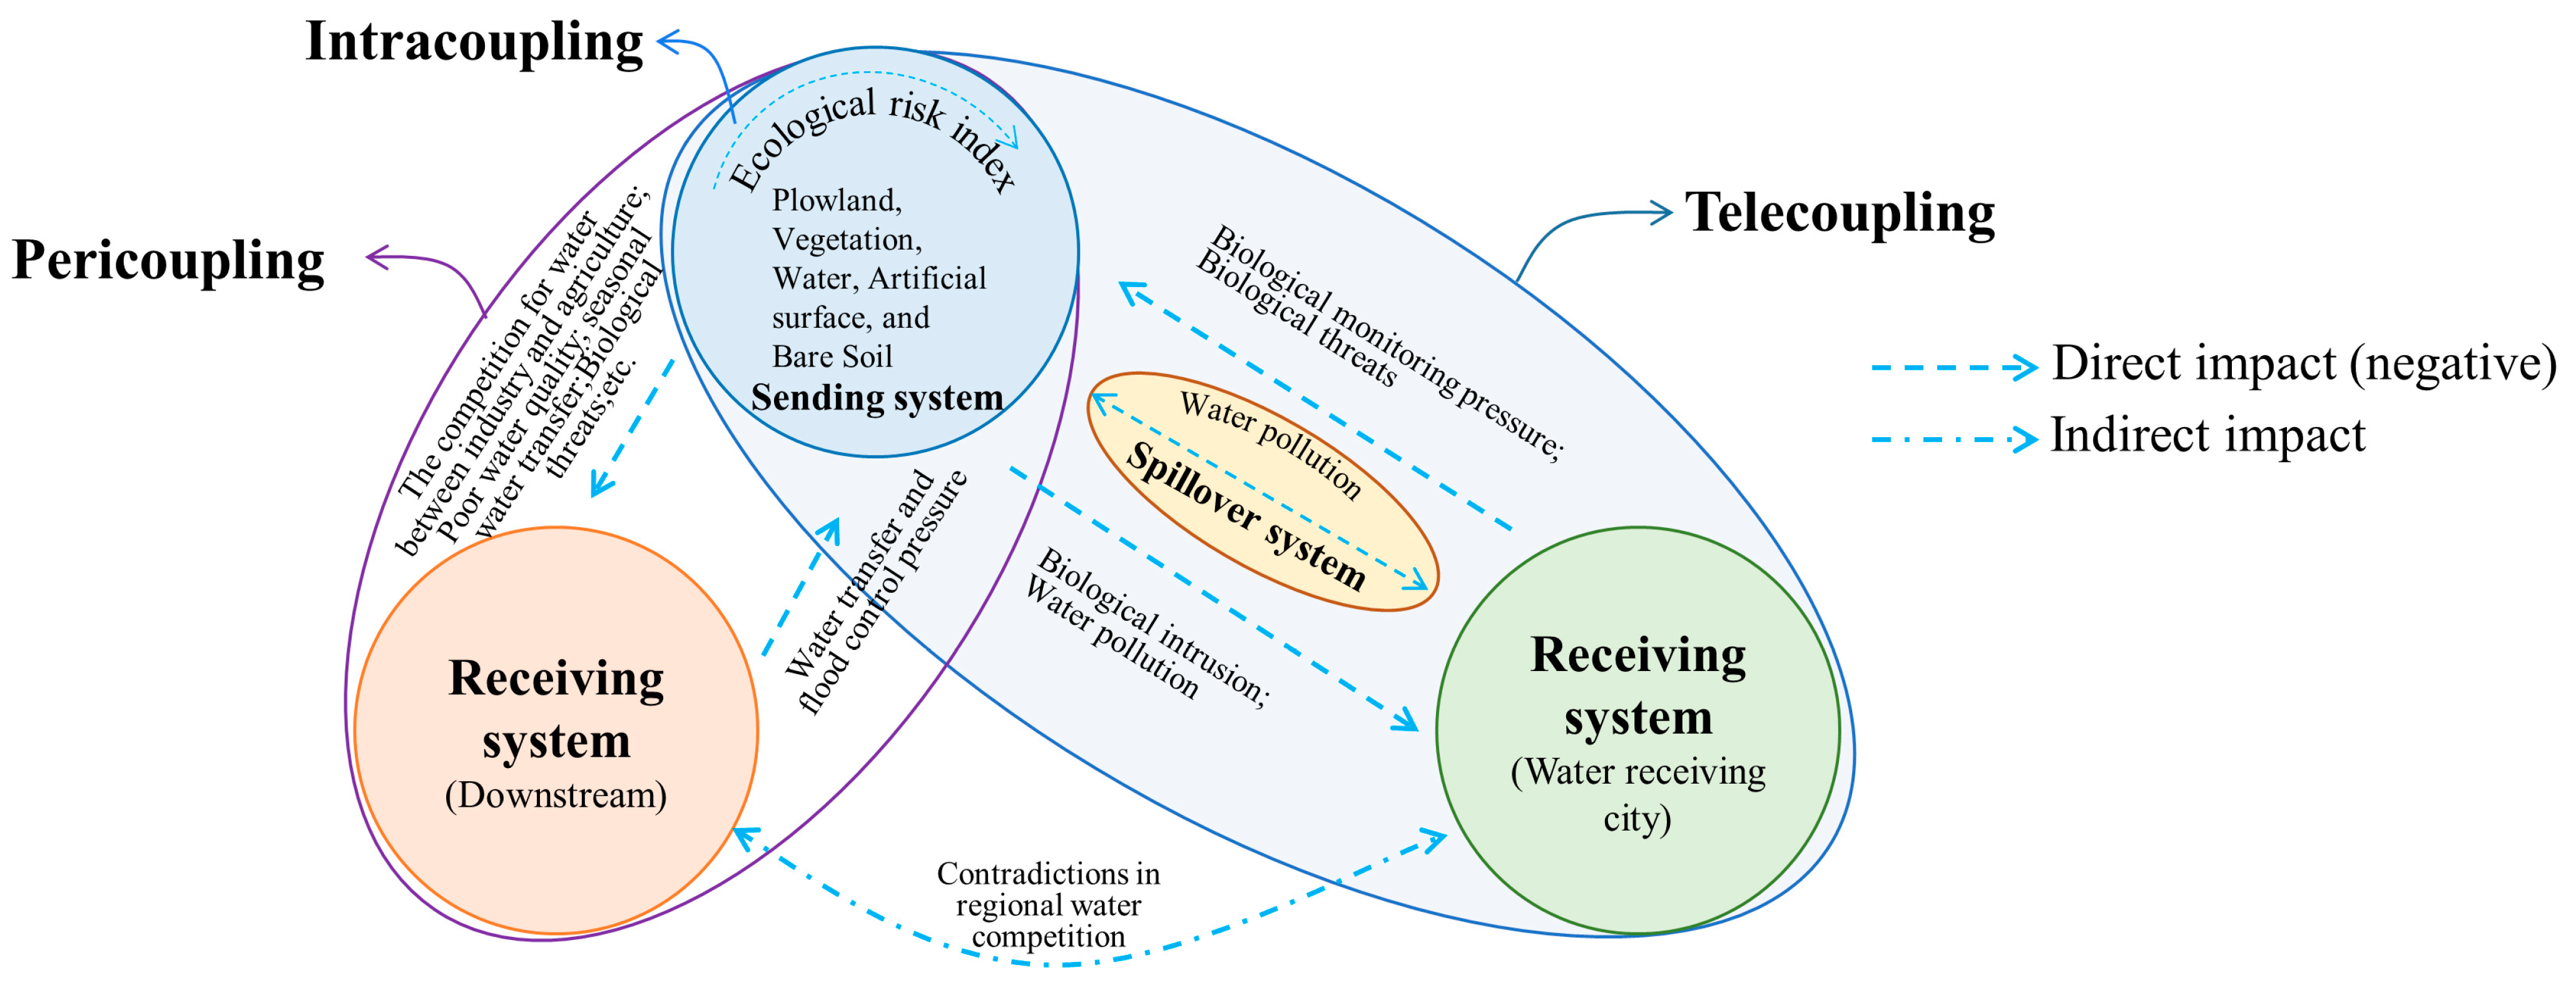
Benefit of metacoupling:
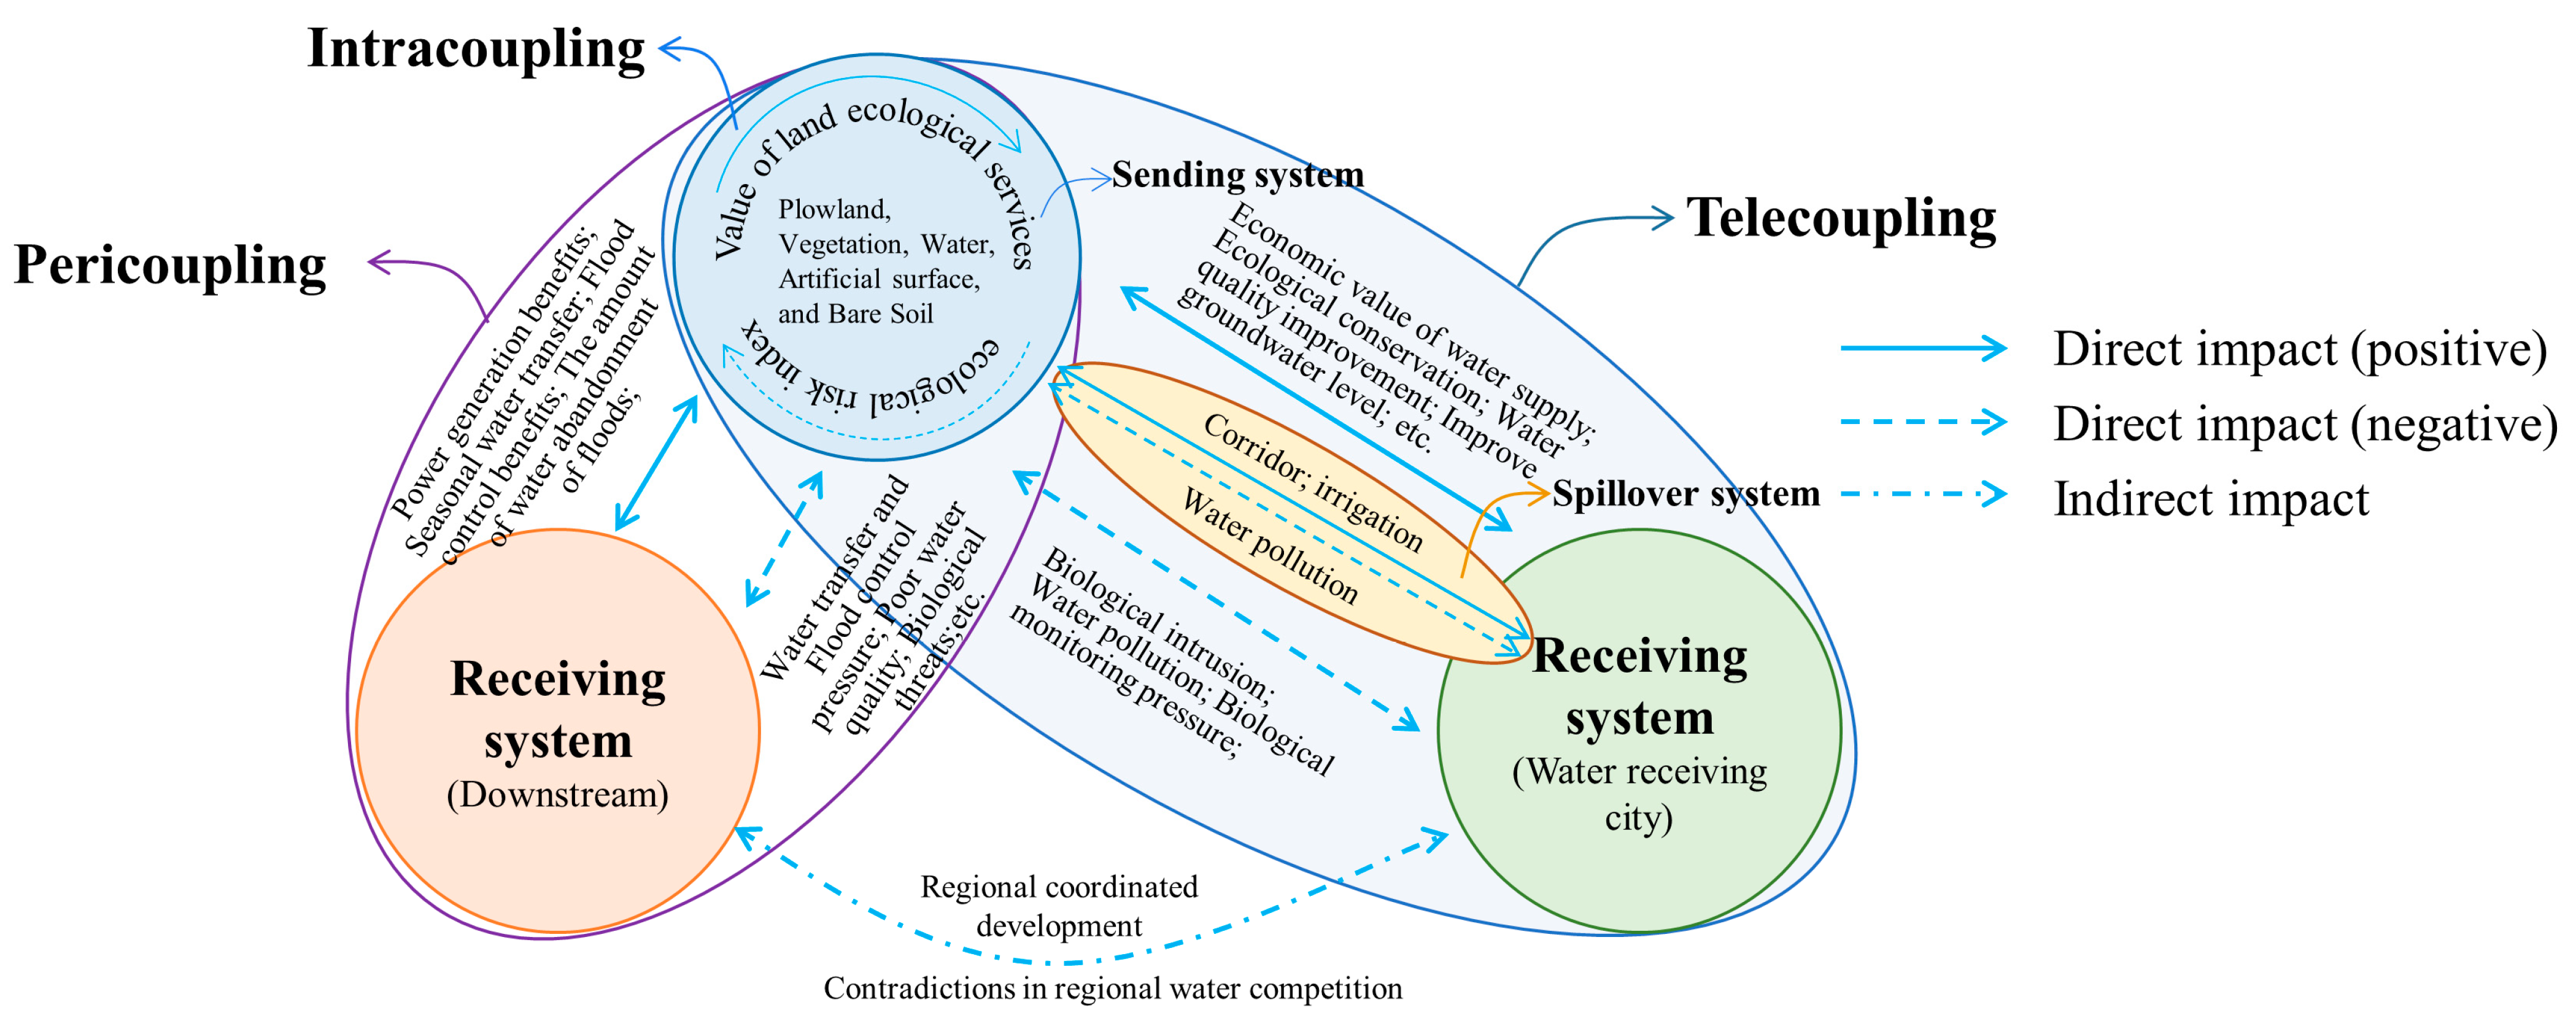
1059. Coupled systems. Yes, again, but included because of the embedding of the SDG ring into a systems diagram, with flows between SDGs. (Zhao et al., 2020)
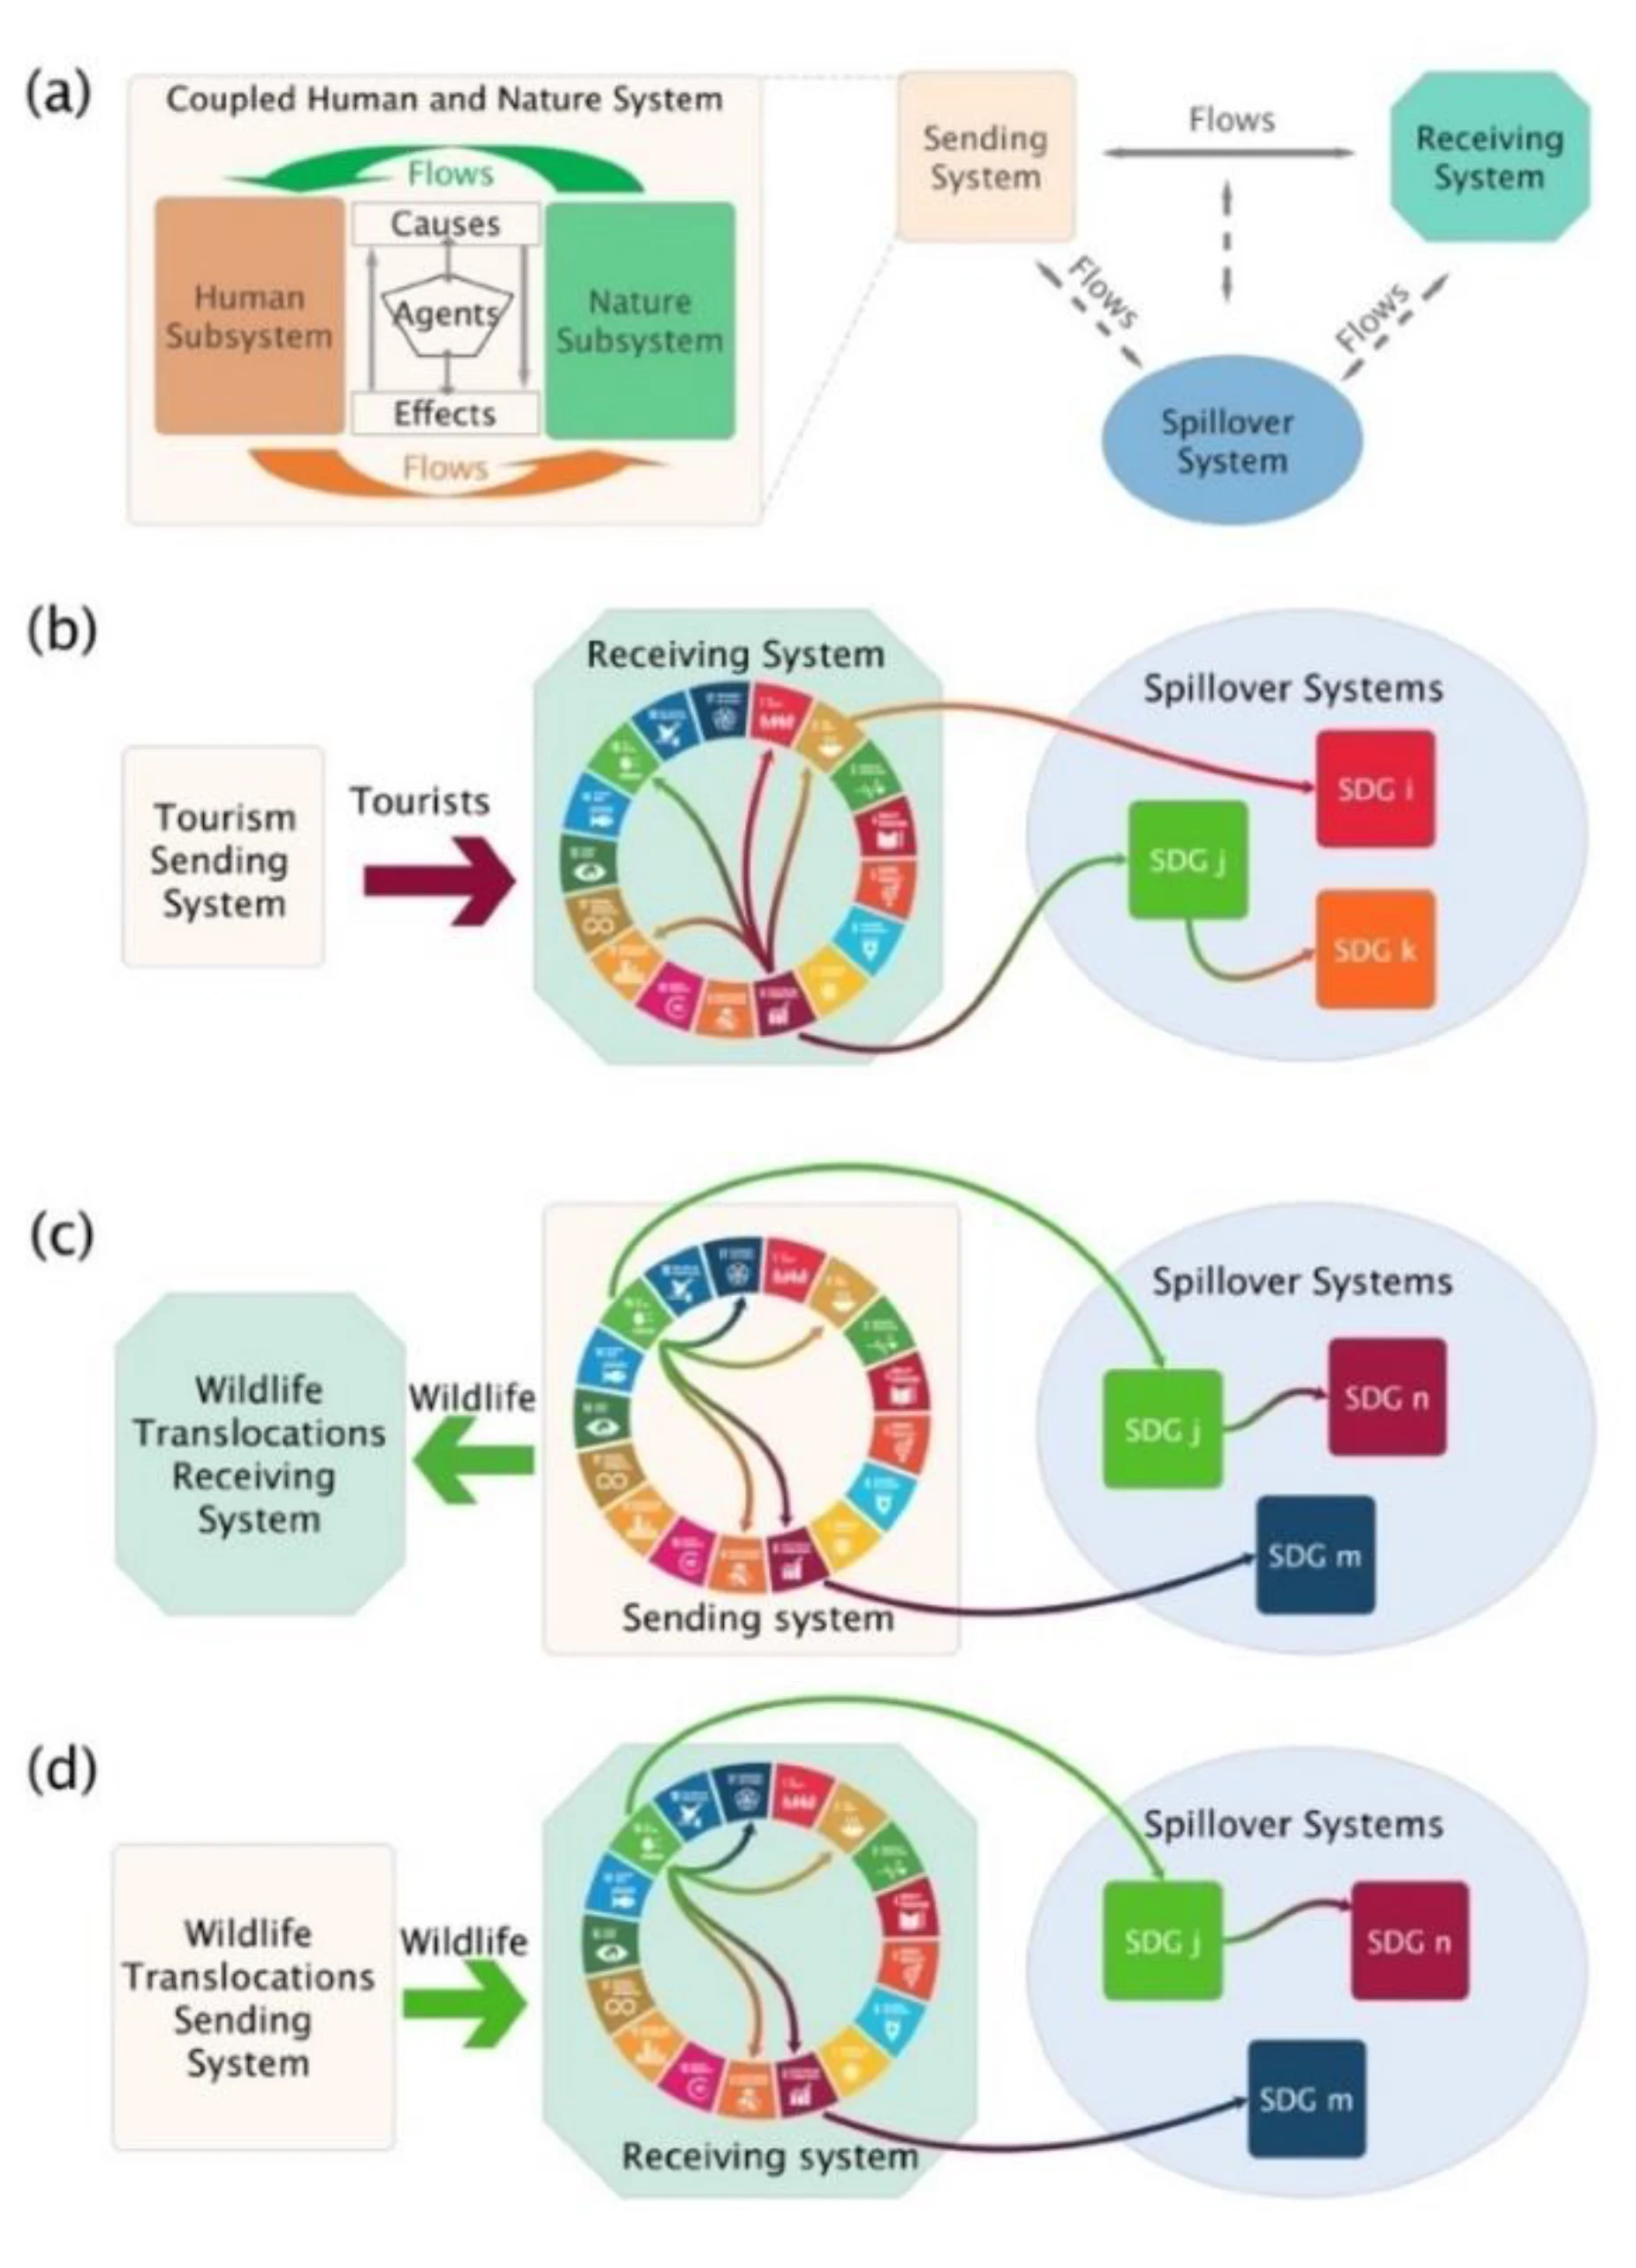
1060. Sustainability on the moon? Synergistic approaches. (
Note the ecological criteria and human criteria still pulling in opposite directions.
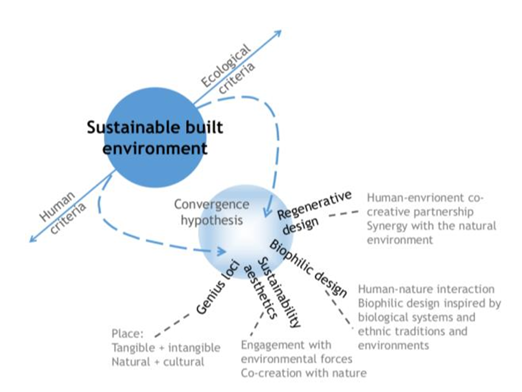
1061. Icons of sustainable architecture (Daugelaite et al., 2021)
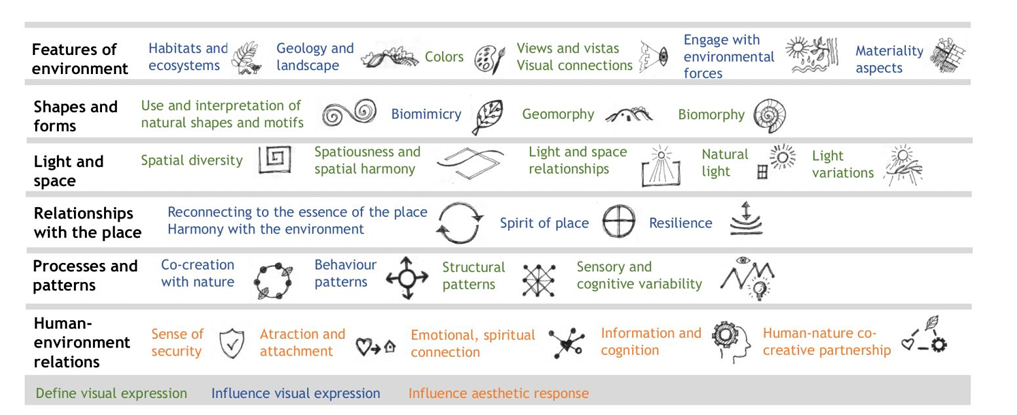
I have a guideline about not including applications of sustainability in the collection (so no diagrams of rooftop solar systems etc), but I think this brings sustainability as a system to a respresentation of a place.
The images were derived from a model that explores relationships in different forms of sustainability and a set of questions of assessment of aesthetic expression.
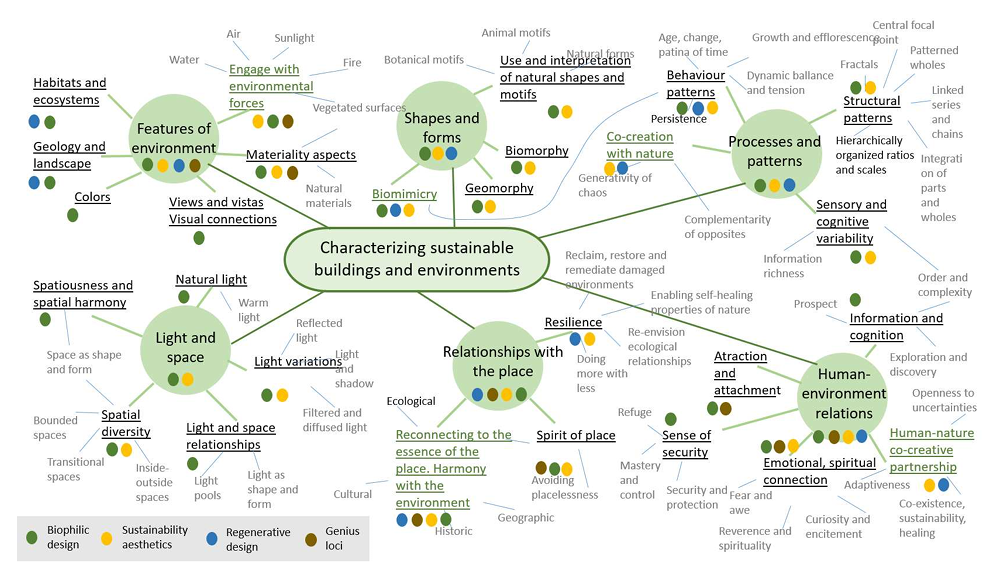
Then these icons were then applied in design – essentially making the diagram of the buildings into a functioning systems model of sustainability (of course more than the system inherent in the buildings themselves).
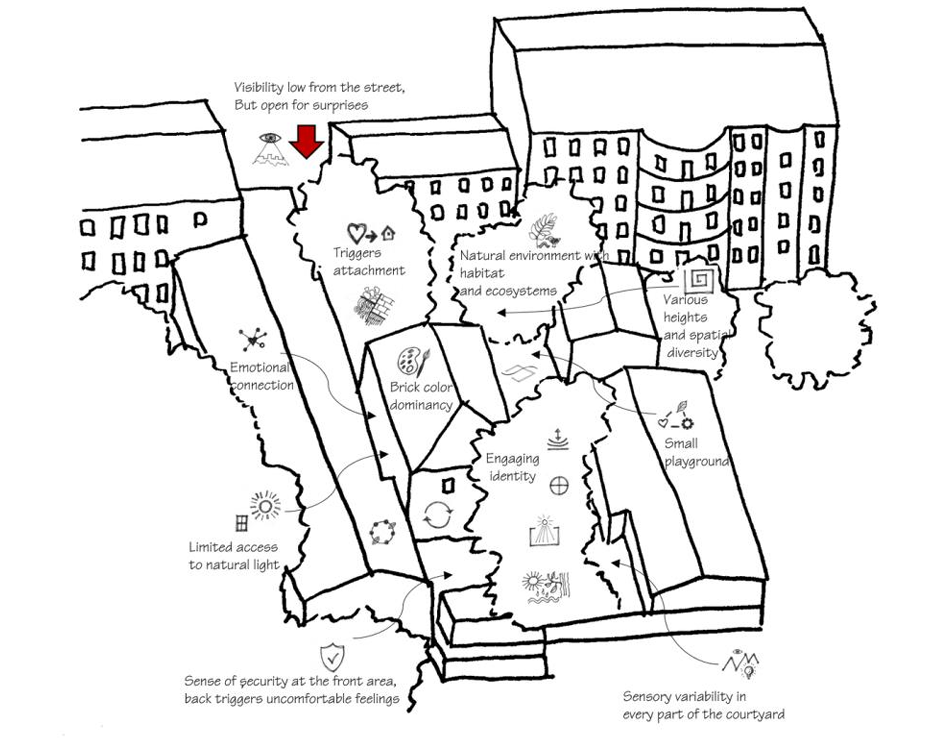
1062. Sustainable, not heroic (defining sustainable by what it isn’t) (Krawczyk and Braun, 2025)
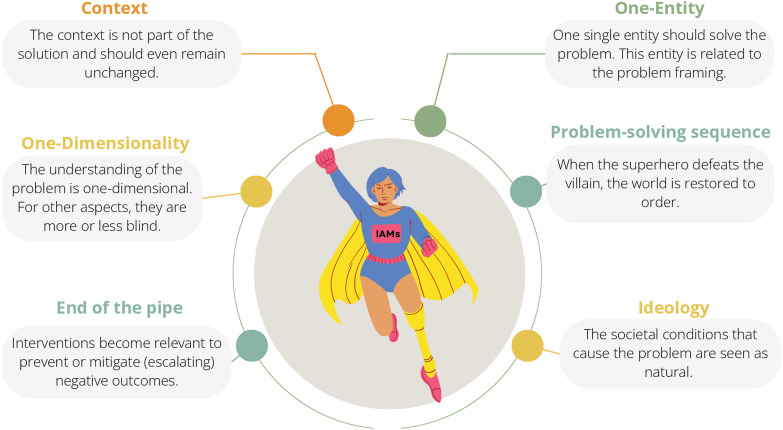
1063. Looks pretty steep for a tractor (Kotowska et al., 2025)
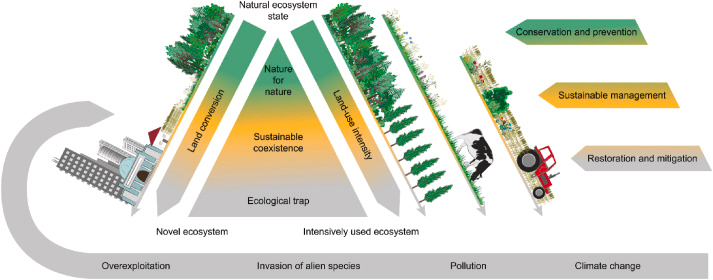
1064. System traps (Søgaard et al., 2024)
(key to numbered traps in supplementary data) 065. Regeneration and resilience (Fischer et al., 2026)
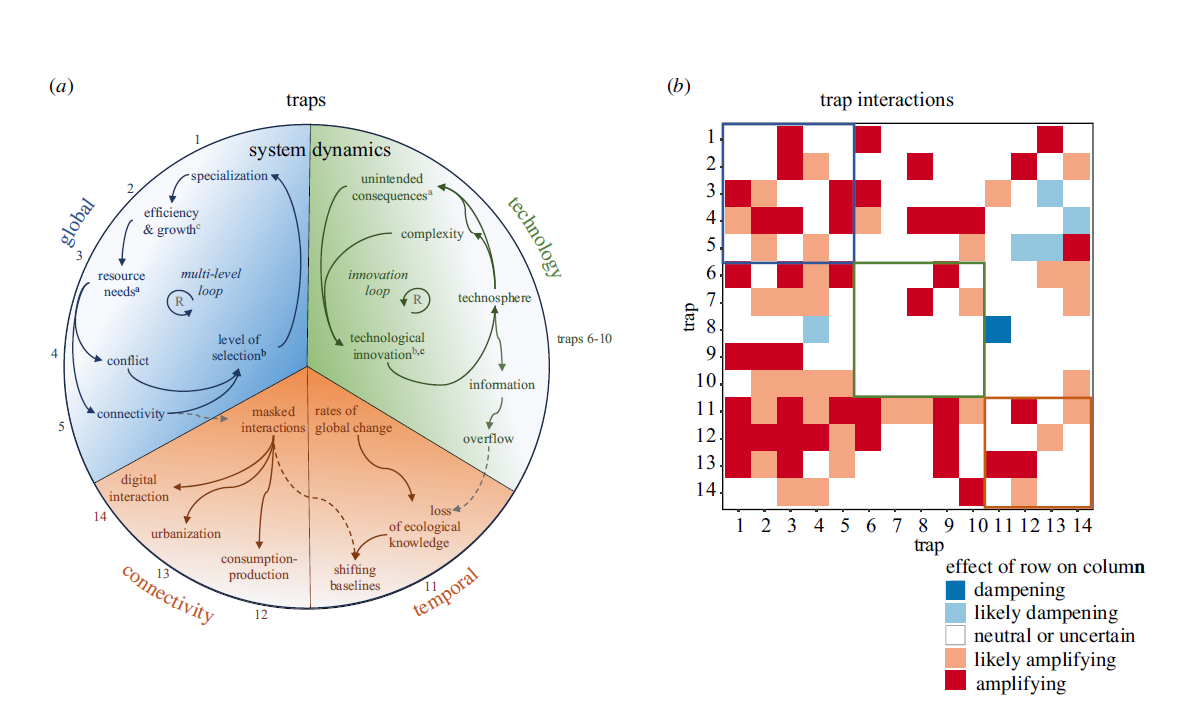
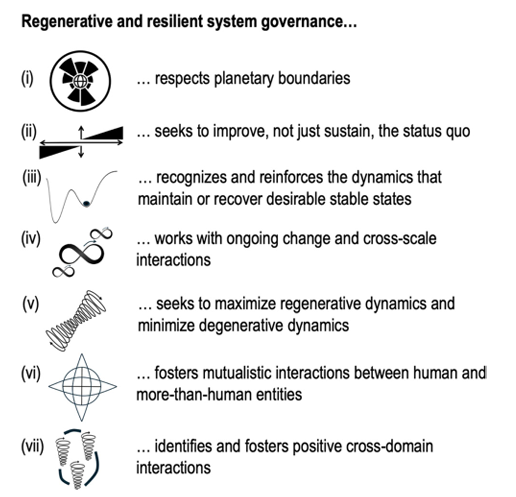
1066. Snails – metaphors of sustainable change (Saglietti et al., 2026)
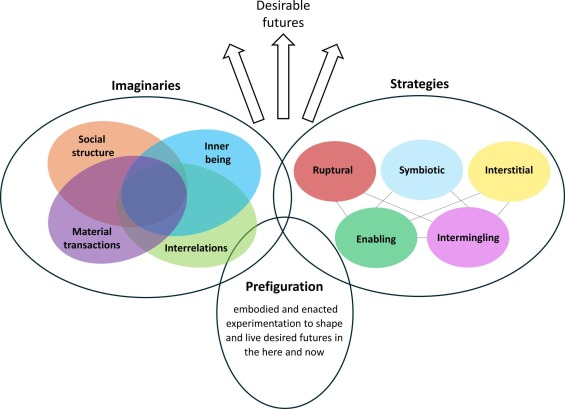
1067. Socio-ecological niche construction (Dorninger et al., 2023)
The extended industrial social-ecological niche construction framework. The temporal dimension is extended by a spatial dimension to capture interdependencies with spatially distant niches. The effects of accessing the lithosphere for non-renewables are indicated for all niches, however they differ for current and future generations. Curly brackets in blue indicate potential sustainability issues emerging from industrial niche construction: indicated as potential injustices within current generations (intra-generational injustice), between current and future generations (inter-generational justice), as well as human and non-human species (interspecies justice). Note that spatial and temporal distance is indicated by smaller-sized system ovals.
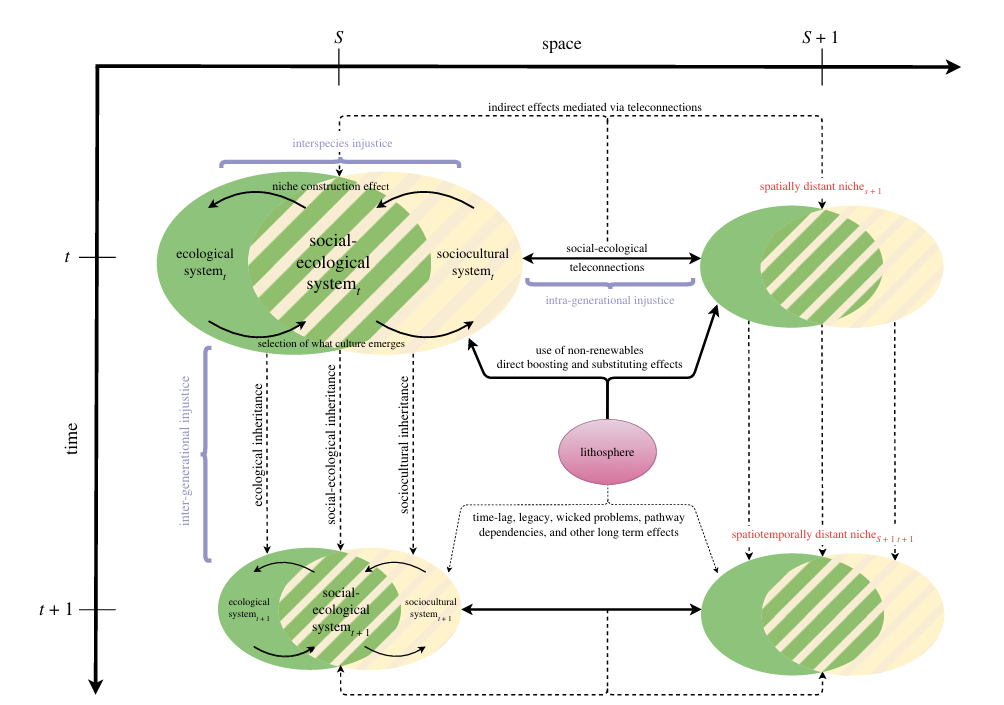
1068. Transformative system change in society-nature relationships (Orr and Burch, 2025)
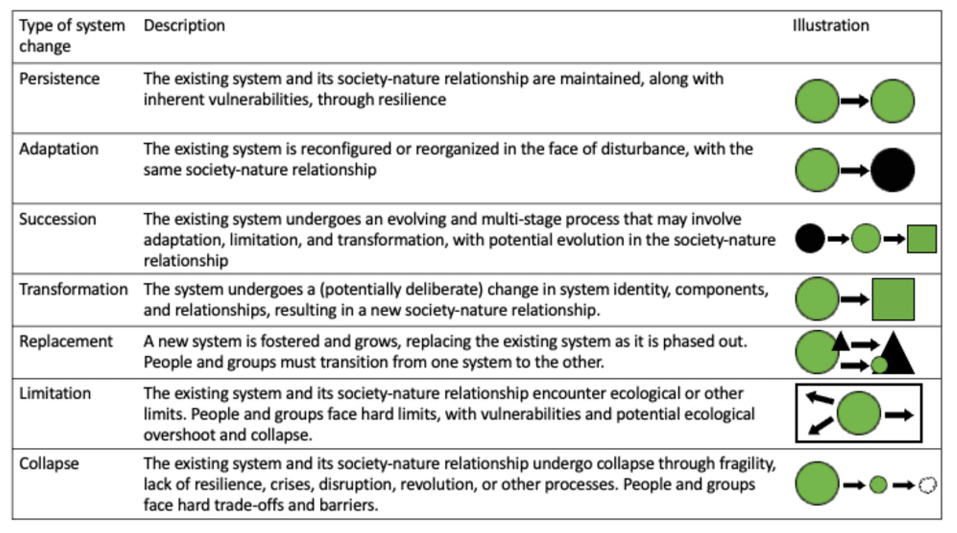
1069. Leveraging regenerative discourses for transformation (Gordon et al., 2021)
(Included because I think it applies beyond agriculture).
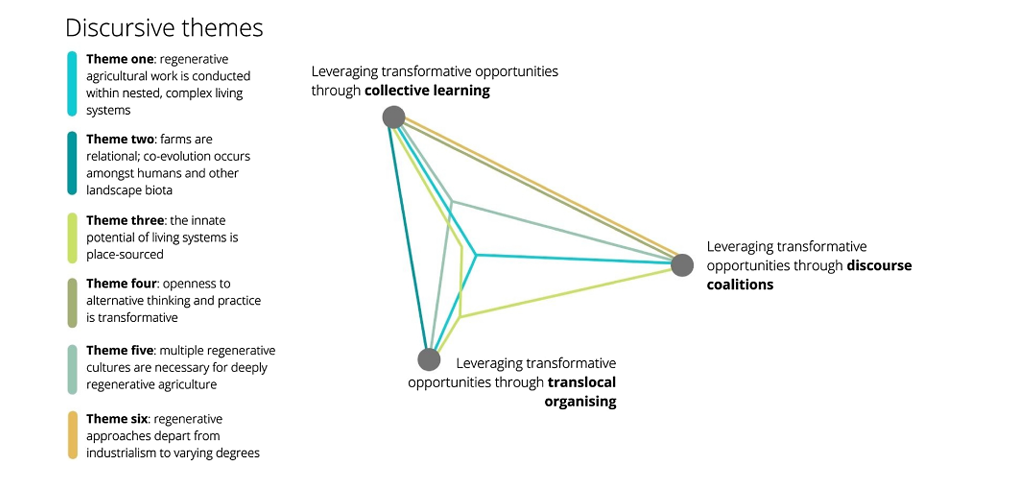
1070. Different themes in regnerative agriculture (Gordon et al. 2023)
(ditto)
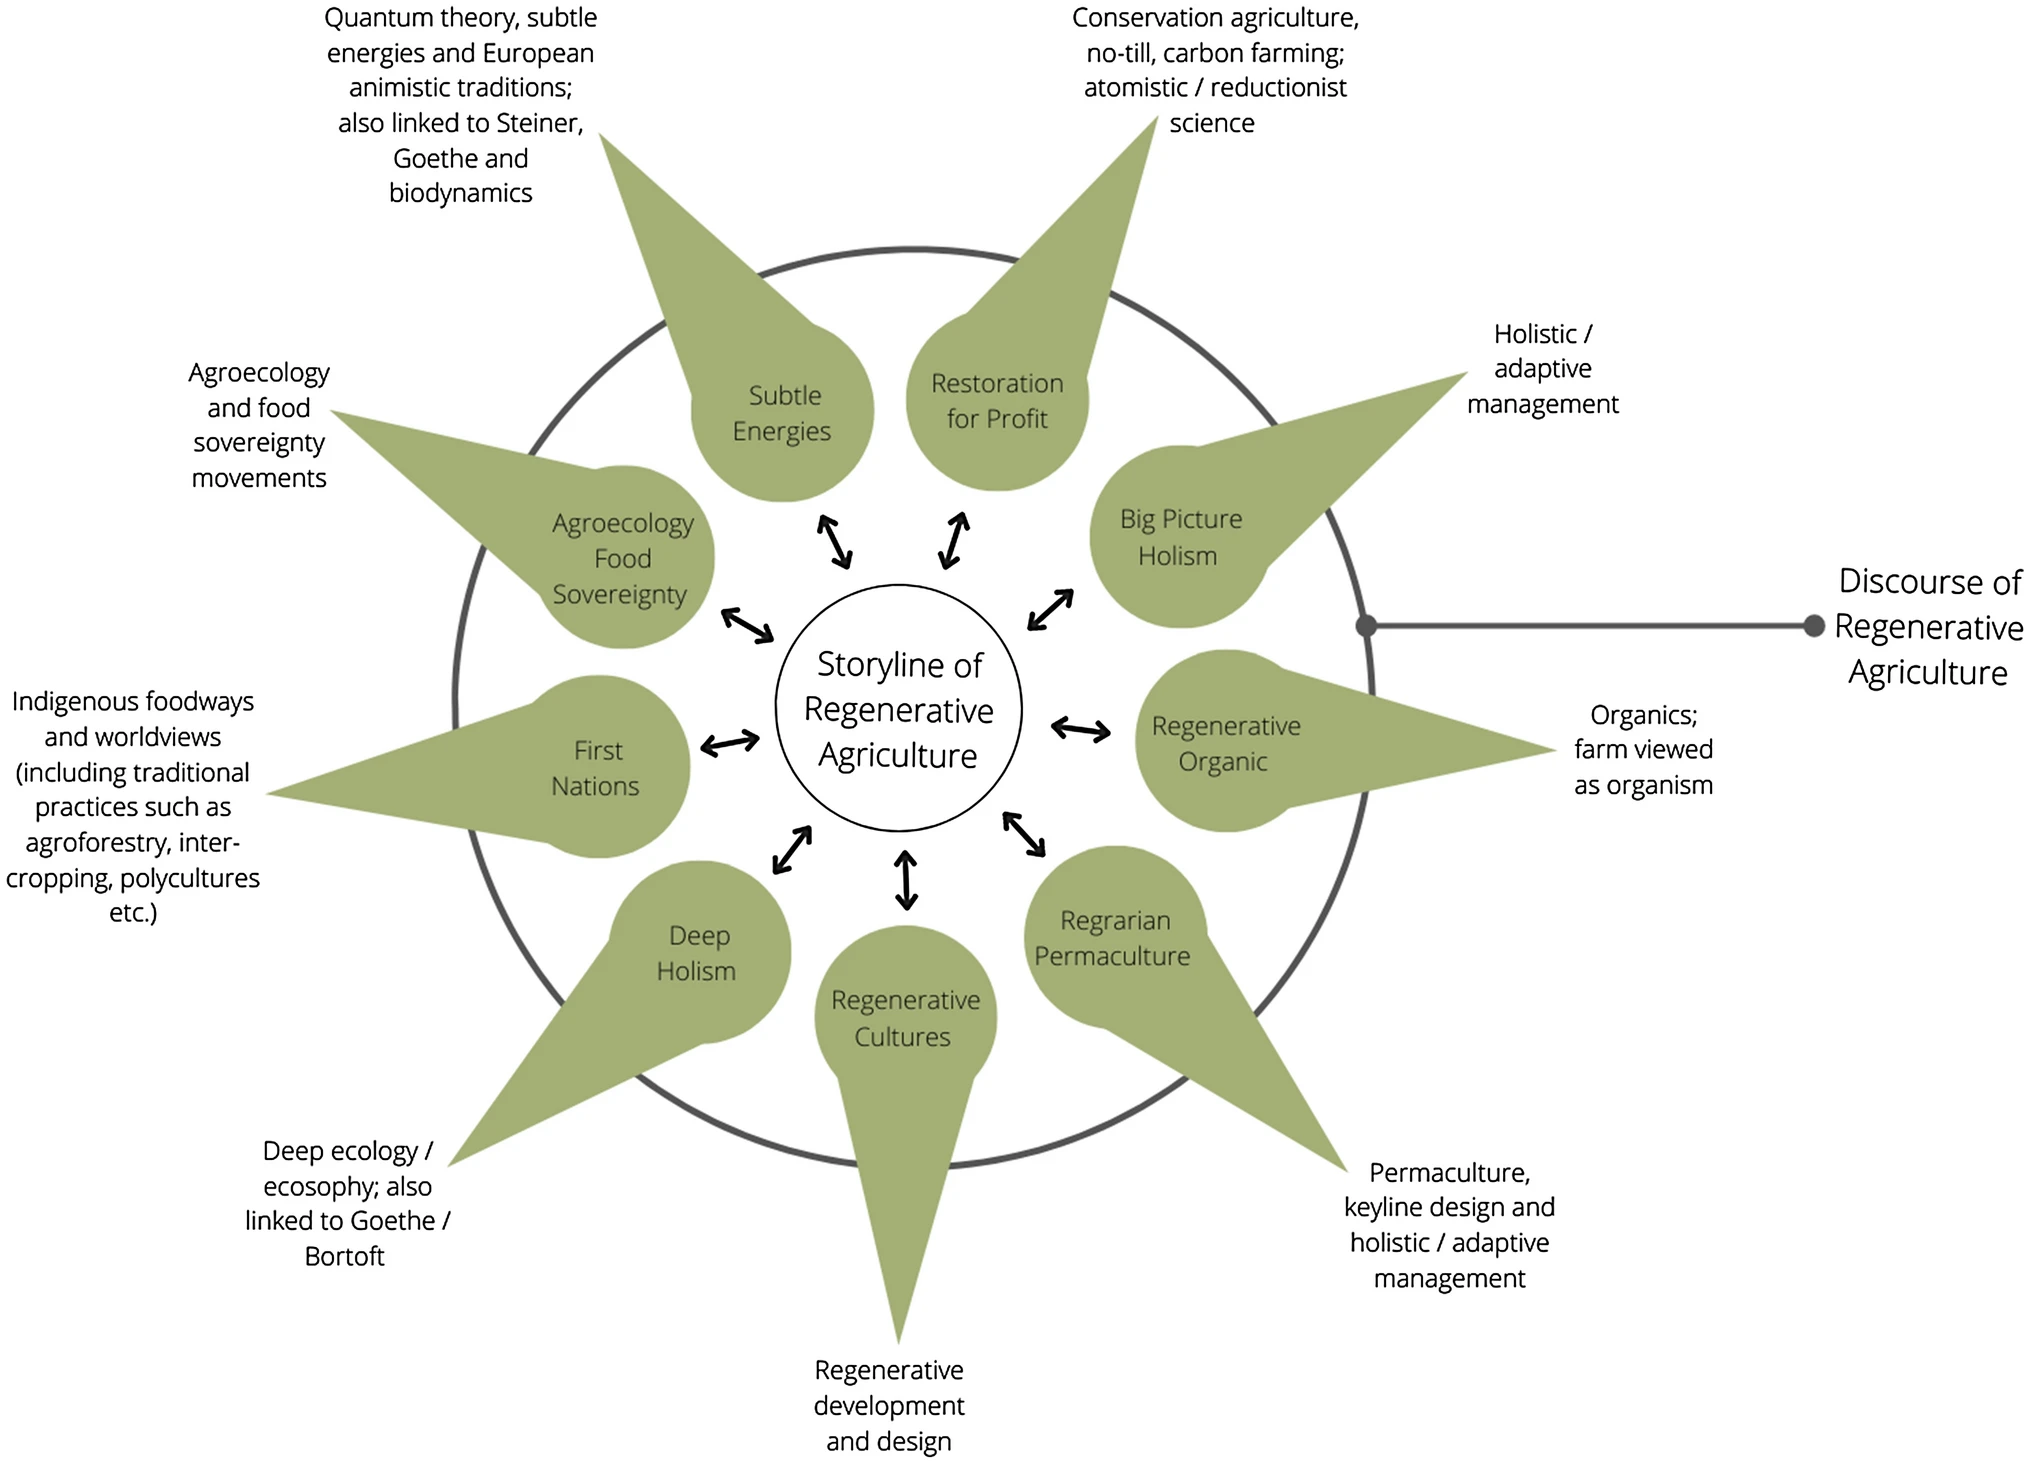
1071. A relational sphere of influence framework for disaster resilience with transformative pathways for sustainability (Davis et al. 2024, Says is after Naito 2022 but doesn’tlook like it to me)
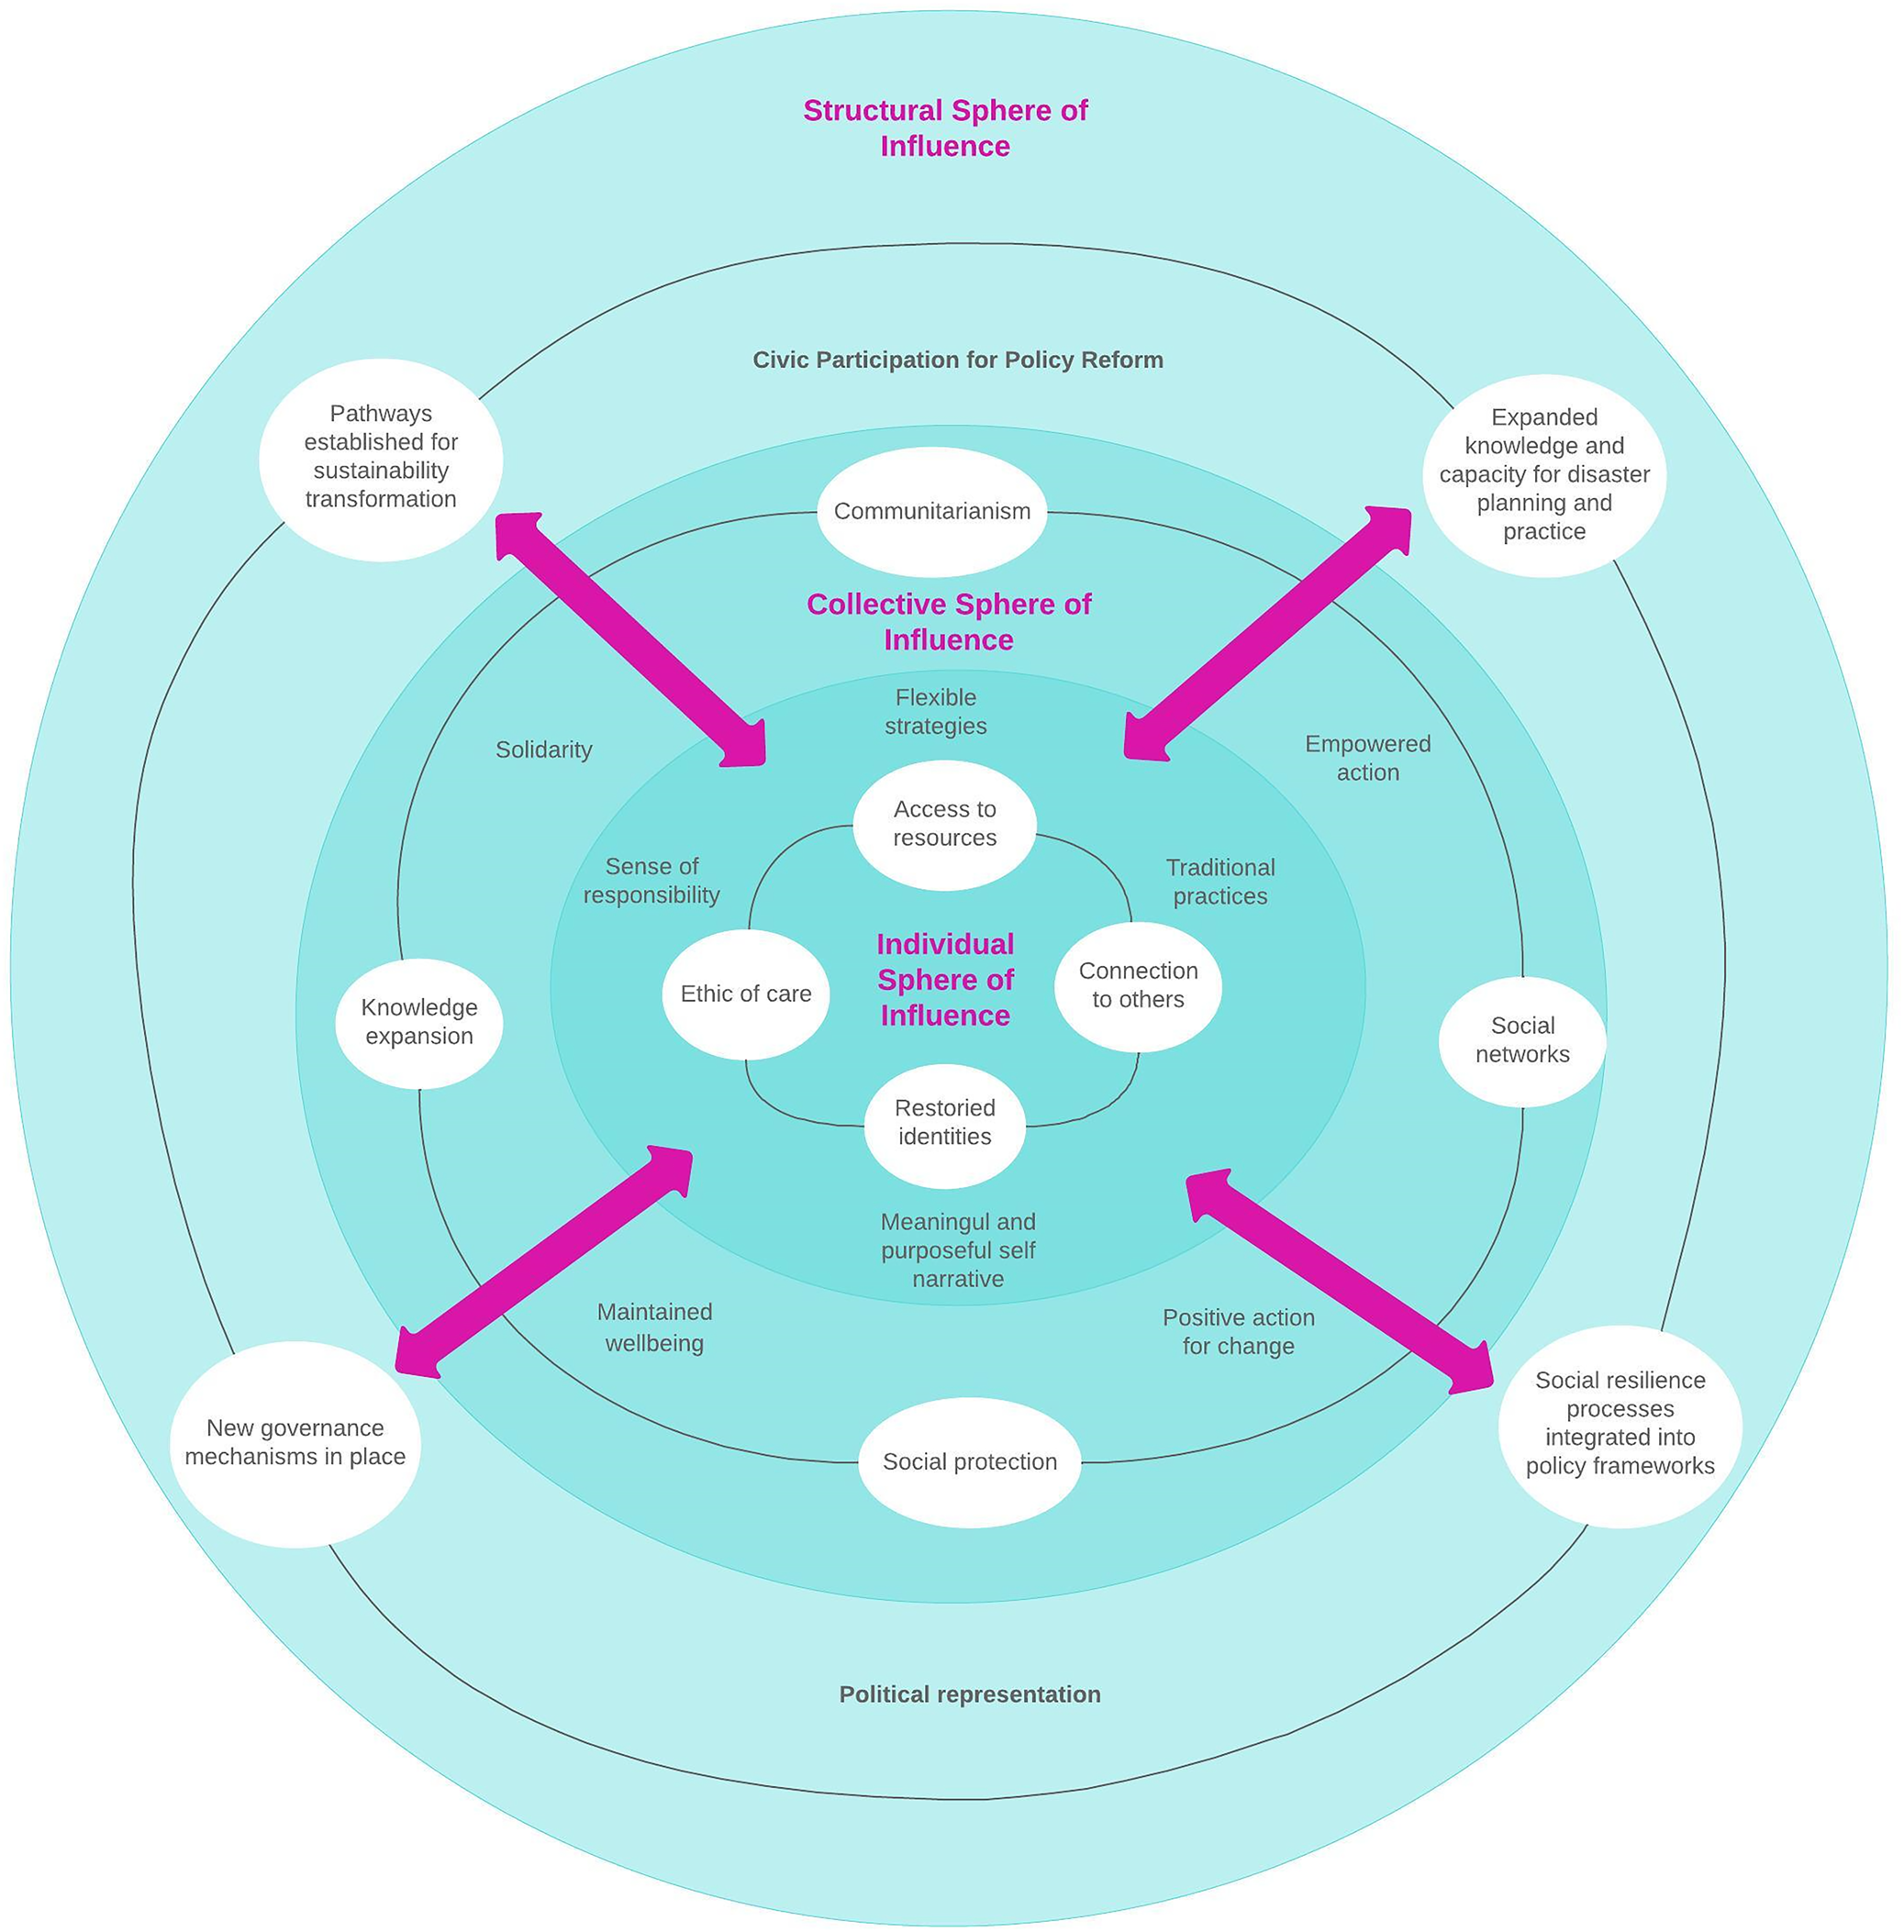
1072. Complex Adaptive Systems theory with Service-Dominant logic resulting in a triple helix (Saviano et al., 2025)
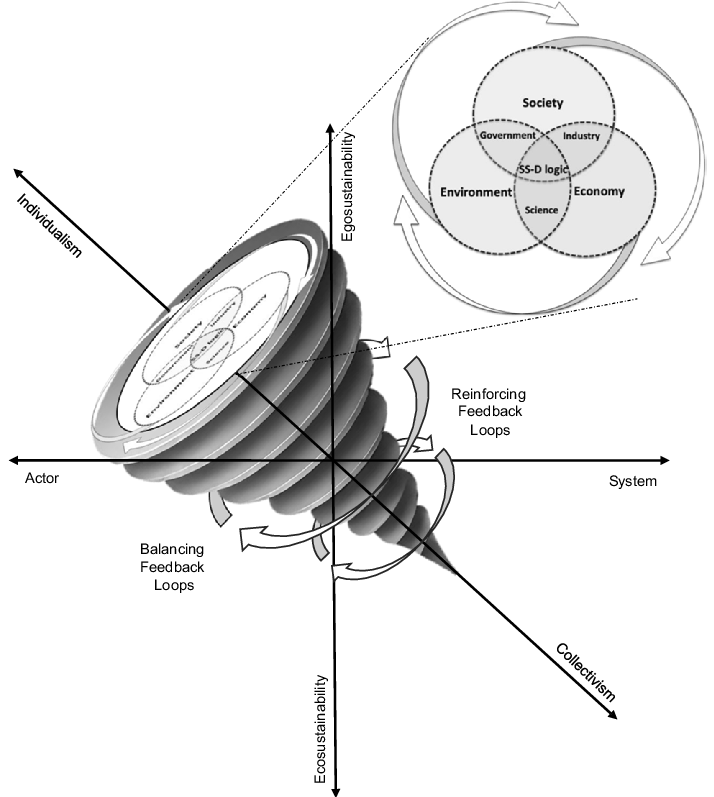
1073. Ubuntu Su Stana Bi Lit y (van Norren 2020)
Abstract Being (Bu) and Life Force Being (Ntu): u-Bu-Ntu underlying all things. Ki-Ntu/Bi-Ntu
(nature), Ha-Ntu (time&space), Ku-Ntu (quality), Mu-Ntu/Ba-Ntu (people)
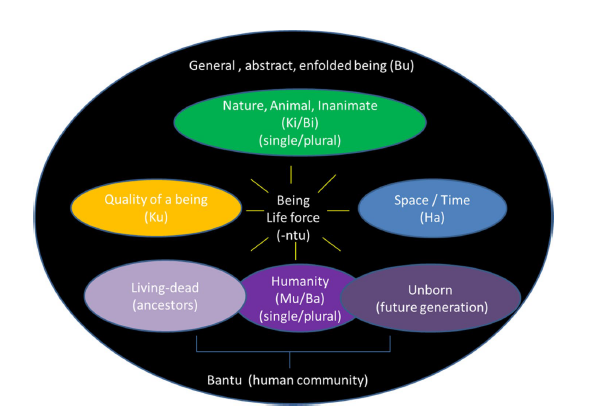
1074. Ubale Ubuntu (Khomba, 2024)
(A relationship-based model over a strong sustainability?)
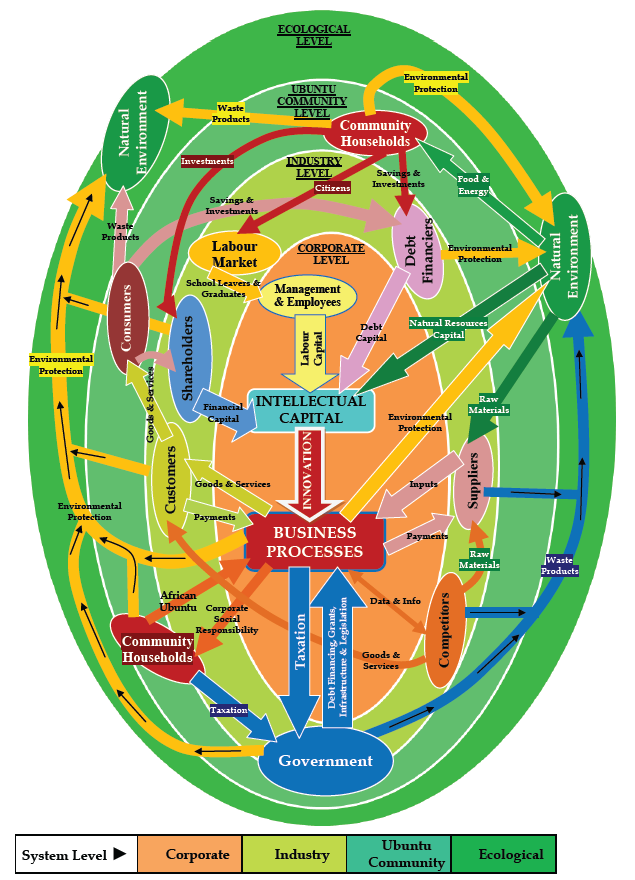
1075. Ecuadorian Buen Vivir wisdom is contained in the Andean cross (Van Norren 2020)
Balancing the inner, current and upper world, corresponding with emphatic care (heart), work (hands) and wisdom (head) (integrality); departing from families within communities and regions, which pray to (and respect) nature, sun and moon, and Great Spirit (relationality), while balancing the masculine and feminine in all life forms as complementary and living in reciprocity.
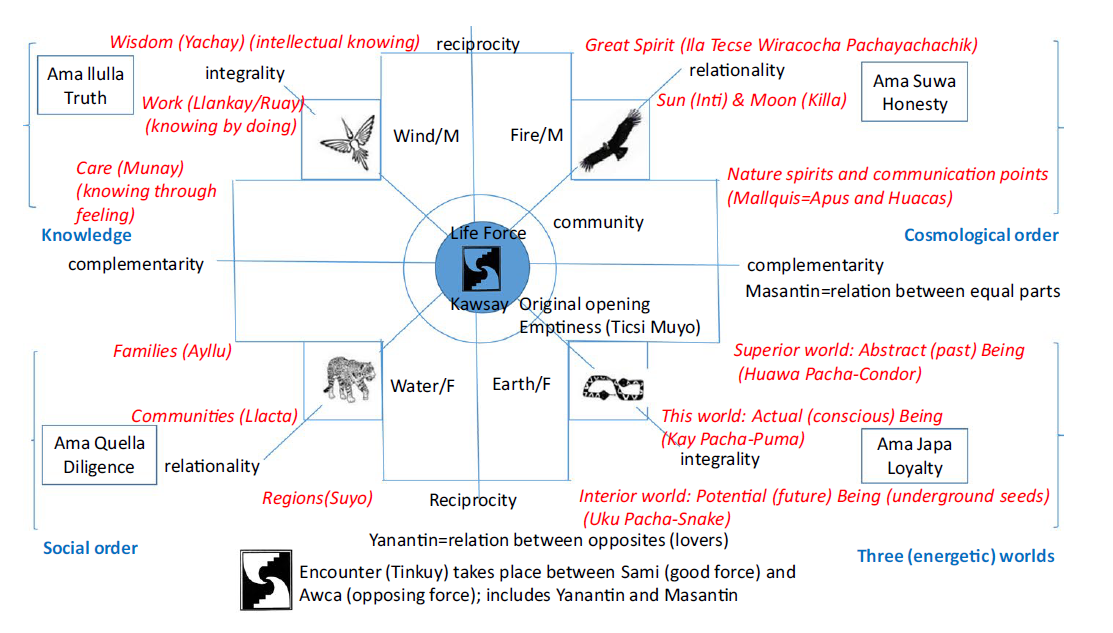
1076. The relational premise of Ubuntu Personhood (Kyei-Nuamah and Peng, 2024)
Ubuntugogy
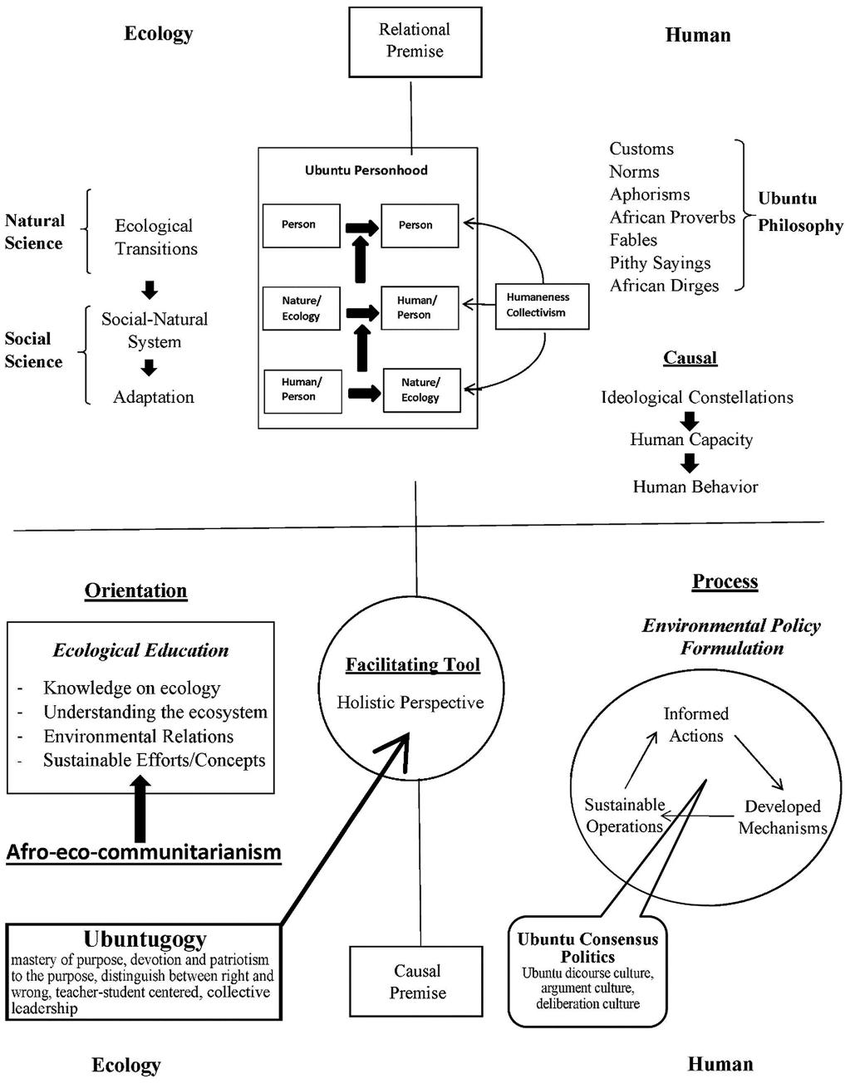
1076. More-than-human solidarity (Tschakert, 2022)
Heuristic for an inclusive, more-than-human-solidarity, with four types of encounters to engage with Distant and Unknown Others beyond familiar and valued Known Others, with increasing levels of recognition and commitment. The further away from the Self and the Known Other, not just in physical distance but in our ability to engage across difference, the greater the effort needed to enact empathy and responsibility.
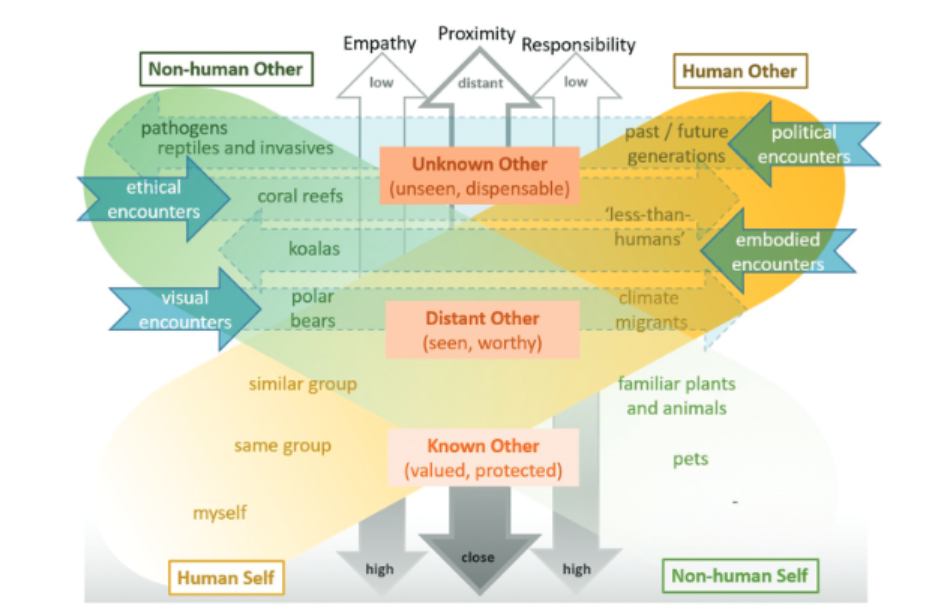
1077. Strongly multispecies (Ruppreecht et al., 2020)
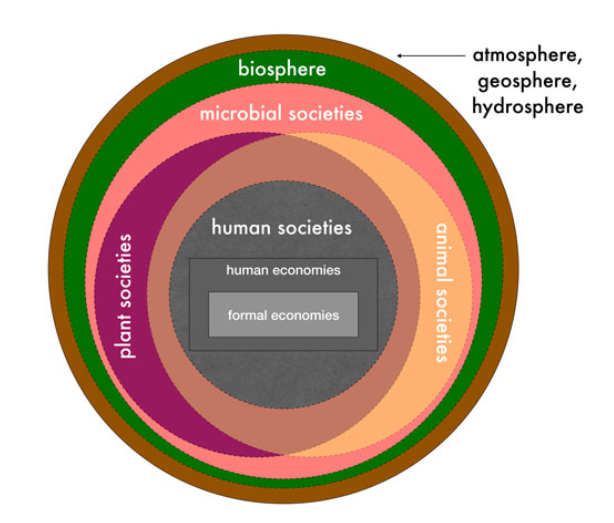
1078. Definition by scenario (Ruppreecht et al., 2020)
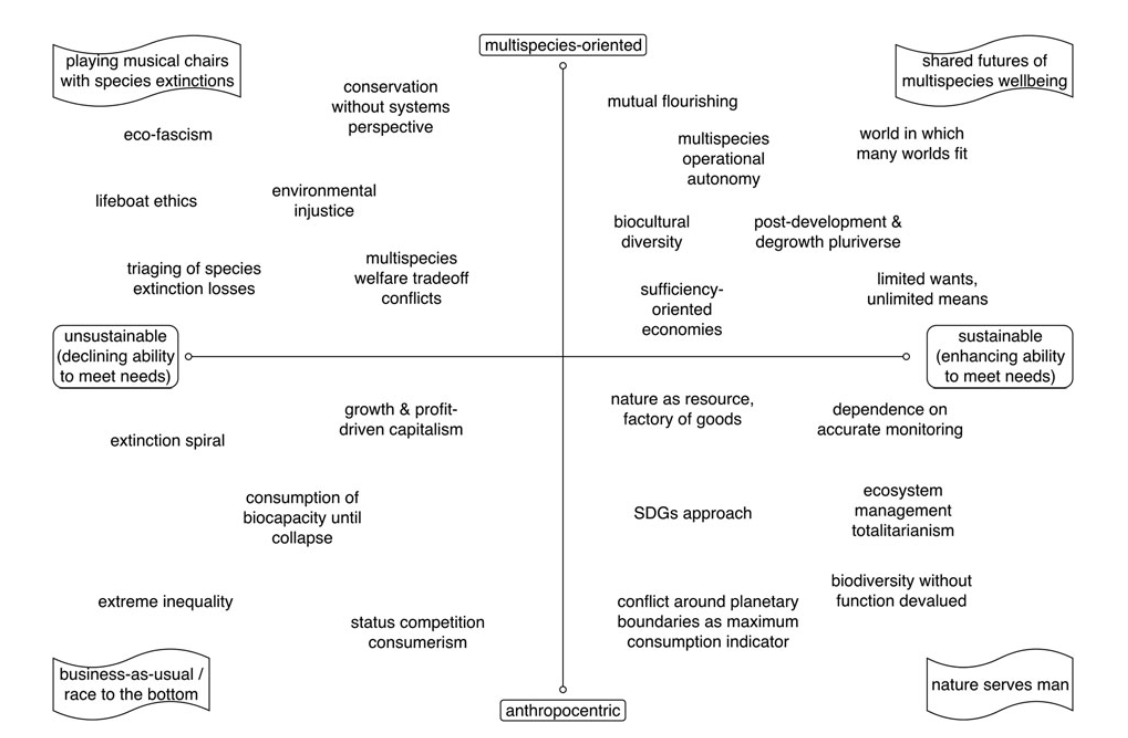
1079. Tetrahedra and Logics of sustainability (Janschitz and Zimmermann 2010)
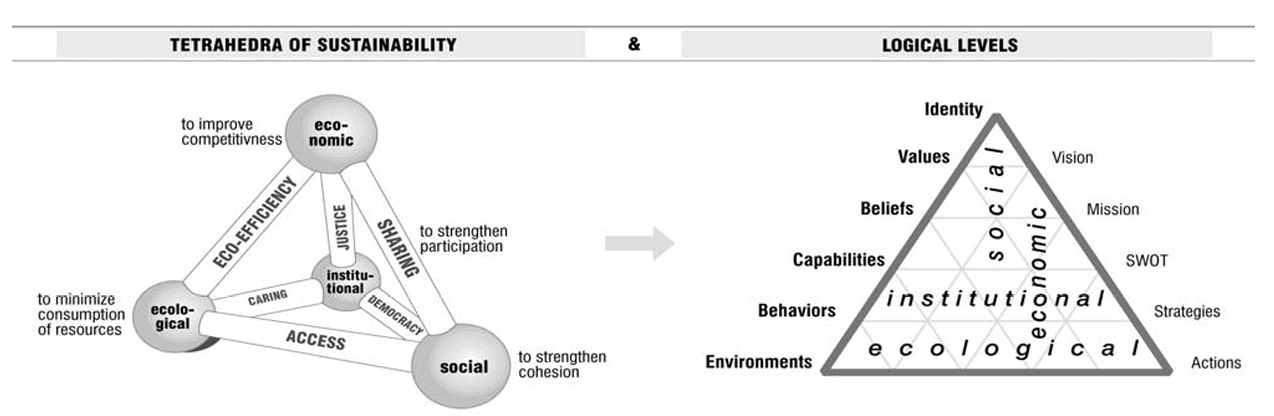
1080. Post-growth transitions (Bärnthaler et al., 2025)
The red ‘explosions’ highlight key conjunctural tensions that could drive regime shifts and serve as entry points for the next best steps.
(Defining sustainability by means of routes to get there, and the alternatives that it isn’t)
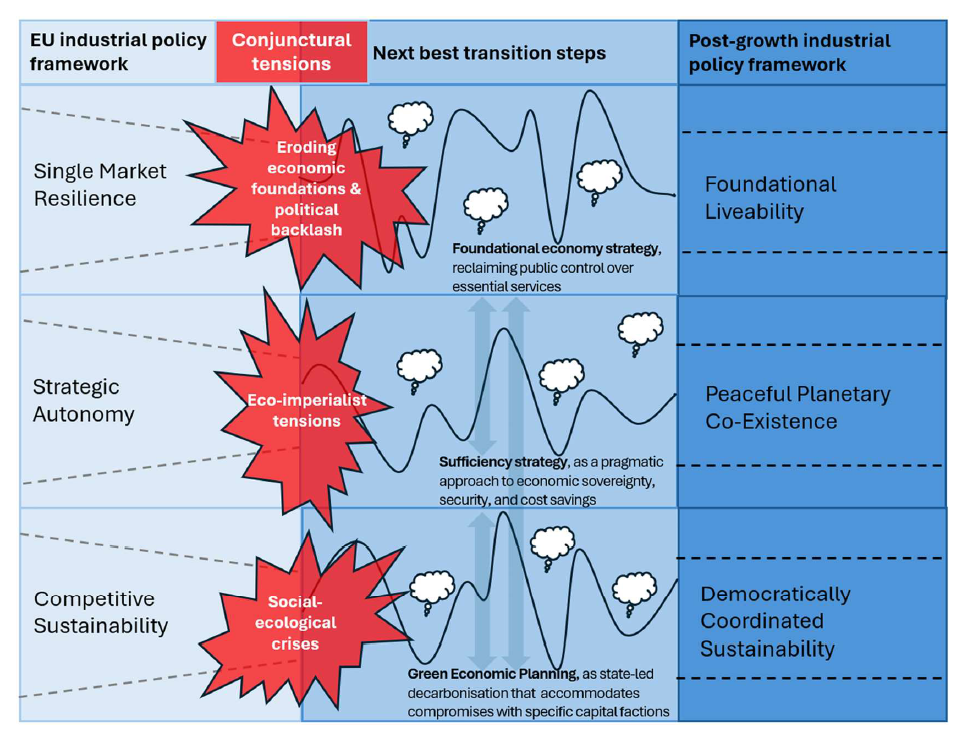
1081. Post Growth Toolkit – The Game (https://disnovation.org/pgtk_game.php)
Now look carefully at the game board: it presents “The 10 Pillars of Capitalism”, and each pillar is defined by a set of hashtags. In the center of the board, a “Virtuous Circle” offers counterpoints to each pillar….
To what extent does the Virtuous Circle in the center help you project your object (eg a metal screw, shipping container, wheat) into a desirable future?…
Let your imagination run wild and invent the new habits, relationships, experiences, and interests that this absence,or radical transformation, would allow.
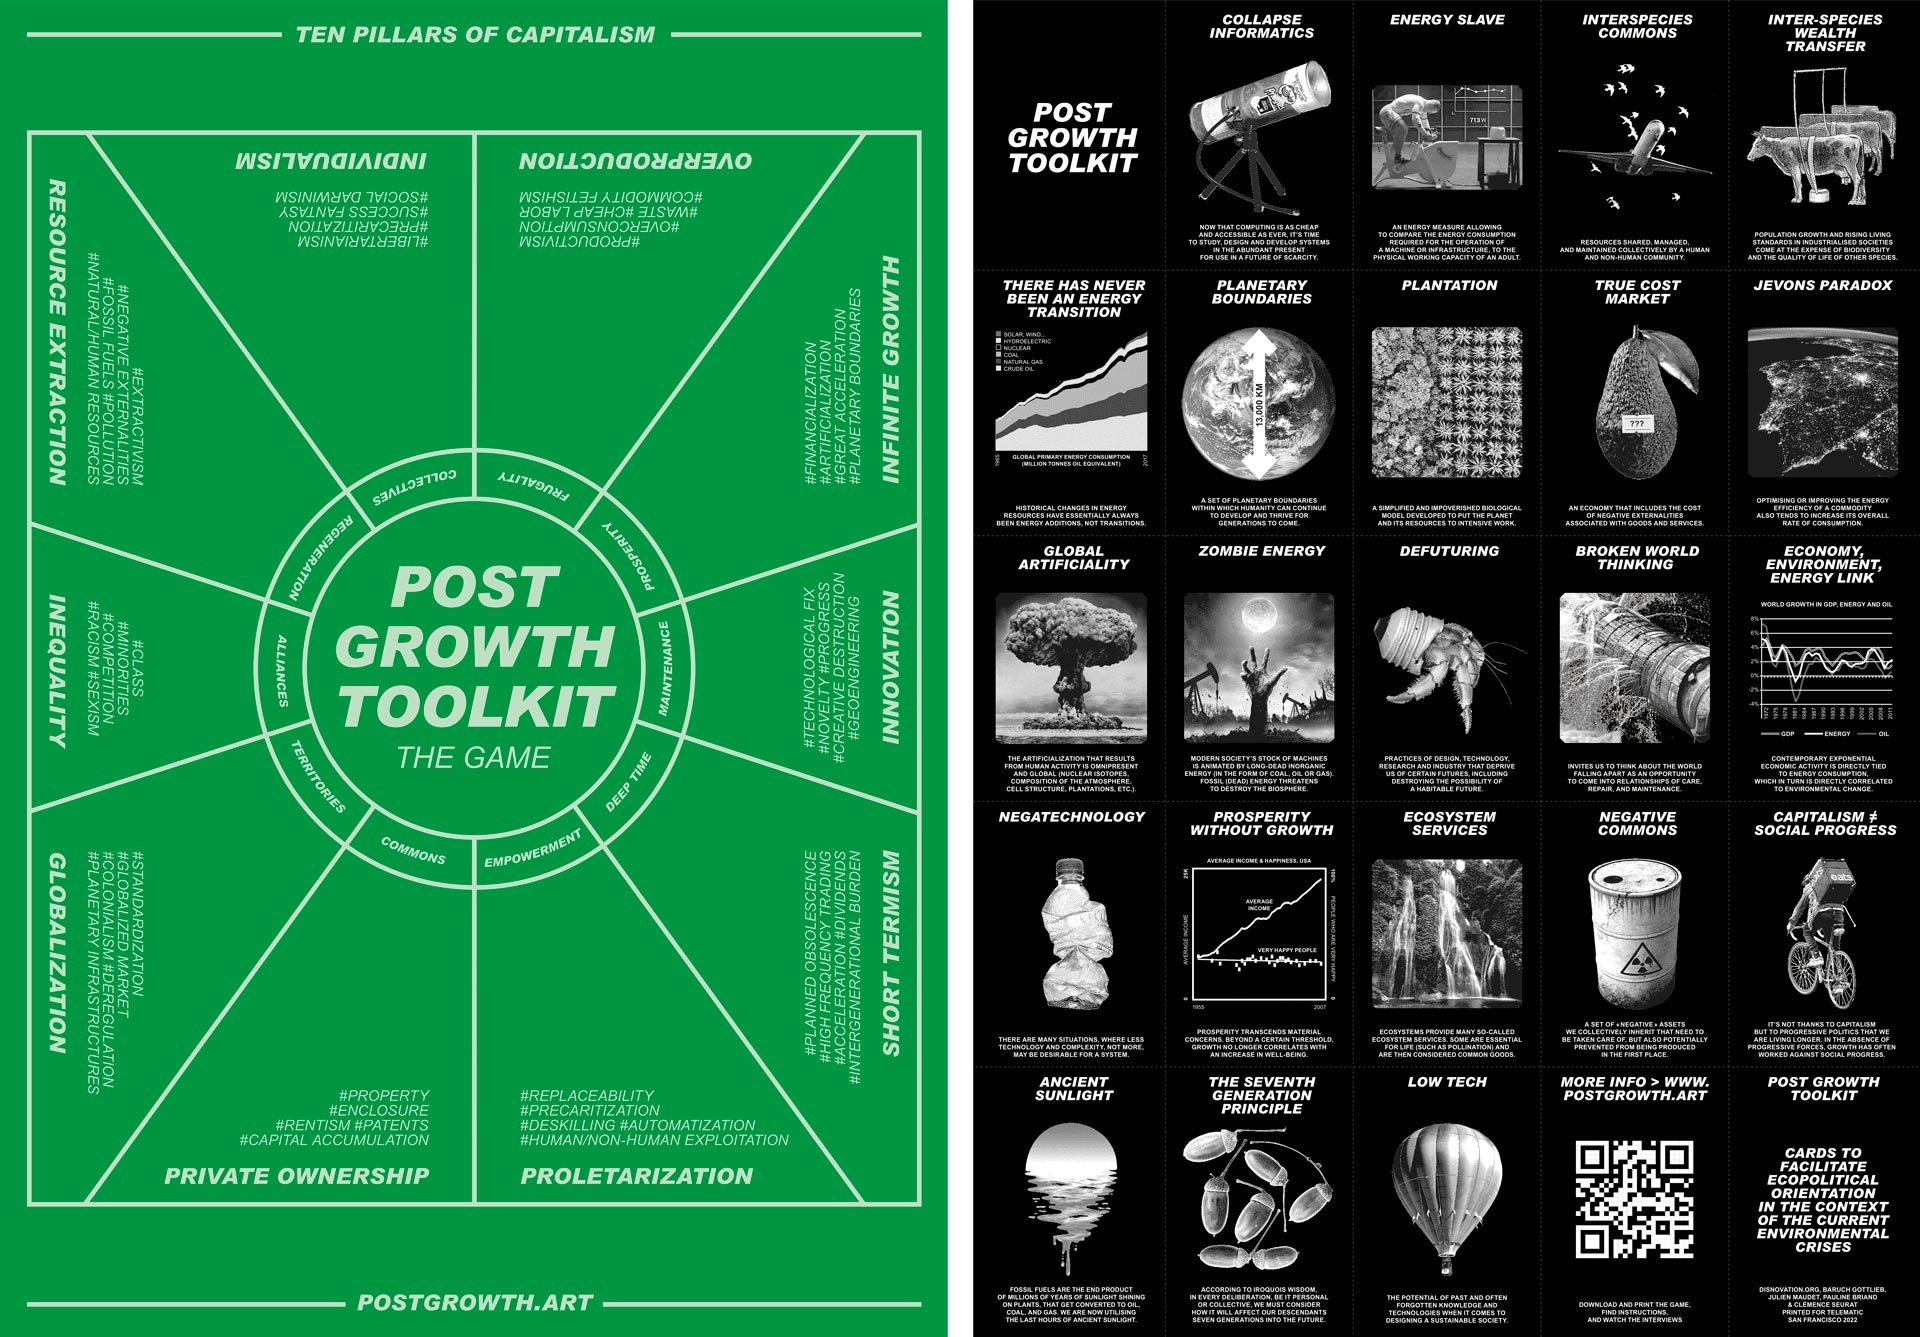
1082. Sustainability cubed (McGreevy et al., 2026)
Socio-spatial post-growth transformation strategies. Dark cubes indicate intersections of three aspects: transformational (left), social (bottom), and spatial (bottom right).
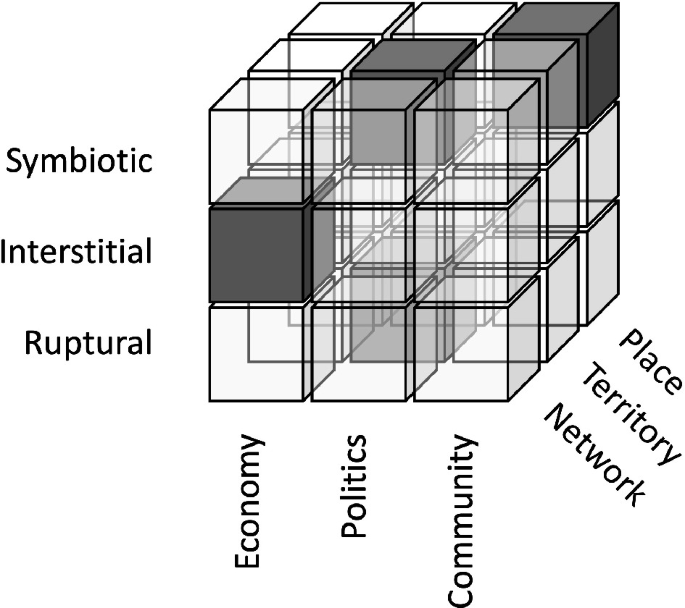
1083. Periodic Table of Sustainability (Akepa)
Is the table arrangement offering additional levels of understanding? Not really. Fun though, so it’s in.
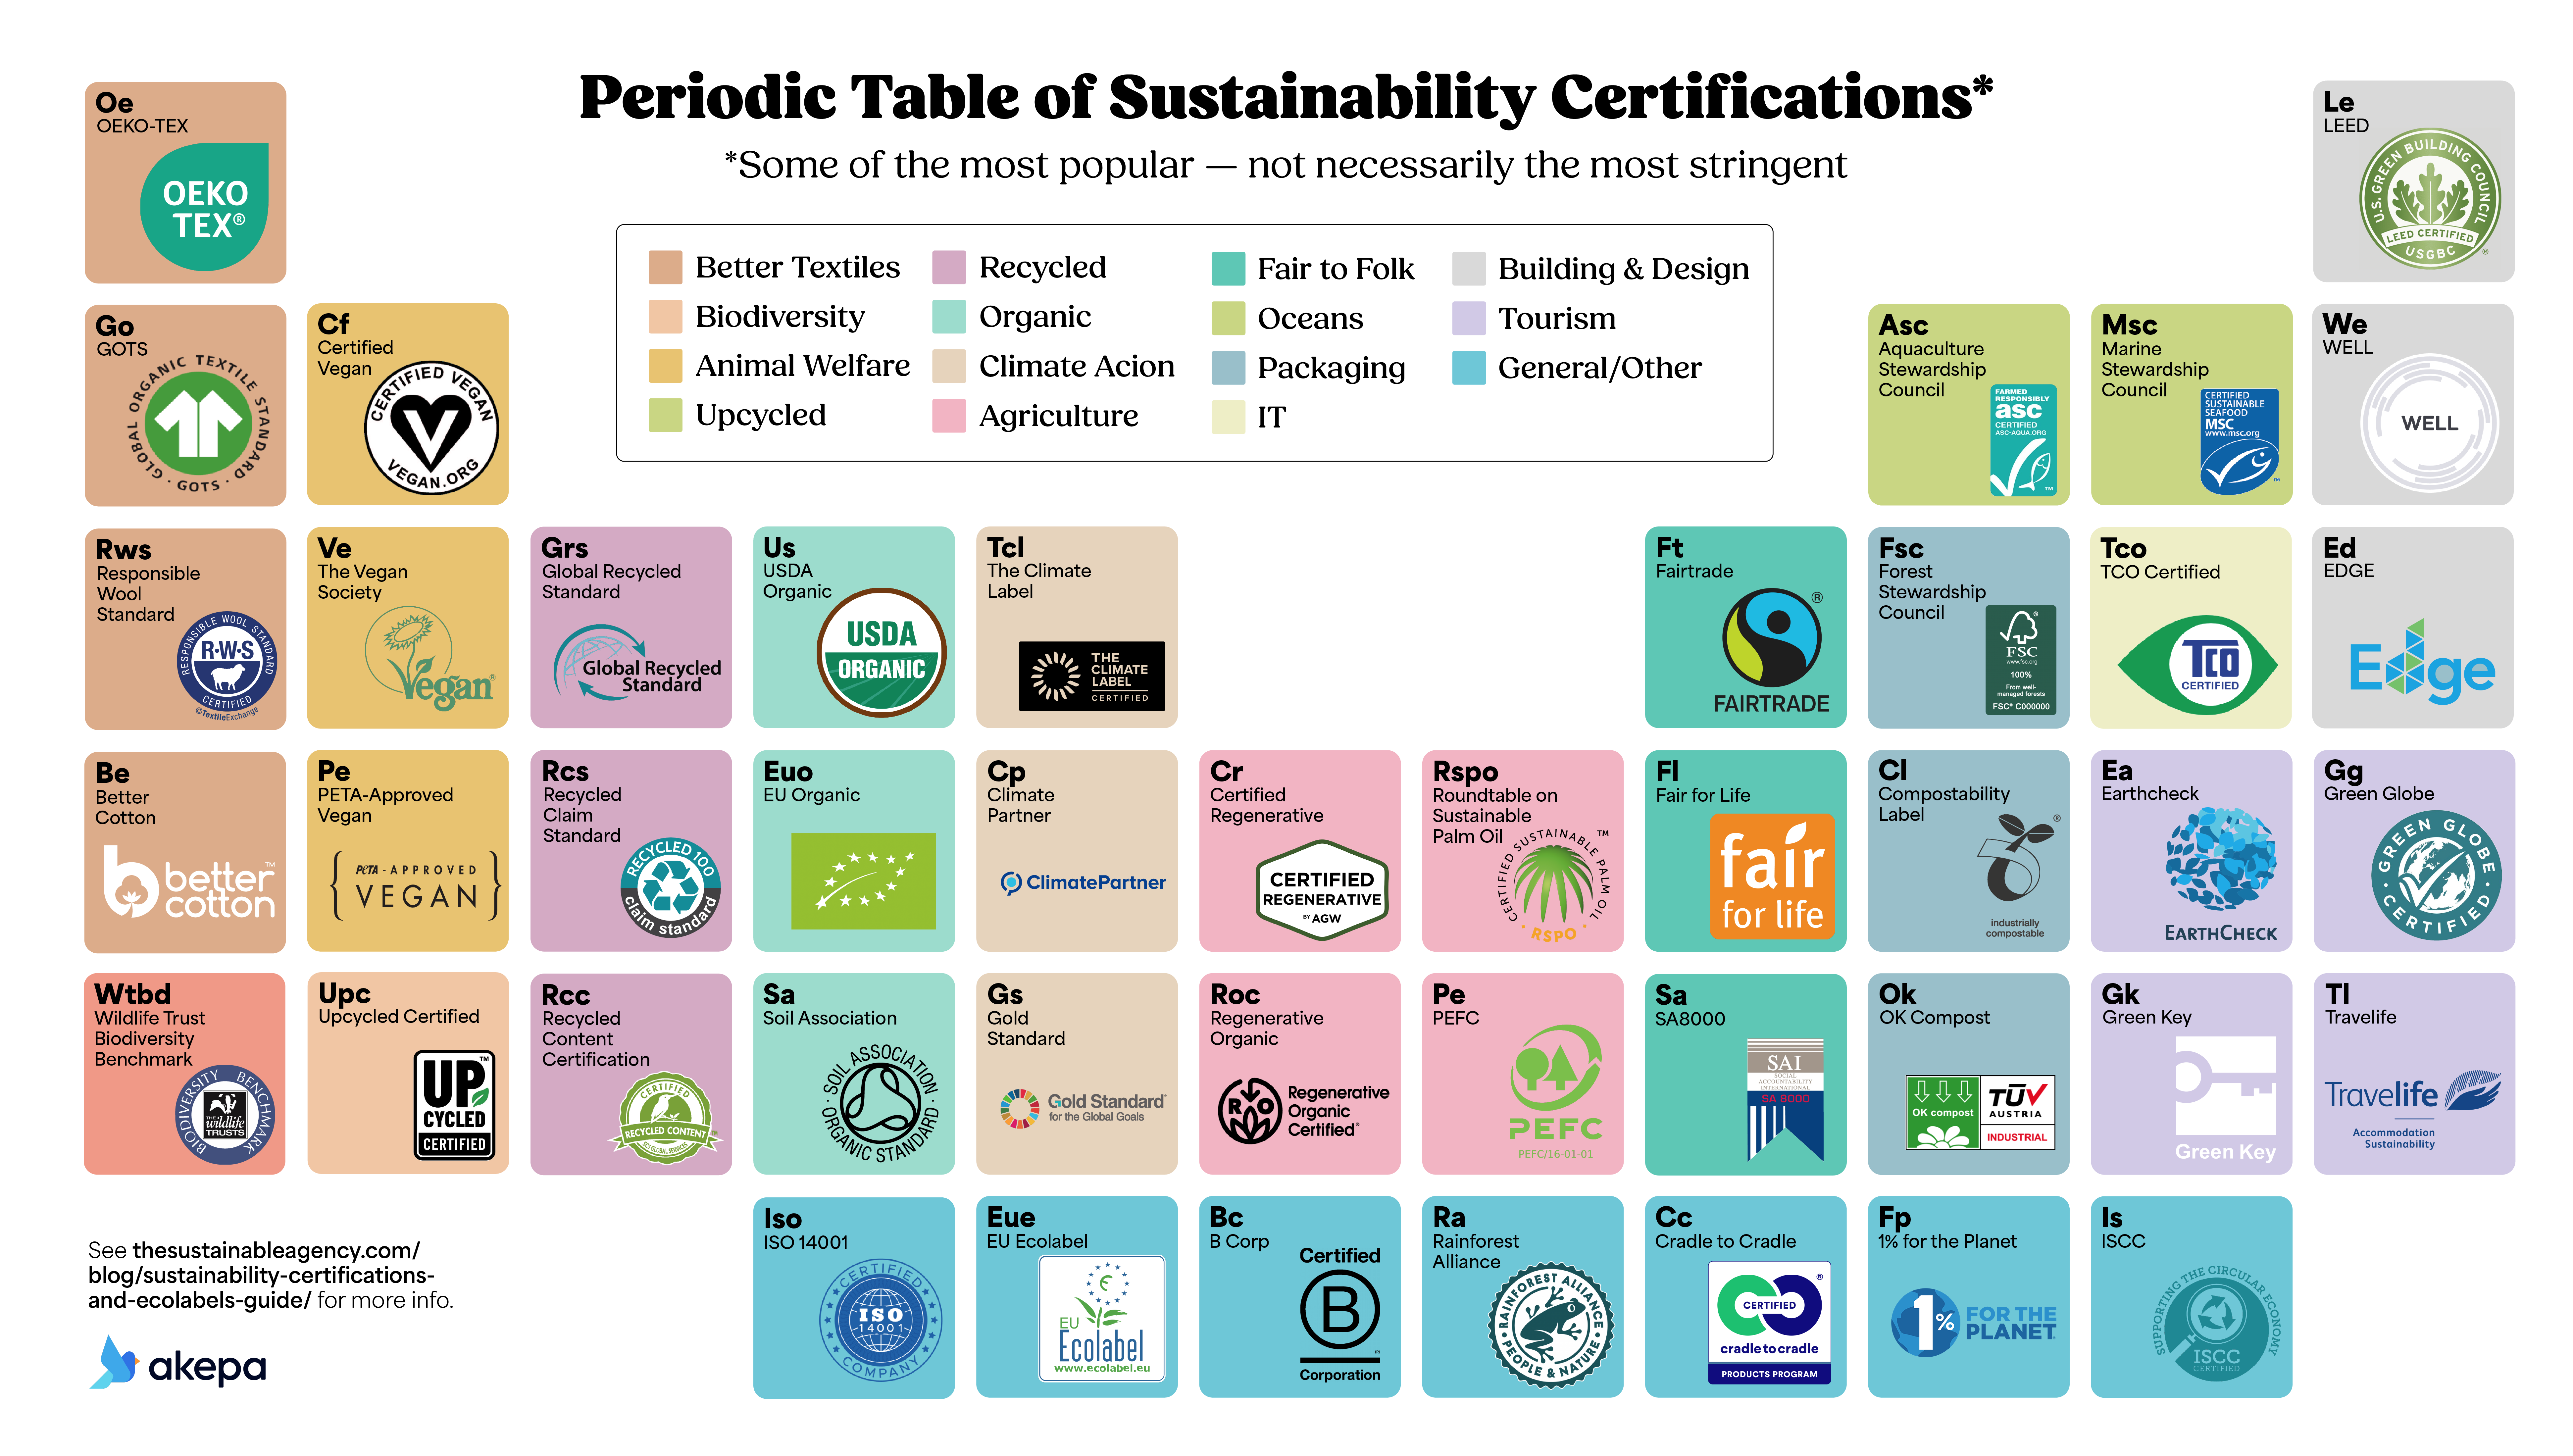
1084. Antifragile (Willshire, 2023)
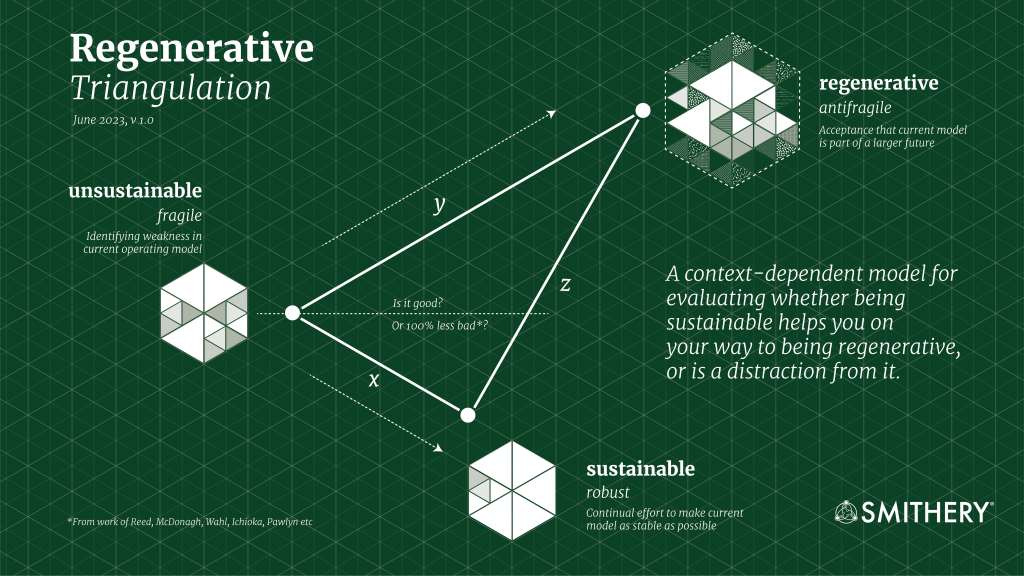
1085. Spirals of development (Beck and Roemischer, 2002)
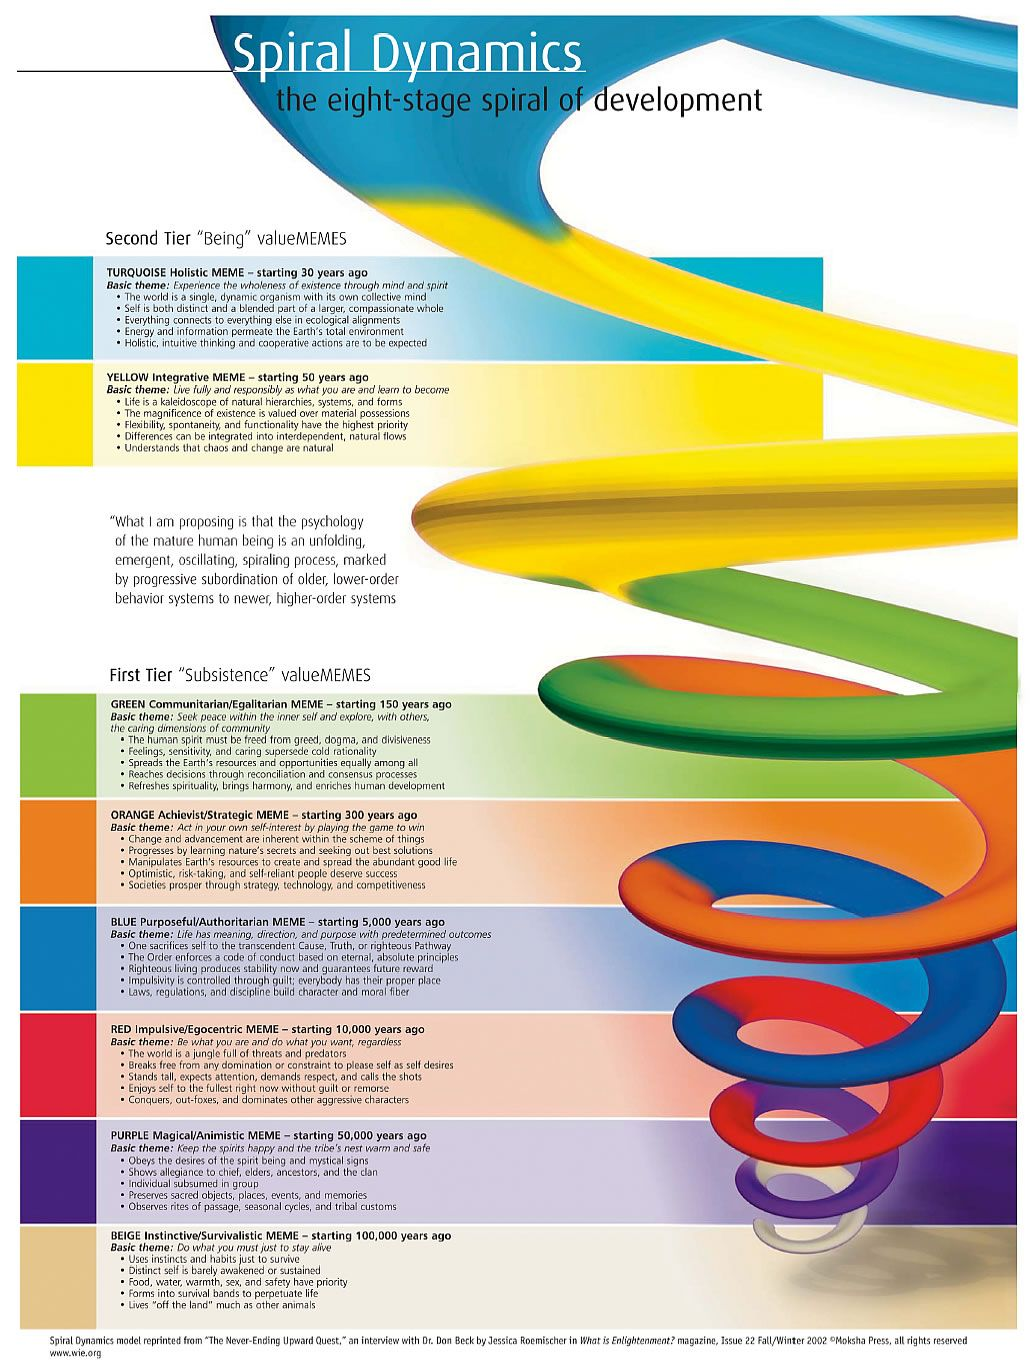
1086. Regenerative thriving forever (https://regenerativemanaging.com/)
1087. Regenerative framework (Roggema and Junco, 2024)
(The paper has a sequenced build)
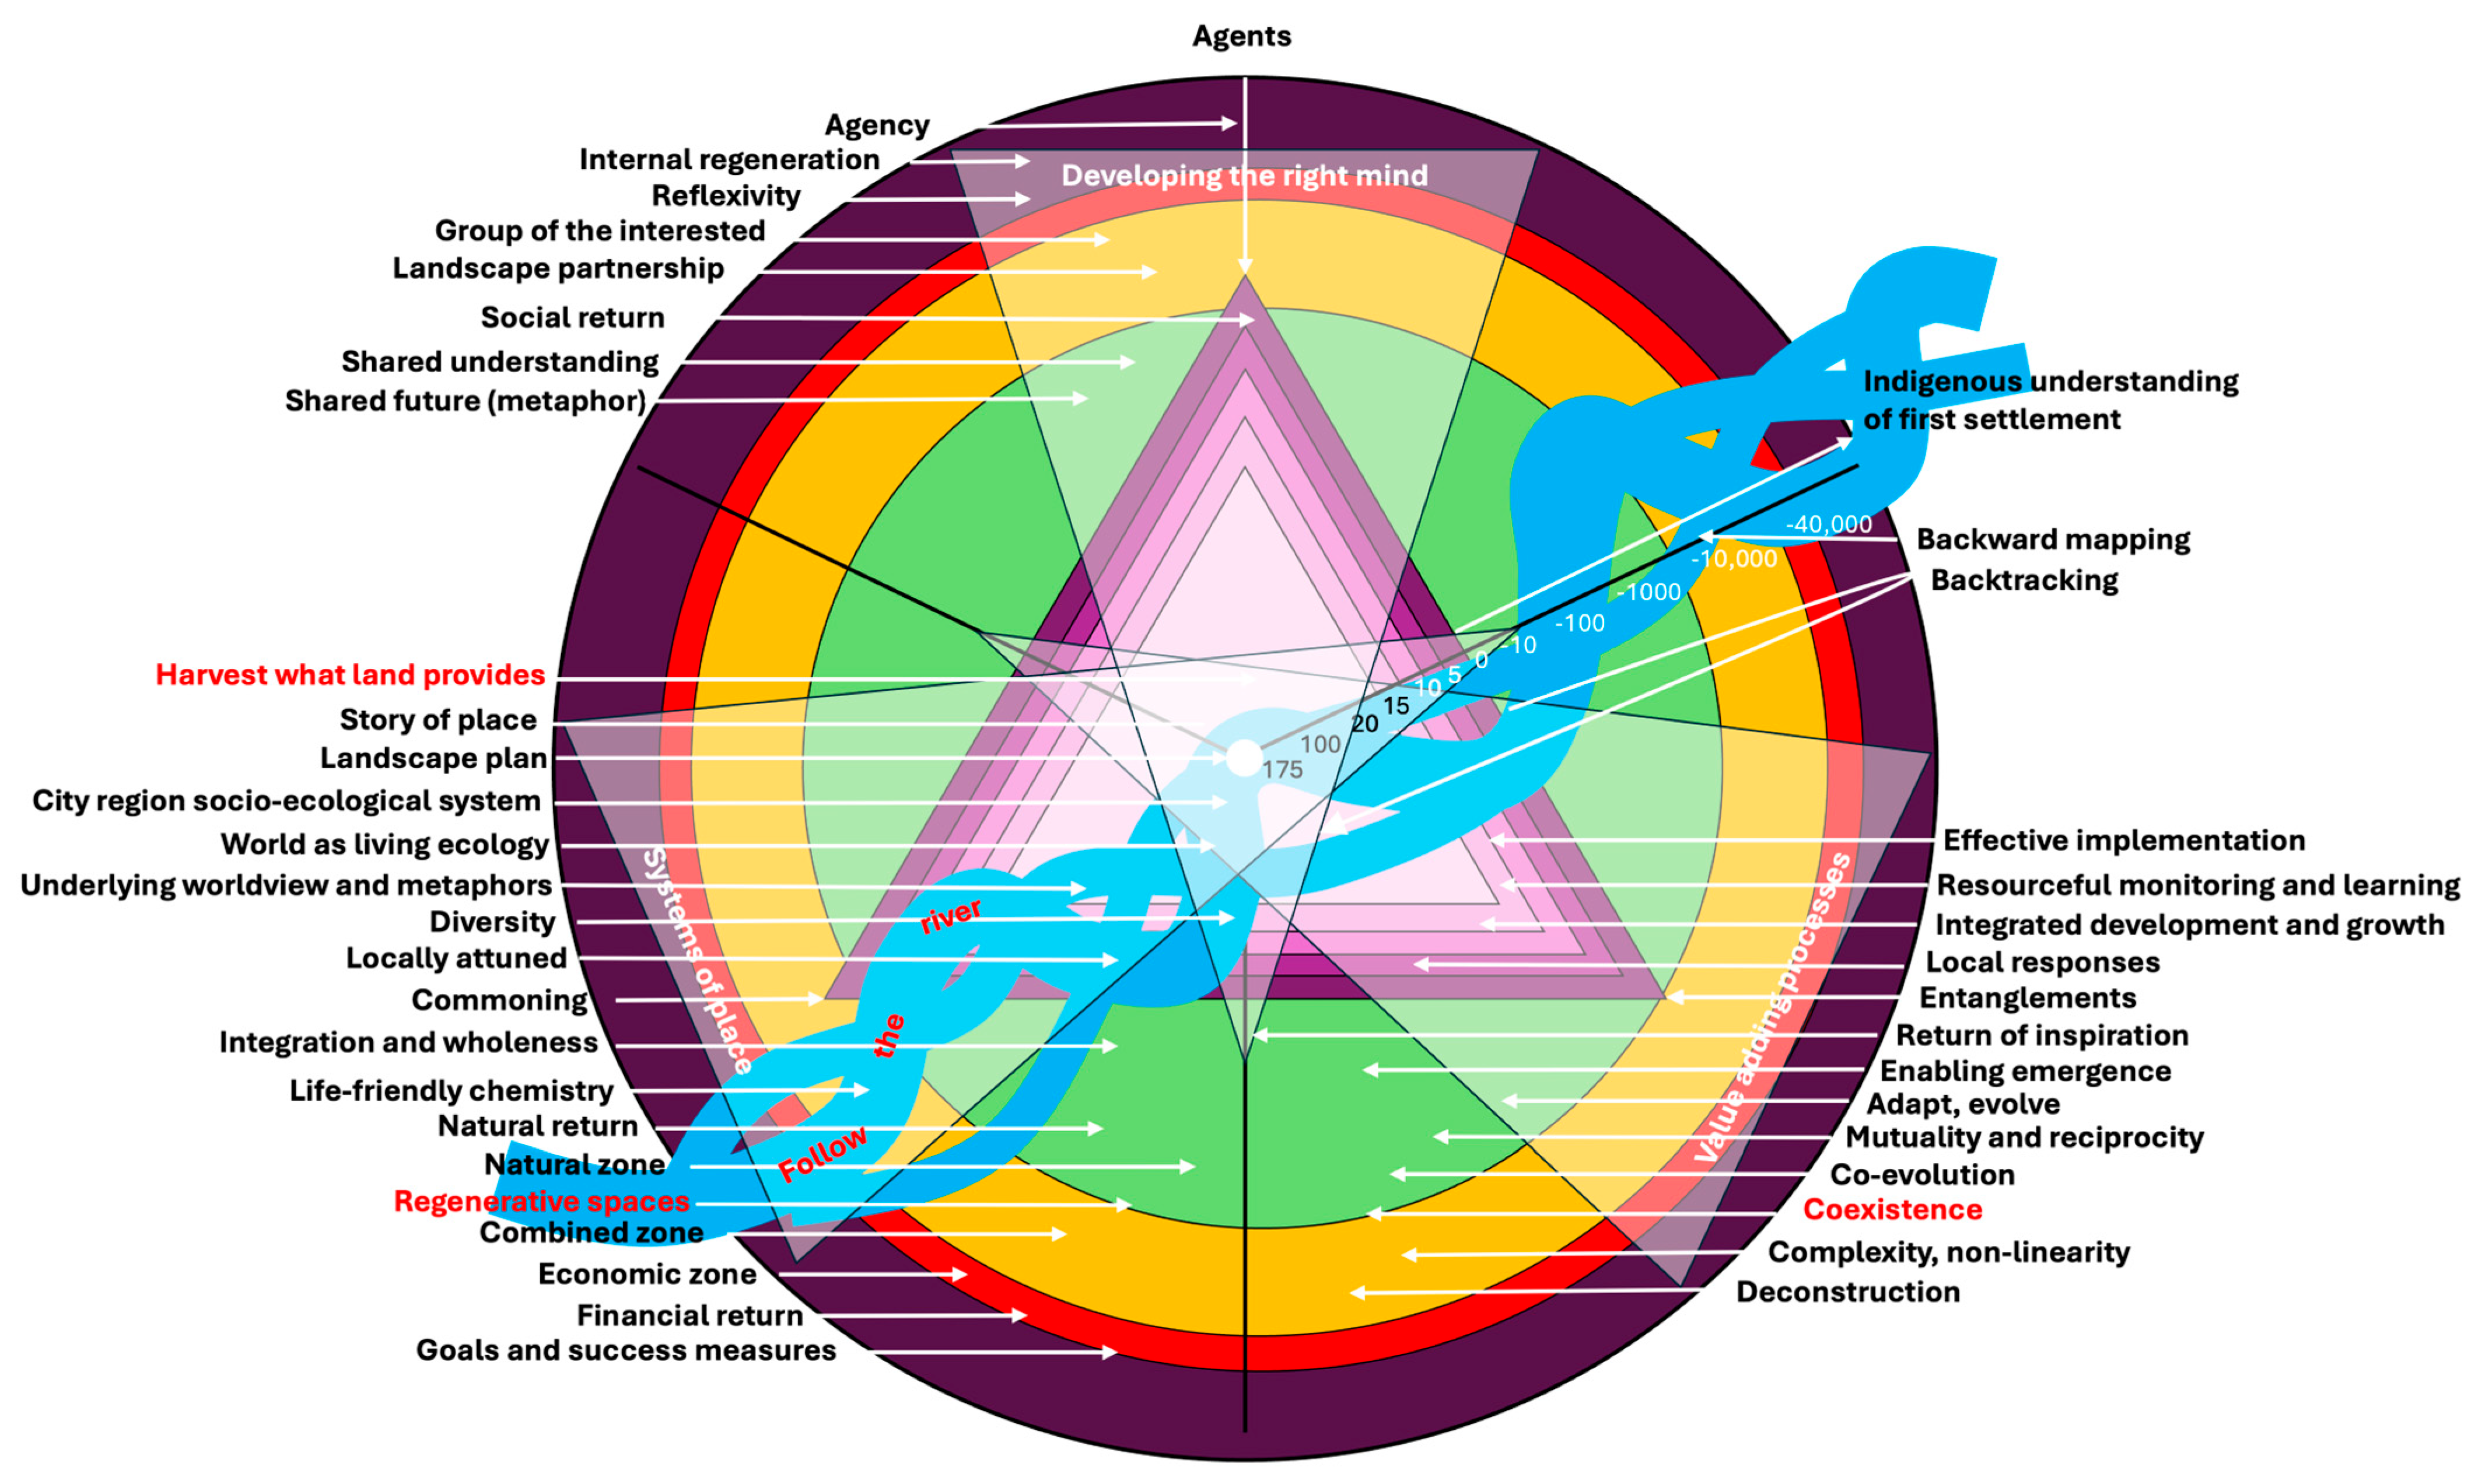
Taking off a layer so it is easier to read:
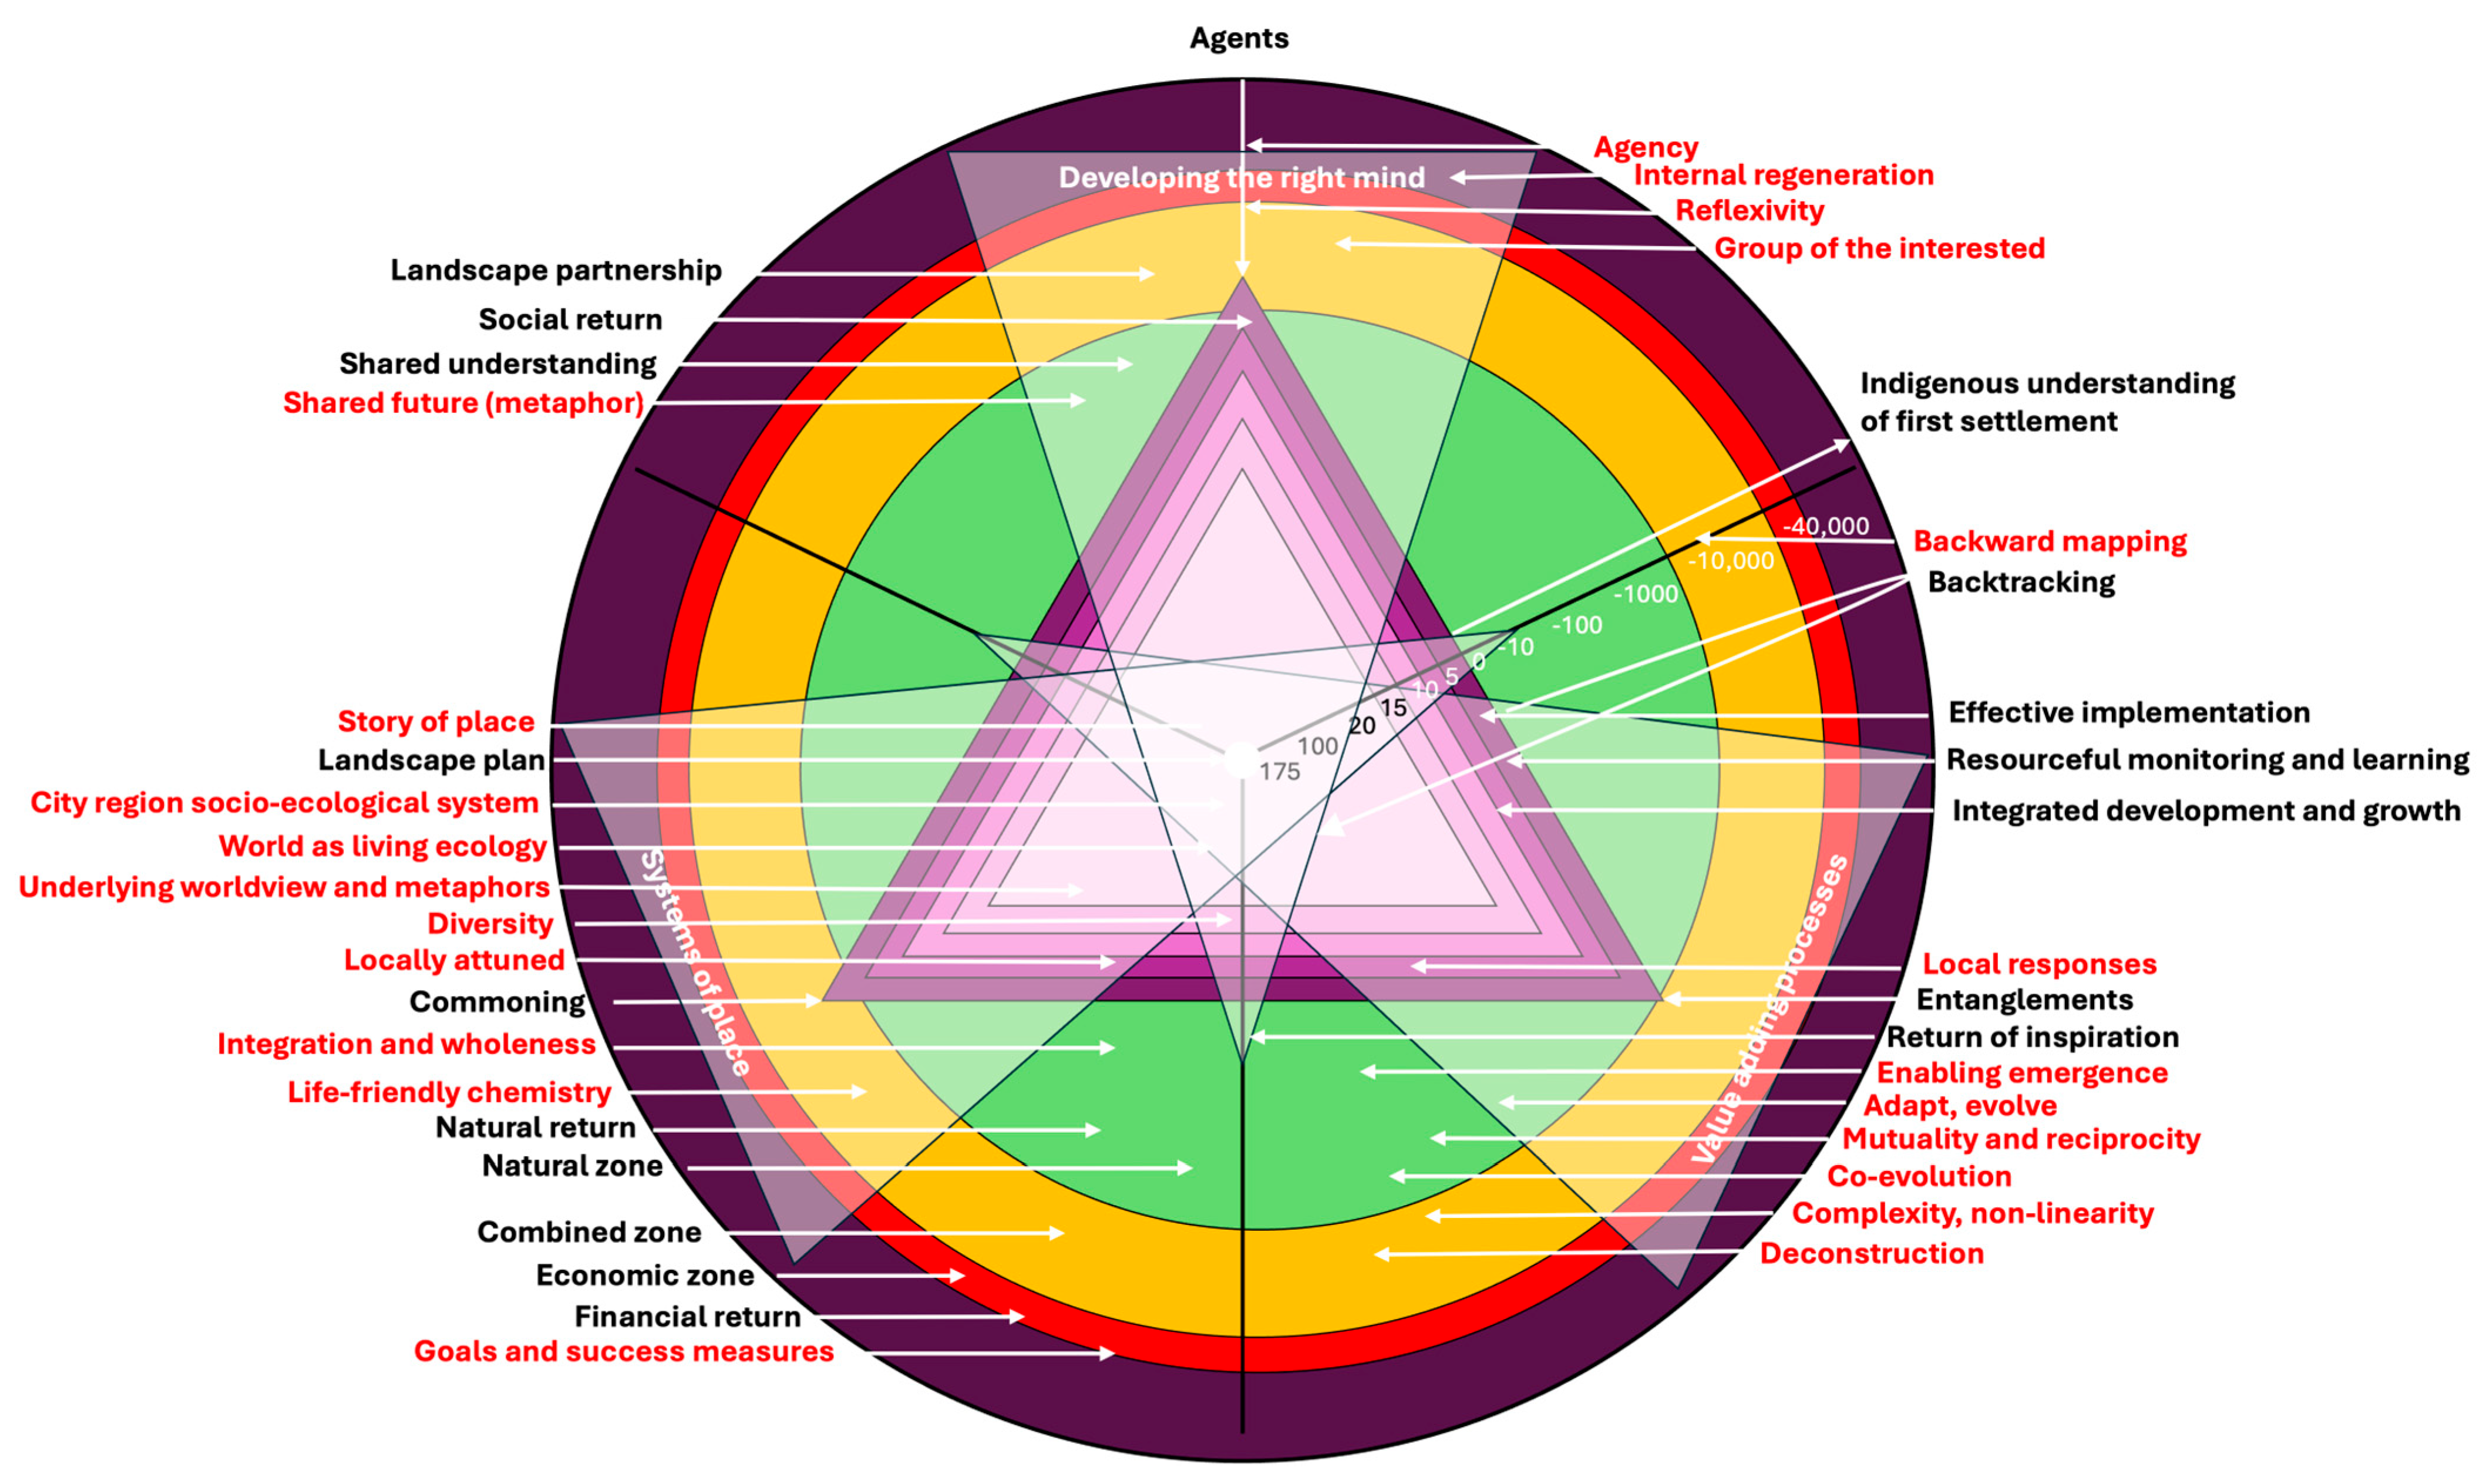
1088. Regenerative Mindset Wheel (https://www.thinkplaceglobal.com, 2023)
(A sequence of accumating pillars?)
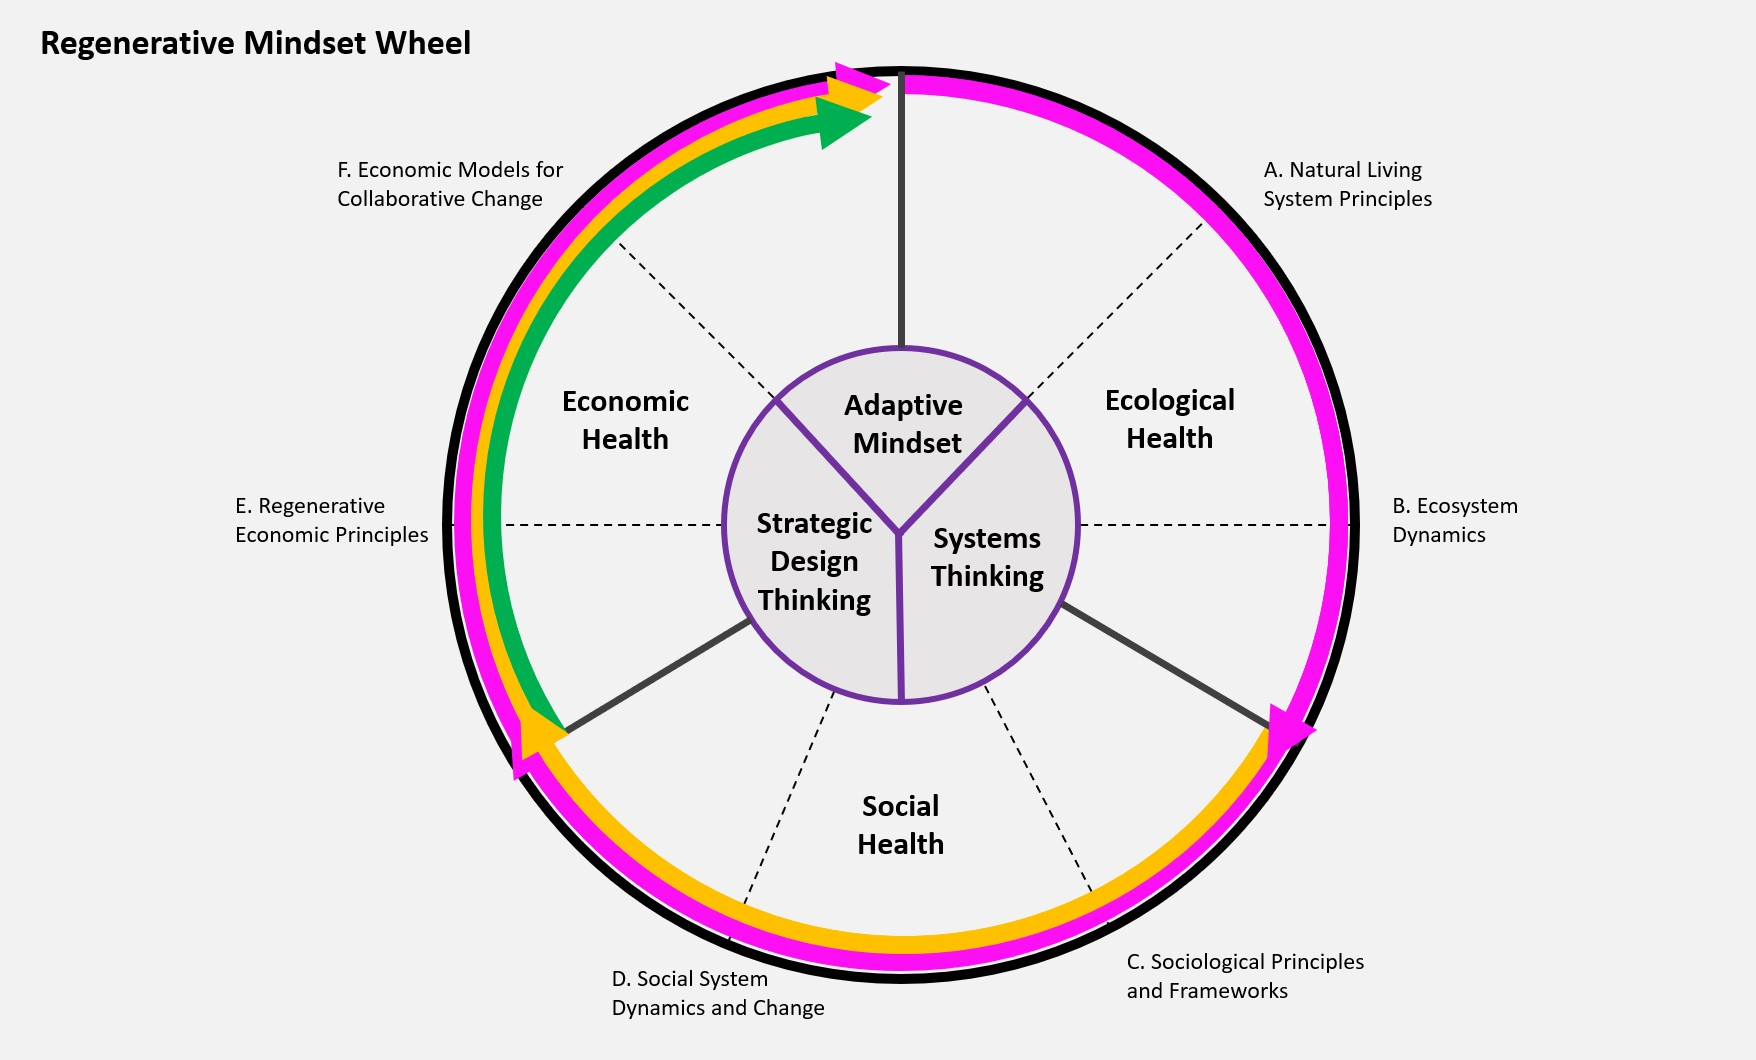
1089: Regenerative (based on slices of apples?) representing living systems (Warden, 2022)
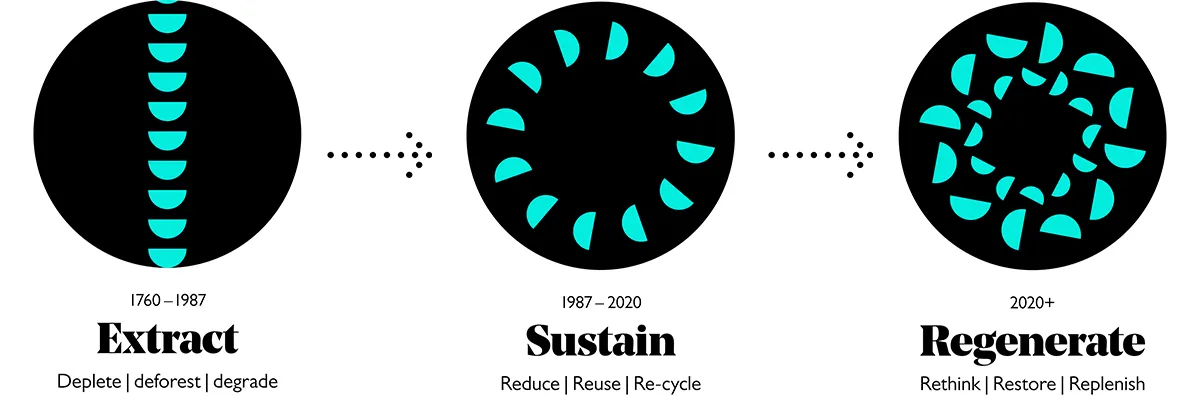
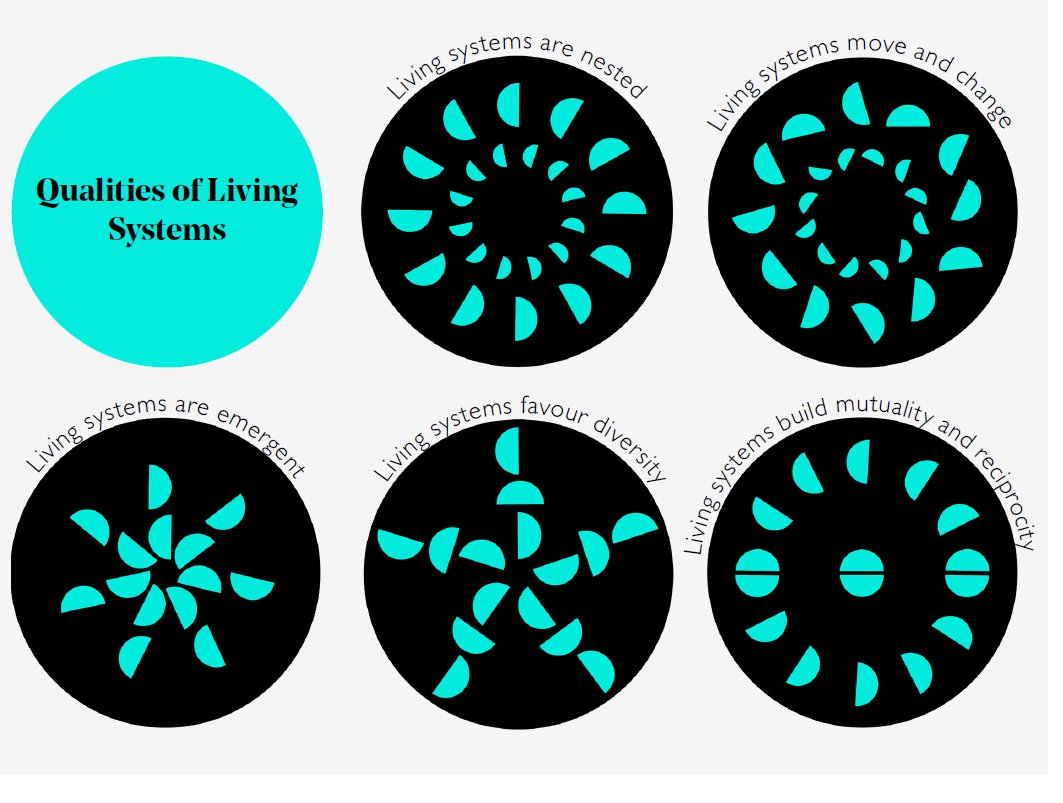
1090: Signal distortions (Aracil, 2025)
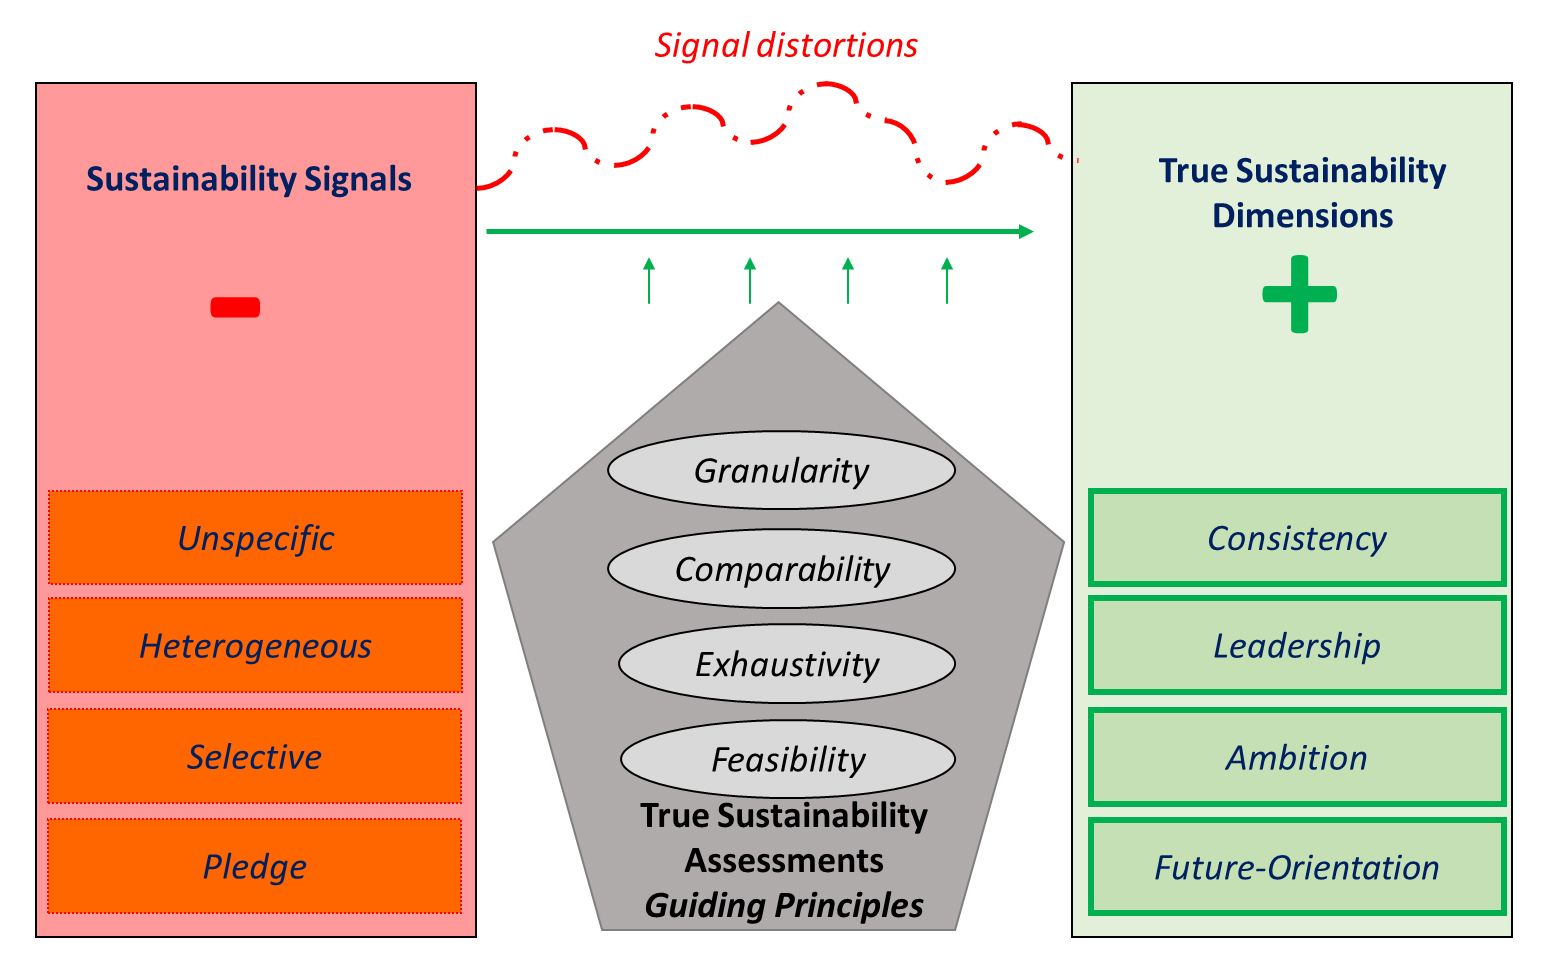
1091: Beyond Carbon Tunnel Vision (Meidl and Medlock, 2023)
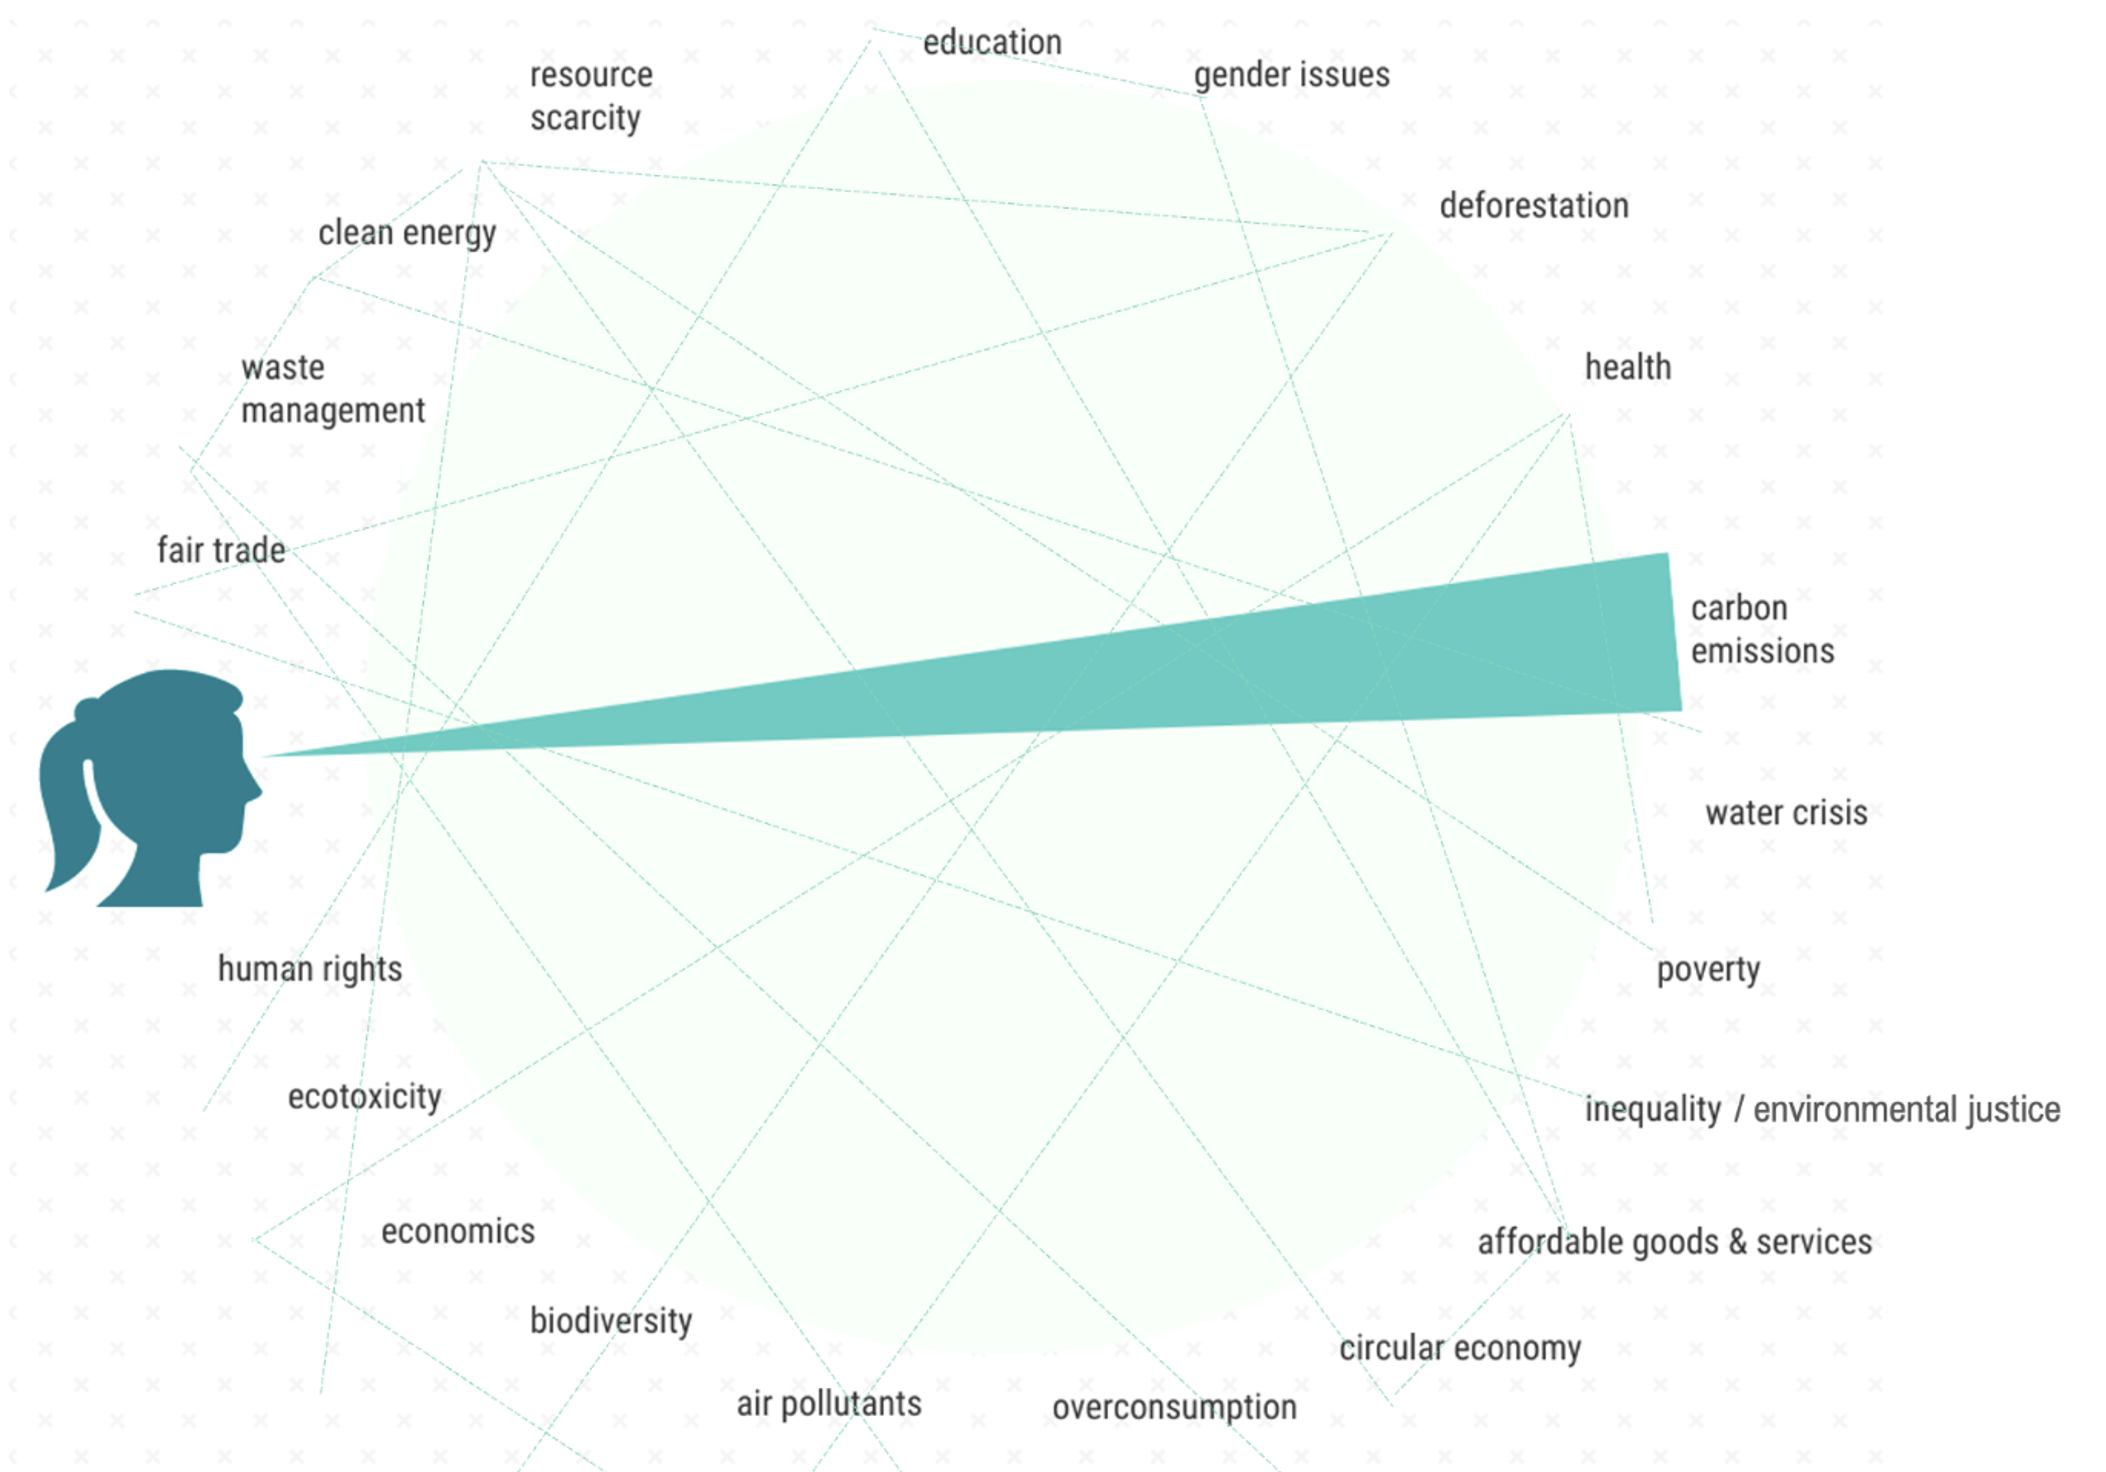
1092: Hope and imagination for Response-able agency (Hultin, 2025)
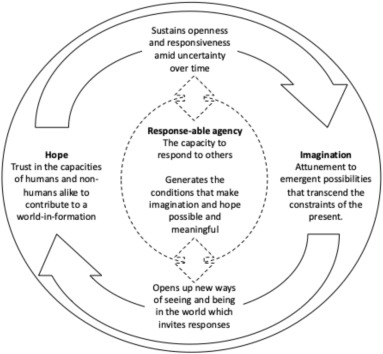
1093: Human-nature resonance (Artmann, 2023)
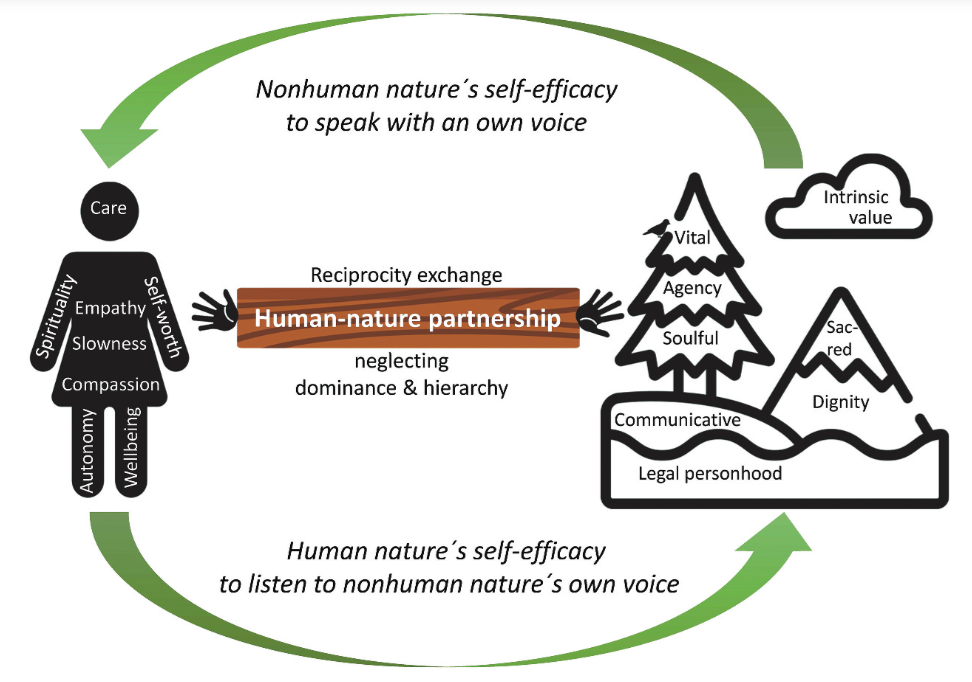
1094: Post extractivist (War on Want, 2019)
1095: Nature positive (ICMM 2023)
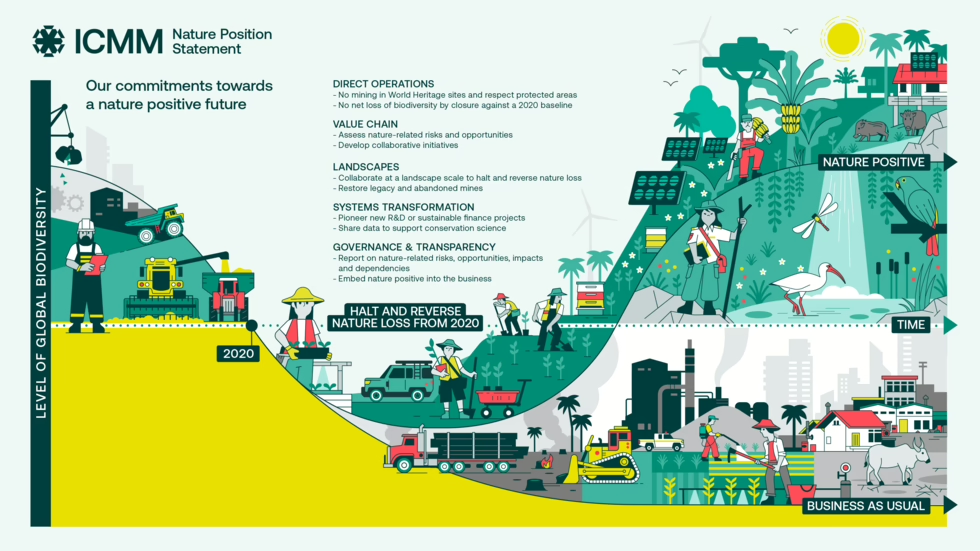
1096: Nature Futures Framework (Schmitt et al., 2025)
(and b: three horizons, and c: positioing of some research groups).
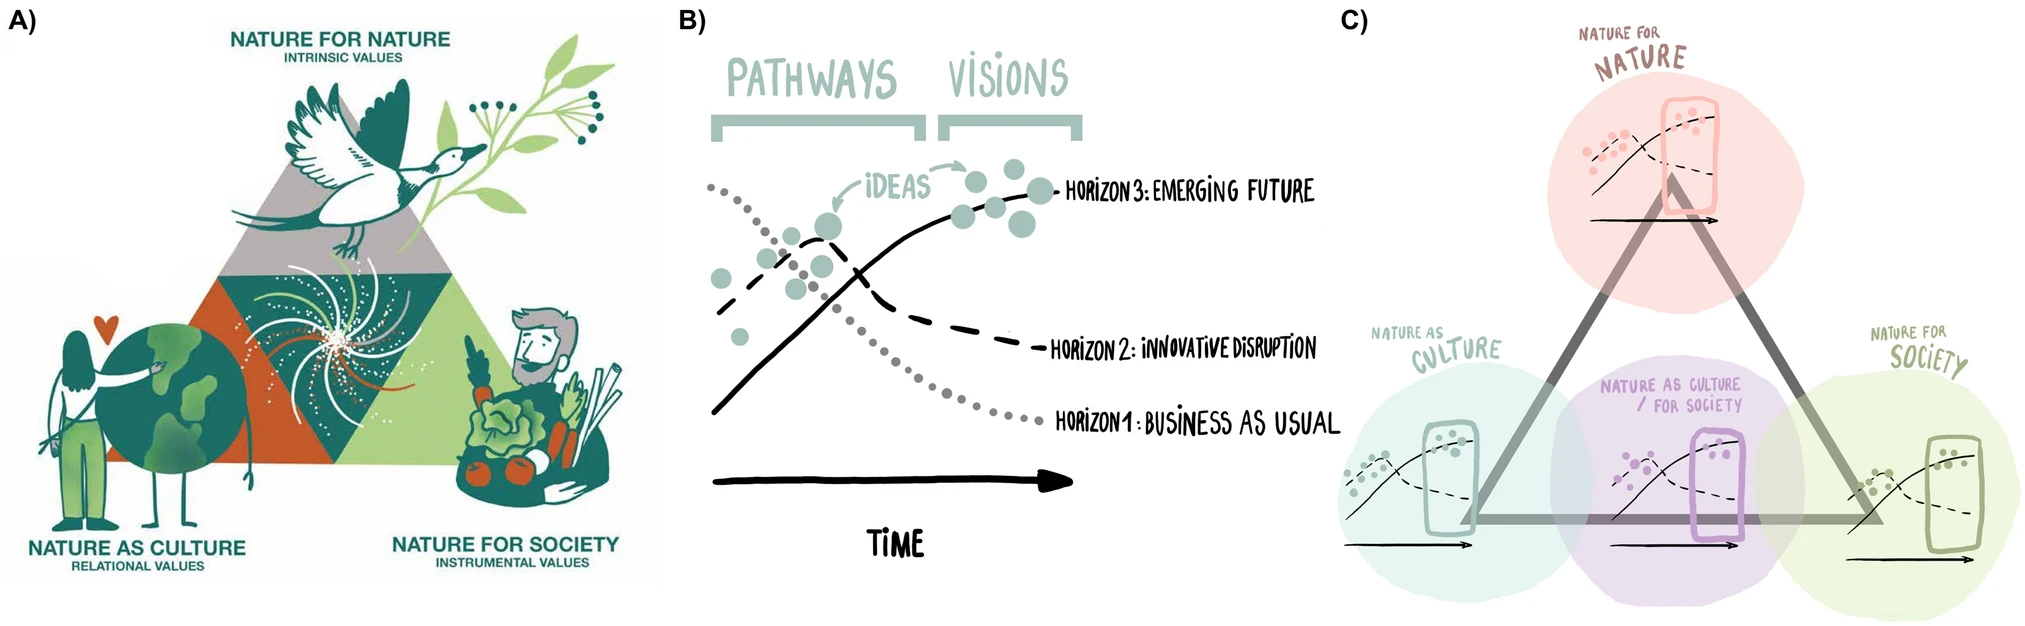
1097: Empathetic Thinking Holistic Framework (Fleming, 2022)
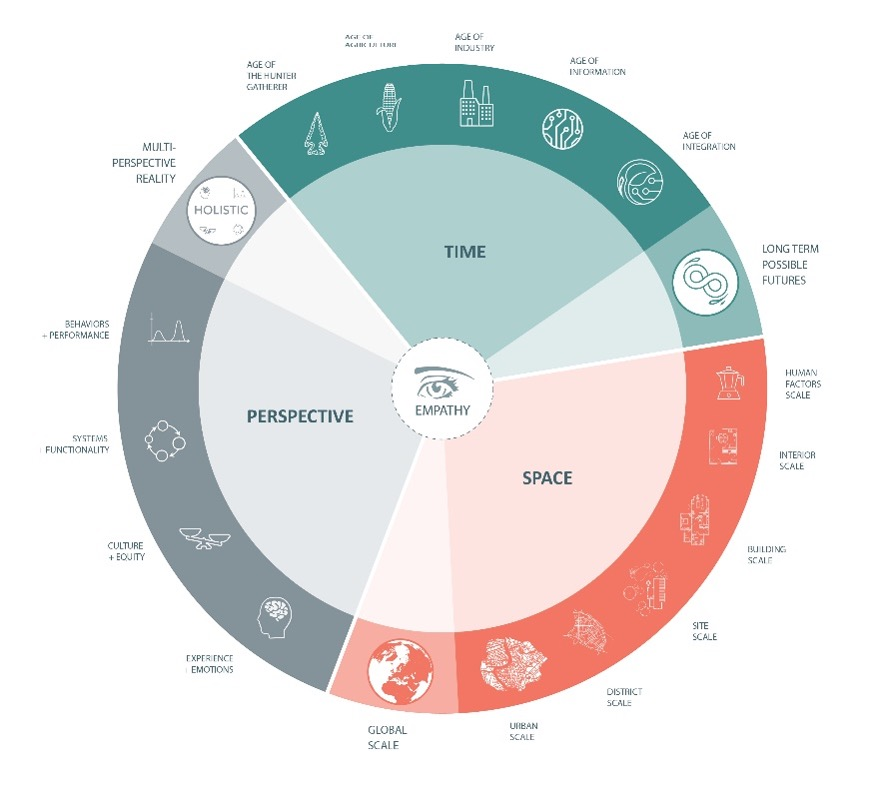
1098: Neo-animist (Helkkula and Arnould, 2022)
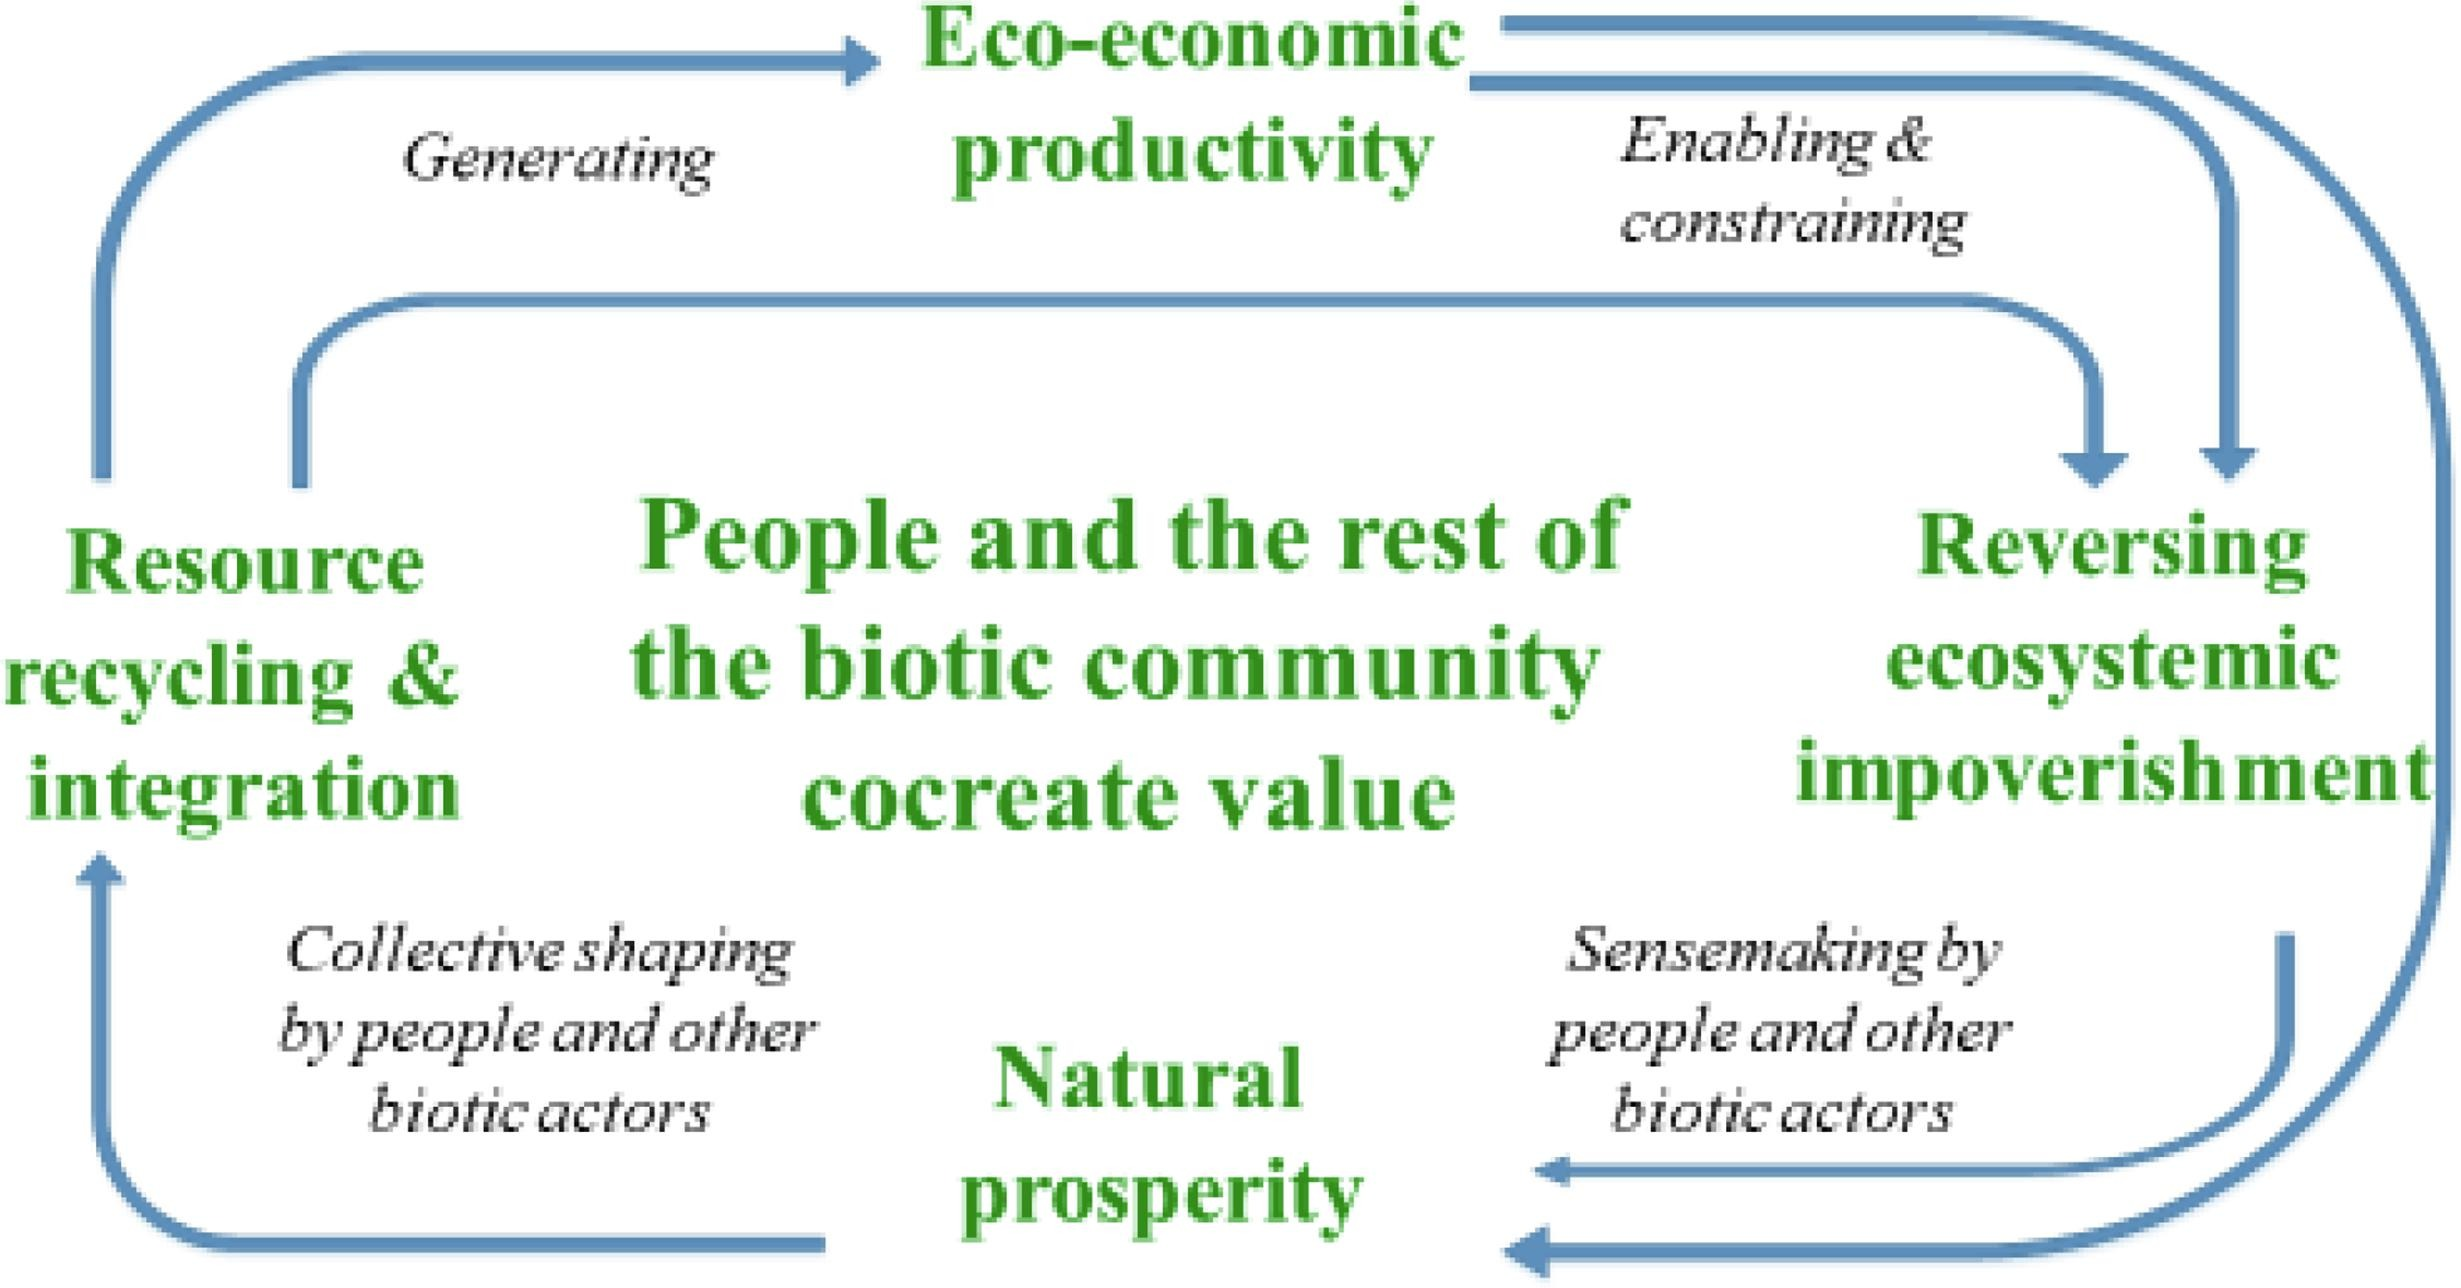
1099: At the same time (Tàbara, 2023)
Moving towards regenerative development pathways depends on the extent to which human-systems interactions contribute to improving and restoring both social and biophysical capitals at the same time (Q1). In quadrants Q2 and Q3 social-ecological systems are instable and tend to move toward negative development pathways or negative basins of attraction, eventually leading to degenerative vicious circles of development (Q4). In Q4 not only future opportunities for human welfare, dignity and equity are reduced, but also the basic conditions that make life possible on Earth are undermined. Achieving a net-positive tipping point leading towards Q1 requires deep transformations in social-environmental practices at different levels of agency and also in the ways humans conceive and perform all SEIC subsystems’ interactions.
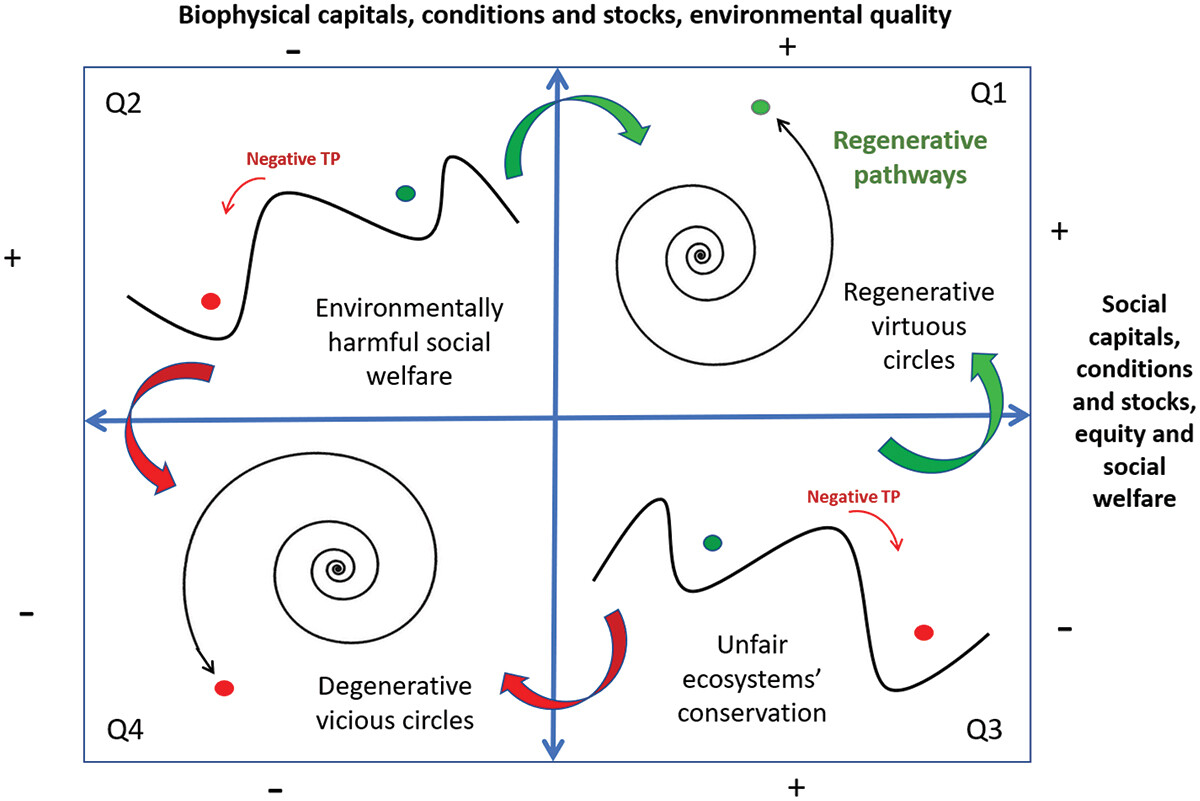

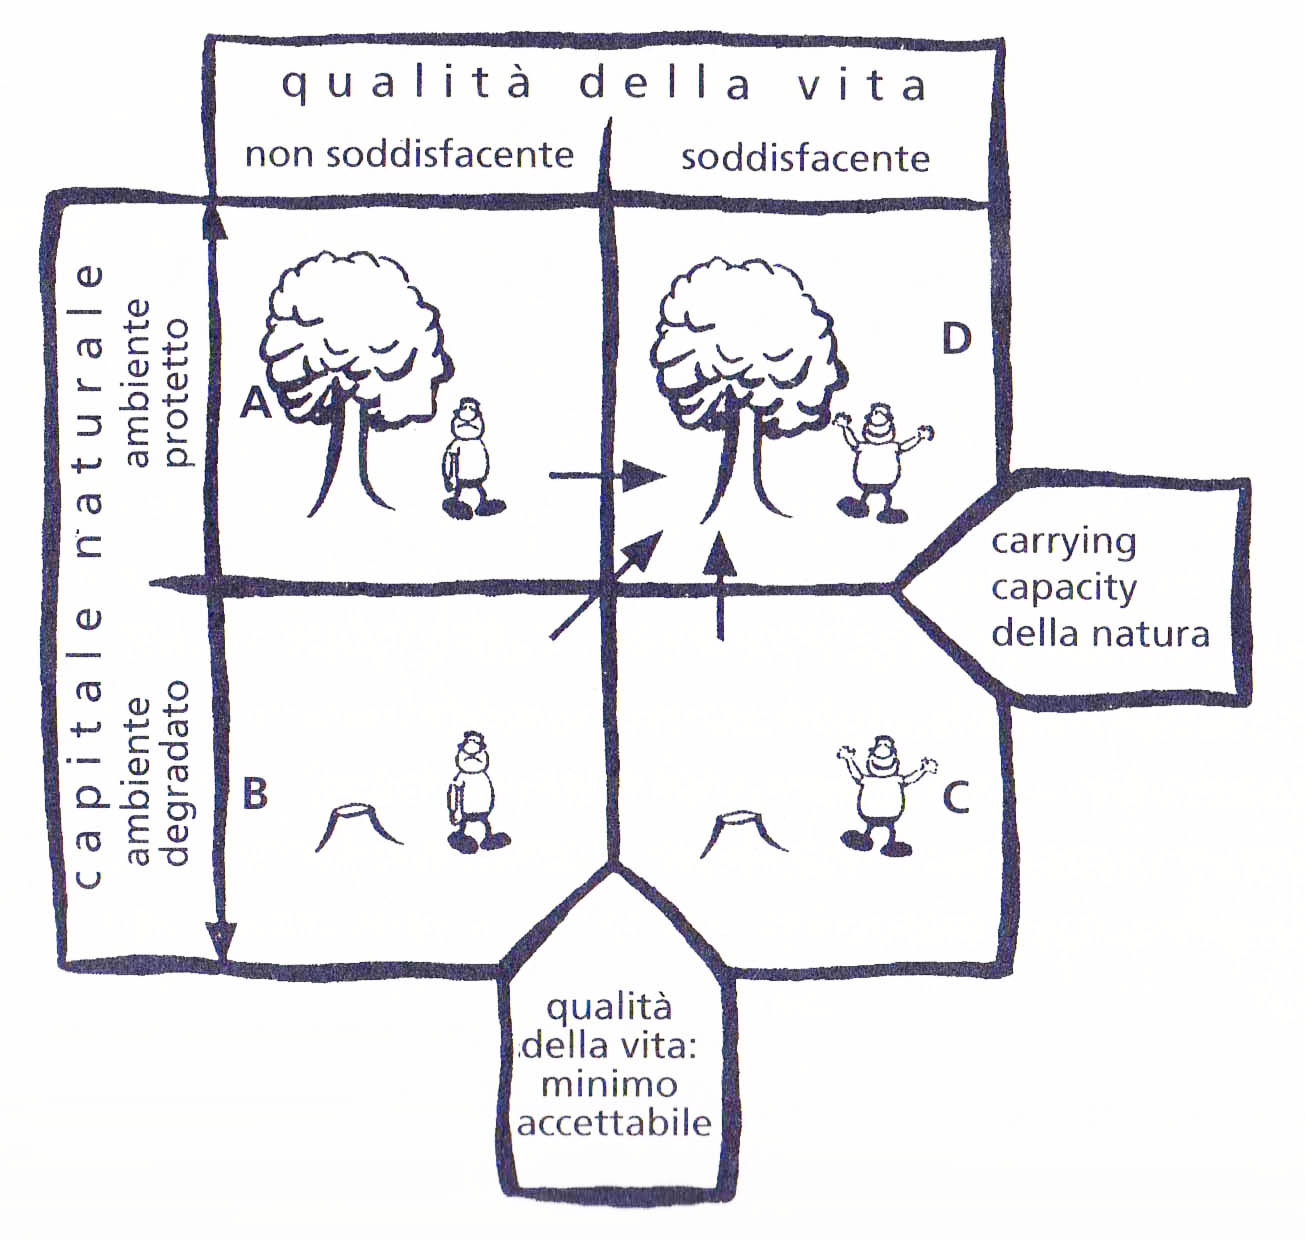
Julian Crawford
March 18, 2009
Hi – what a great inititative – love it! Sustainability in all it’s beauty, complexity and diversity. People working to understand, appreciate and adapt..
Anna Hughes
March 18, 2009
Hi Sam
Great resource you have collated here. Somewhat overwhelming viewed all at once. I struggle to see the value in ‘models’ sometimes. I think they are good ‘guides’. The same information (which much of this is) shared in different ways is valuable for the fact that people’s brains process things differently. I’m still looking for the next step. The one that comes after we have established what sustainability encapsulates and means. What is it? How do we communicate it and encourage others to take it on? anna ;)
joanium
April 8, 2009
The reason why ‘decent homes’ is in the public sector in diagram 37 is because it reflects the UK government’s ‘Decent Homes Programme‘ for improving social (public) housing.
Samuel Mann
May 12, 2009
Thank you.
brian kesner
May 12, 2009
Contact Ken Haggard, architect/professor, for a great diagram which also shows the evolution thru history of the aspects of sustainability. 805.438-4452.
Thanks for your wonderful collection. I will expect to see it in book form some day.
Samuel Mann
May 12, 2009
Thanks Brian, I will contact Ken.
Have a book on teaching sustainable practice due at the end of the month and then a software engineering one chasing it, but yes, a book tracing these images would be an interesting project.
Cheers
SaM
Chris Yalonis
June 24, 2009
Hi Sam,
I have a new sustainability consultancy called Sustainametrics that comprises a team of sector and functional experts as well as a development team that is building an
open source platform to help organizations do assessments, develop goals and strategies, track progress, view performance dashboards, and output reports for stakeholders. What licensed software have you seen that does a good job at encompassing a solid Sustainability framework? Also, what platform (ie. Saas, social network, Database, content management, etc.)do you recommend that we build upon for sustainability solutions. We want to allow templates by sector and for practitioners to add to the database (with vetting/approval)
Aaron
May 27, 2009
I am surprised that my work appeared here. Beautiful and informational post, it would have made my master’s project impossible to complete.
Daniel Montano
June 20, 2009
Funny. A While back in a blog posting I wrote that all diagrams and conceptual models are reductive.
Now I can see that you are featuring what I think is one of the most reductive diagram I have ever made.
I drew it because it looked like a ‘generic’ diagram…I was hoping it would be easily digestable by the intended audience (business folks).
I hope that I can revisit the idea under a different vein of inspiration.
João Miguel
June 26, 2009
It’s fantastic the work you’ve done here. So many charts.. And they gave me lots of ideas and some guidance also to a work I’m preparing for presentation at university. I’ll have your website as reference in this paper. ;)
Julie
July 4, 2009
Amazing treasure trove of visuals for sustainability. I have been looking for this. I recently made a video called “Visualizing Sustainability” that is yet another “look” of a very different kind.
Description:
Professional Visual Facilitators Mariah Howard and Julie Gieseke bring whiteboards, pens,cameras and one question to the Maker Faire: What does sustainability look like? Here is the harvest of images they discovered from the Makers.
You can view it on YouTube
Samuel Mann
July 22, 2009
Thanks Julie, amazing initiative. I really like the Dissanayake quote on your website: “Innate does not mean inevitable. Most innate aptitudes in humans require fostering”. I also like the line on Mariah’s page: “we’ll find out what wants to happen next”. As you found, these images are bursting to do more.
sheri
July 14, 2009
Hi,
I’d love to invite you to check out this visualization as well which uses the integral map. we used it for our imagine cascadia project and it was invaluable!
http://www.bchealthycommunities.ca/Content/Capacity%20Building/Index.asp
Thanks.
Sheri
Sara Mears
July 15, 2009
Fantastic work. I will be referring to your list a lot! Do you mean Strong Sustainability as opposed to Stong? First image with the concentric circles.
Sara
Samuel Mann
July 16, 2009
Yes, thank you Lisa, Strong. Incidentally, SANZ has just released this think tank report: http://www.phase2.org/documents/Strong_Sustainability_for_New_Zealand_v1_May_2009.pdf
justposted
July 31, 2009
Great bit of research – thank you for both doing and publishing it. A great find for me! A few more that you may wish to include (each one should be the first hit if you Google them):
Arup SPeAR
Bioregional calculator
Pharos materials
Colby Senior
August 27, 2009
I think the best diagram is number 23. The other diagrams illustrated the causes of the problems facing our planet or the time we have left before we destroy it, but number 23 illustrates colorfully and clearly how to solve the problem. By taking public transportation, reusing water bottles and grocery bags, installing solar panels, and recycling, we can be part of the solution to this very urgent problem.
Sara
August 27, 2009
This is a great resource! Thanks so much!
John Thornton
September 19, 2009
Great collection of sustainability frameworks. Almost a bit overwhelming to examine with some many here, you’ve done good work in putting these all in one spot.
Marcos Buson
September 25, 2009
Great compilation !
Marcos Buson
PhD Researcher, UFSC, Brazil
Research field: Planning for Sustainability
Tamara
October 3, 2009
What a great resource! Thanks so much!
maMun
October 9, 2009
Sam
Your total effort is the sustainability. GREAT.
James Abrahamsz
November 5, 2009
Great idea, your initiative is very helpfull for my teach process. Can I get some refferences about how to computing the sustainability. Thanks before…
Rick
November 11, 2009
A local professor, now retired from UNL but active in leading local discussions, has been using a five-pronged image to describe his view of the applicable domains that comprise sustainability. P 4 of this document has the image, the document provides context
Click to access strategy_for_sustainability.pdf
marika
November 21, 2009
Great range in your collection of models: few have collected as many, for any field.
Here is a little contribution to understand this plethora of models: Very similar visual models exist in many other fields: the iconic images are not specific to sustainability, but a range of images that the intellect uses to model and represent, in any field (eg medical models, mind models…). The images are significant of a state of intellectual thought rather than what the intellect represents, and there is a developmental process from one image to another, in both complex and simple directions. That’s why there is no general agreement on how to define and model sustainable development or on the values attached and evaluation methods. Topology can be used to study the shifts and deformations of these image-models and the valuing can also be modeled.
Too bad we act out policies and ‘solutions’ based on these models… for just ‘more of the same’.
Durable
February 6, 2010
Wow, that has to be the most thorough analysis of visual representations of sustainability. My personal favorite is the 3 section Venn Diagram, by far the most easy to understand. Very nice collection of images, excellent. It’s cool to see the evolution of the concept of sustainability too.
Larry
February 11, 2010
Hey very nice blog!! Man .. Beautiful .. Amazing .. I will bookmark your blog and take the feeds
sgrplanet
February 19, 2010
hello!!!, your blog was very useful for me!!! thank´s for your contribution, I have saved a lot of time with the same idea.
David Rojas Elbirt
March 29, 2010
What a way to help us all think abaut planetary futures.
Muchas gracias!
Any compilation on models or examples of applied models on desining locations to apply sustainable living?
Samuel Mann
March 30, 2010
Thanks David, Not that I know of. In looking for images for this compilation I’ve certainly seen a lot of models from architects showing their design for a sustainable development.
SaM
sibeso mukelabai
April 20, 2010
am deeply moved by the extent at which we are ‘committing suicide’ by exerting so much pressure on the world that we entirely depend on. am completing my 1st degree program in under three weeks….. now am certain that am pursuing environmental engineering for my masters degree. thank you all for your initiatives and contributions to making our world a better place. am inspired!
Karen Janowski
April 28, 2010
Funny and a little sad, too. So many different ways of conveying essentially the same things – I just hope that this variety of visual ‘languages’ will reach scads of different people and get the message across so we can act with all due speed!
Karen Janowski
April 28, 2010
Btw, you should add the Real Eyes animation:
Samuel Mann
April 30, 2010
Thanks Karen,
Is certainly a nice animation (http://www.realeyes.ie/sustainability-explained-animation/).
SaM
Team 4
June 1, 2010
We’ll be salal!
claudia phillips
August 26, 2010
How do I add our Sustainable Design model to your list?
Very interesting site!!
Claudia
Alex Gore
September 15, 2010
seems like sometimes people take to much time thinking about sustainability rather then solving how to seamlessly integrate it.
Adriano Ellero
October 23, 2010
I hope to add small contribution to the entire work done in this web site.
Greg Haunschild
October 28, 2010
Love the site! Glad to see someone is recognizing us computer geeks out there who really enjoy environmental sustainability platform development. Keep up the good work!
Vicente Gonneville
November 1, 2010
big league almanac you’ve get hands on
Produce Sperm Volume
December 20, 2010
A low semen analysis evaluates some characteristics of a male’s low semen volume and the sperm that is found in the semen fluid volume. It may be done while investigating a couple’s infertility problems or after a vasectomy to check that the procedure was successful. It is also used for testing the donors for semen fluid donation. Nowadays it’s possible to boost ejaculation fluid with really safe ways including taking herbal pills from the various Internet stores.
David Millar
December 21, 2010
Hi Samuel. Quite a collection. You’ll find more in Wikipedia Sustainability http://en.wikipedia.org/wiki/Sustainability, the Rockstrom planetary boundaries review article in Nature (Sep 2009 tho’ I prefer the New Scientist version of the graph) http://climatesafety.org/great-johan-rockstrom-presentation-on-planetary-boundaries-concept/,
NET’s climate change thermometer and some biodiversity-loss graphs in my http://qewnet.ning.com/forum/topics/un-info-csd-commission-on, Northern Sun’s “build global community”poster http://www.northernsun.com/n/s/4436.html. A whole bunch at http://marukuwato.multiply.com/journal?&page_start=200 including Hermann Daly’s full earth / empty earth: astounding that he was fired by World Bank for implying that the economic growth was limited by earth’s carrying capacity.
Insurance Claims Jobs
January 12, 2011
If two lawyers were drowning, and you could only save one ofthem, would you read the paper or go to lunch?
Tom Bliss
January 12, 2011
Email contact has not delivered a result so trying this –
How can I obtain permission to use the top three images on this page to help illustrate an article in a uk-based academic journal?
Reply needed urgently please, deadline this week.
Samuel Mann
January 13, 2011
Sorry for slightly slow reply, still on holiday here. Sorry, can’t help. None of those images are mine.
However, I have been chasing the originators of all the images on this post for my forthcoming book.
I’m quite sure neither the Mickey Mouse and Stool images have “owners” (of course people might claim the individual renderings).
The bullseye is after Daly. It is very widely used without specific permissions though.
Daly, H. E. (1996). Beyond Growth: The Economics of Sustainable Development. Boston: Beacon Press.
Cheers SaM
One Last Voice
January 21, 2011
Great resources. Great website have linked you to mine http://www.onelastvoice.com
Kervin Cablaida
April 26, 2011
Very informative, a one-stop-site with the collection of “sustainable development” perspective, great effort for Samuel Mann. It worth a good feedback… God bless (“,)
Patricia Santos
July 2, 2011
Excellent collection. If only visualisation was used more…
Victoria
July 26, 2011
This is wonderful! Thank you so much. This gives a clear picture of sustainable development.
Do you have specific information about Education for Sustainable Development(ESD)?
Andri Novi Hendrarto
July 27, 2011
Thank you for your great compilation.
Garry C. Canto
July 28, 2011
you have presented a lot of diagrams showing the sustainability. Can you make next time on the topic of biodiversiry? i am particular on how to make a fishbone diagram.
Ehsan Ranjbar
September 15, 2011
Dear Samuel
It’s great. I am working on my PhD thesis about sustainability of urban spaces. I have founded some of models but yours is more complete and useful for me. I think 4 month later I can send my model thats new for small scales of urban design.
Ehsan Ranjbar
Scott Edmondson, AICP
September 16, 2011
Amazing set of research results illustrating at once the diversity of perspectives around a relatively common core. Thank you for this work and the results.
Steve McCoy
November 8, 2011
Hi, I found your site a couple of years ago and it was so very useful in helping me visualize sustainability… my apologies for not saying so at the time. The fruit of that thinking time is here: http://sn.im/wcvll If you think there may be some visuals that might be useful to add to your collection (I am SO not objective!), then please let me know and I can break them down and send them in whatever is the best format… or, feel free to take screen shots. Many thanks again, cheers, Steve
Ashok Bhatia
December 7, 2011
This is a great compilation!
Regards
Rob Fleming
December 29, 2011
Thanks for the work here. I am drawing a diagram for a sustainability curriculum. shall i send it to you when complete? This was very helpful, thanks again.
atlasphere
January 14, 2012
This is great! thanks for compiling this labor of love.
Here is an article I reference again and again, it is not visual but it is informative.
http://www.orionmagazine.org/index.php/articles/article/5502/
Enjoy!
leadershipliteracies
February 4, 2012
Hi Samuel, Great list. I think the citation you are looking for in #101 is this book:
The Winners and Losers in Global Competition
Why Eco-Efficiency Reinforces Competitiveness: A Study of 44 Nations
http://www.rueggerverlag.ch/page/verzeichnis/detail.cfm?id=166
leadershipliteracies
February 4, 2012
Another one is the Corporate Sustainability Development Model from Dunphy, D. C., Griffiths, A., & Benn, S. 2007. Organizational Change for Corporate Sustainability: A Guide for Leaders and Change Agents of the Future. (2nd ed.). Series: Understanding Organizational Change Milton Park, Abingdon, Oxon ; New York, Routledge, 346 p.
They use a “Waves of Sustainability” model in this book.
Jared de Belo
February 28, 2012
What a sustainable resource! Thank you so much for your efforts.
Jared de Belo
February 28, 2012
What a sustainable resource!!! Thanks Sam.
fullcircuitsustainability
March 2, 2012
Thanks for the collection – gives the mind some new ways to travel. Didn’t catch a diagram with the idea of continually advancing balanced cycles, though. Once we reach sustainability, the world doesn’t freeze in place – it keeps growing as we learn, and systems and societies continue to grow within the sustainable region… Perhaps since this post? Again thank you. http://fullcircuitsustainability.blogspot.com
tutormentor1
March 18, 2012
Thanks for compiling this set of visualizations. I’ve been using maps and visualizations for many years to illustrate strategies adults and business need to take in many places, for many years, to help kids in poverty move through school and into jobs and careers. I incorporate these into blog articles such as these http://tutormentor.blogspot.com/search/label/visualization. If you search Google for “tutor mentor” and click on images you’ll find many more.
What I apply that I don’t see much of in the visualizations on your list is a set of geographic maps showing all of the poverty areas in the Chicago region. Thus, the concepts are intended to create a spatial distribution of resources into multiple places, while also showing the role of many owners in building the public awareness, training and resource flow needed to build and sustain tutor/mentor programs in these areas.
http://fastingforweightloss.net
March 19, 2012
I was just looking for this info for a while. After six hours of continuous Googleing, finally I got it in your site. I wonder what’s the lack of Google strategy that don’t rank this type of informative web sites in top of the list. Normally the top websites are full of garbage.
Dean Walker
March 27, 2012
Hi Samuel, I work with iwi in Te Tau Ihu on sustainability issues. Groups in the Nelson and Motueka area in particular use a Nga Atua Kaitiaki framework under which they carry out a variety of work including cultural impact assessments and culturally-based environmental monitoring. The framework is a sustainability model from a te ao Maori perspective which I think is worth adding to the multitude. It can be accessed on page 8 of the following document http://www.envirolink.govt.nz/PageFiles/425/628-nlcc31.pdf The latest version includes the atua Ruaumoko but is not available online as yet.
Cheers Dean
Bernie Slepkov
April 1, 2012
Hi Samuel
I invite you to explore my websites to see if the animated model I’ve created doesn’t have a place here. http://sustainableniagara.ca and http://for-legacies-sake.ca
Awesome stuff by the way. Quite overwhelming while still thought provoking.
Julie Winnard
April 20, 2012
Brilliant site. I’m working on similar diagrams to explain to people in industry what to do about it, given it’s a desirable state, in their day jobs- i.e. how to compare different strategies or designs and decide which gives you less unsustainability and less irresilience. You’ve saved me the job of having to invent a whole load of diagrams to explain the basic principles of what is sustainability!
I see you are part of Sustainability in education in NZ- do you work with Susan Krumdieck at all?
Particularly also enjoyed the pithy overview you report from a colleague on ipods as deliberately unsustainable items…Thanks.
Bernie Slepkov
April 22, 2012
Hi Sam
This is a great resource. Mind boggling, actually.
I’d tried leaving a post a few weeks back but don’t see it here. I tried to inform you about a model for sustainability I designed and animated, which can be seen at my website. I have another animated version which I’d be happy to email you.
sitasupomo
July 11, 2012
great resource! two thumbs up!
Live Video
July 25, 2012
Live comments are enabled by default. They can be disabled at any time. You should always have a dedicated comment moderator for high-traffic events.
Ric Stephens
August 18, 2012
An Escher version:
http://www.flickr.com/photos/ricstephens/7155490731/in/photostream/lightbox/
Key Planning Concepts:
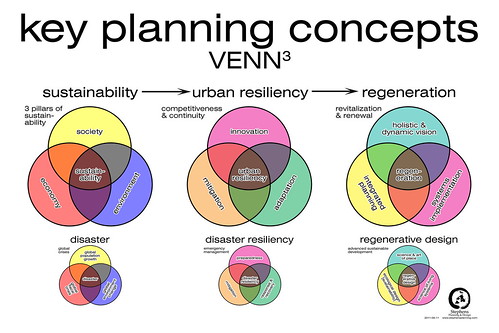
Ivan
November 4, 2012
Great job Samuel, your blog and info came accross to a research I´m doing to clarify what is/are the differences between sustainable (sostenible in spanish) and sustaintability (sustentabilidad), if ever there is in spanish such a difference, as it seems that in english both are just the same.
I was surprised by some models I haven´t even seen in my life. I do work for the development world, and it is refreshing and motivating to see that are also free of charge people helping and supporting the sustainability against pure irresponsible consumption.
Congratulations!
zoebanfield
March 13, 2013
Reblogged this on Bennington Sustainable Food Project and commented:
Unpacking buzzwords, what are some different things that people can mean when they use the word sustainability? Here some interpretations are represented graphically.
Josip
March 20, 2013
This is Bible for sustainable development
Jeetesh Rathi
May 17, 2013
Great Work, So many charts, diagrams, figures, images …. simply amazing work
Love that
リモワ アウトレット
October 18, 2013
http://cheaprimowal.tumblr.com/
Sudar
April 3, 2014
Good work done. Got a full over about sustainability.
mike
May 6, 2015
I just wanted to say I love the graphs. I think that seeing things visually really can help us understand things better. I think that people always look at healthy transportation like biking or walking for sustainability for our eco system. The food we eat though support healthy soils though too.
Michelangelo Du
June 20, 2015
https://drive.google.com/drive/folders/0B7-r5QSjcuoTTHpyM1hPZ0JzUk0
Please help me add practical, exponential, and leapfrogging technologies, appropriate for a Philippine and South East Asian World of 2106, using real schematics, or ones thought thru by leading edge engineers and industrial designers.
You are free to screenshot any data here.
If there is an interesting venture, or community concept ( i am also a Rotarian and a former Jaycee ( Junior Chamber International ) ) , please let me know.
Schael engel
July 24, 2015
Really interesting!
car loans interest
July 26, 2015
Hi my loved one! I want to say that this article is amazing, great written and come with approximately all significant infos.
I’d like to see more posts like this .
Frances
August 4, 2015
computingforsustainability.com has potential, you can make
your page go viral easily using one tricky method.
Just type in google:
Kelashy’s Method To Go Viral
Wendell
November 4, 2015
About the Author: Steve P. younger is the Director of Product advertising
for SmartShoot in which marketers visit get stunning photos and video
clip from the best regional photographers and filmmakers.
Shelby
November 6, 2015
A maioria das pessoas que procuram remédio para emagrecer já fez algum tipo de dieta.
Juliane
November 7, 2015
Excellent article. I certainly love this website. Keep writing!
Aidan
November 8, 2015
Des outils adaptés sont mis à votre disposition afin de vous aider à
contacter / échanger avec les autres membres !
download facetime for android
December 1, 2015
The revamped aesthetic design is the result of the production process where thhe
device is being made from metal and strengthened glass, resulting in a smooth but durable appearance.
If you are running the full screen video camera as well aas a wireless
internet connection, then the battery is going to be taxed pretty heavil
on the i – Pad 2. Even more fun is the fact that you don’t
have to download your video to your Mac anymore for
edijting purposes.
Armando
December 2, 2015
Vous devez également vous entourer de gens qui sont également intéressés à perdre du poids.
Salina
December 6, 2015
s with Two Factor Authentication where the One Time Password is
generated and sent to the user via SMS or generated using a Hard Token (A small key which generates a new password after specific
intervals of time. Hope these can help you for playing Mr jump, by the way, on our website we
also provide other free mobile game download, you can find the
veryb hot games in mobile game marketing by searching on our website.
For this tutorial, we will be using a virtualization method to install OS X on a PC.
comment pirater un compte facebook
January 7, 2016
I simply couldn’t depart your web site prior to suggesting
that I really enjoyed the usual information an individual provide to your
visitors? Is gonna be back often to check up on new
posts
Monserrate Trevino
February 15, 2016
I know this web site gives quality dependent articles and extra data, is there any other web page which presents these stuff in quality?
christine
February 24, 2016
Hello! I’ve been following your blog for a long time now
and finally got the courage to go ahead and give you a shout out from Dallas Tx!
Just wanted to say keep up the great job!
dien dan rao vat nha dat
March 2, 2016
whoah this blog is wonderful i love reading your posts. Keep up the
good work! You realize, many individuals are looking around for this info,
you can help them greatly.
সুমন রহমান
April 5, 2016
How I can make a Sustainability tools/App for windows where I can put number and indicator shows the percentage with color. have any Software or idea to Develop?
dien dan dang tin
January 29, 2017
Hello to all, as I am actually keen of reading this webpage’s post
to be updated daily. It consists of good stuff.
Mairadum
September 5, 2017
welcome you Like to blow my nickname (Rita48)
Copy the link and go to me… bit.ly/2xKLUZx
8011135025200
Joel Cosh
December 9, 2017
It’s enormous that you are getting ideas from this paragraph as well as from our argument made at this time.
Sheela Selvajothy
December 3, 2018
This is awesome I was wondering if you have done a project mapping on food waste management for marks and spencer. I am postgraduate student and have a project to do on Marks and Spencer’s sustainability on food waste management and how its been mapped past and present.
Professor Tony Abbott
September 12, 2019
Professor Mann, Thank you for providing this resource, which I use each time I teach the subject of sustainability. I have also enjoyed your book “Sustainability Lens.”
ThollaGaf
December 9, 2019
Martial arts competition in prison! The champion will be releasedпјЃCheetah soldier 21
https://ug.video-video.lv/video/8o%2FtTUqhUjuDoUE%3D.html
Vivian Black
January 22, 2020
I love how you mentioned so many different things such as Edward Barbiers Venn diagram that shows the analytics approach for the process. My husband is looking to join an action group for environmental sustainability but wanted to understand it more before he did. He will keep these tips in mind as he searches for a professional group near him.
2030 Global Vision
April 14, 2020
Amazing collection – many thanks for this fascinating collection!
laurette
May 26, 2020
I love it. thank you!
Claudia Melo
July 29, 2020
Is there any of them you like the most (in terms of capturing you current view of sustainability)?